Chapter 6
Social Analytics, Metrics, and Measurement
Chapter 6 hits our personal passion with regard to social media and business: measurement. This chapter covers the question that keeps most decision makers and change/process champions up at night: “How do I measure this and make sense of it?” It takes a hard look at the rationale for establishing specific metrics along with the tools and platforms that provide and analyze these metrics in the context of your objectives.
Chapter contents:
- Why we measure
- Social analytics
- Know your influencers
- Web analytics
- Business analytics
Why We Measure
Before looking at how companies measure and analyze their social efforts, let’s look at a more fundamental question: Why does measurement matter?
Measure to Inform: Numbers and Stories
At the most general level, measurement informs your teams, departments, and other stakeholders about the state and outcomes of some process or effort, in this case programs related to the social customer experience. Measurement enables you to see—and to share with others in your firm—how current metrics compare with yesterday’s, last week’s, last month’s, and so forth. For example, how many customers asked for help on Twitter today? Was it higher or lower than yesterday? It’s a comparative exercise. When you measure these outcomes, you’re able to see how well the effort you’ve undertaken is accomplishing its goals. Of those customers on Twitter, how satisfied were they with the help provided? This is often a comparative exercise too, but the comparison may be to a future target or goal as easily as to an historical number.
Note that measurement is also intended to inform. Measurement is inseparable from communication. When you think about measurement, it’s important to reflect not only on what you’re measuring but also on how you will communicate those measurements and to whom. In business, we talk about measurement and reporting. But keep in mind that reporting has a purpose: It helps get things done. Good reporting not only informs; it inspires useful action.
Good measurement and reporting are always a mix of qualitative and quantitative. Metrics may tell you what happened, but qualitative insights can point out why it happened, how it happened, or what it means. Sometimes those qualitative insights are a product of analysis, such as the process of breaking data down to better understand it, and sometimes they are inherent in the data itself—the expressed opinions of a customer, for example. In fact, social data is much richer than traditional forms of business data in terms of the qualitative insights it offers based on quantitative metrics, and it’s important to take advantage of that richness.
Finally, measurement is about stories. Note here that we do not mean “made up stories that pervert or obfuscate the truth” but rather the combination of objectively observed data and your professional insight which provides meaning. It’s all the more puzzling, therefore, that so much social reporting inside companies consists of datasheets filled with numbers, absent accompanying text to explain or interpret what the numbers are saying and what actions may be indicated as a result. On this point, consider the following quote:
Power corrupts. PowerPoint corrupts absolutely.
—Edward Tufte, professor emeritus of political science, computer science and statistics, and graphic design at Yale
For more on the effective and objective use of data and the importance of stories particularly when using slide software, see:
www.edwardtufte.com/tufte/powerpoint
To put it simply, effective reporting is about numbers and stories. Think about how things get done—when they get done—in the U.S. Congress. Generally, Congress sponsors a study to better understand how significant and widespread a certain problem is. Thousands of pages of data are then delivered. But the data alone doesn’t drive action. To get action, you also need citizens who are willing to testify about the impact of the problem on their lives. With data alone, nothing gets done.
The same is true in a business or any other organization. In fact, if you provide numbers without supporting stories—often called use cases or customer scenarios—you’ll find that the decision makers on whom you depend will make up their own story—and perhaps not to your liking. We’ve all had the experience of seeing an executive latch on to a seemingly random metric in a report and then make that metric an all-important focus. You can help prevent this by never delivering a number without a story.
Performance, Return, and Insight
Another way to answer the question “why measure” is to ask, “What is the purpose of this measure, and how will this measure be used?” In social customer experience, business-related measurements generally apply to performance, return, or insight.
Performance
First, measurement is used help people understand how well social channels are performing. How many customers arrived via this or that channel today? What did they do? What did your organization do to drive customer activity? What did your team do to manage or respond? These metrics typically include visits, views, posts, and the like. Note that these metrics are often denigrated as meaningless or fluffy compared to more established measures like sales or margin or headcount. In fact, if you run an SCE effort, these metrics are critical to understanding what’s happening in your channels today. They are often referred to as operational metrics, which is a good way to distinguish them from financial metrics. When sufficiently meaningful on their own, or when used in combination, for example, as a ratio of current to prior visits, they are often called key performance indicators (KPIs).
Return
Beyond performance (the state of what is happening) you can measure to understand the financial return (the impact of the change in state) or other benefits that your SCE efforts are having on your business. As noted in Chapter 5, "Social Technology and Business Decisions," return might be expressed as increased sales or reduced cost relative to the expense of the SCE program or some portion of it. It might be increased loyalty, measured by surveys (for example, NPS) or customer churn. Or it might be increased effectiveness of current programs, such as online advertising. This is commonly referred to as return on investment (ROI), discussed in detail in the final section of this chapter.
Insight
Finally, measurement helps you to better understand customers and markets, the drivers and nuanced characteristics that enable or constrain performance and return. These insights enable you to drive toward higher value or to avoid otherwise hard-to-spot challenges. They can also be of intrinsic value in themselves when directed to the right parties within the organization. For instance, they can tell the PR group which messages are getting the most traction among customers online or inform your development group how much (or how little) customers liked the product launched last week. They can make clear to the support group which emerging issues may be contributing to support requests, useful data in planning for future capacity. At the individual-customer level, they can even help the organization deliver the right offers to specific customers at the moment they are ready to receive them.
Performance, insight and return: It may be tempting to trade one of these objectives off against another: Stakeholders often have a favorite and will insist that only one really matters. The truth is that every SCE measurement program must encompass all three.
Sources of Data
“That’s all fine,” you say, “but where do I get the data I need?” To create an effective measurement and reporting program, you need access to the data contained in your social platforms, web analytics tools, and business systems.
Social Platforms
First, there’s the data that comes from the social platform itself. This may mean collecting data from more than platform, or pehaps you are using a single platfrom that covers both on-domain (your website or a support forum you own) and off-domain (for example, the number of posts on a specific social network that is relevant to your business). Either way, you need to understand all the metrics that are available from the systems you use to power social interaction on your website, and you need to understand the continuously evolving set of tools that social networks like Facebook and Twitter make available to you. There’s no substitute for this knowledge; make an effort to identify and understand everything that’s available, and then choose the metrics that are most meaningful to you.
Web Analytics
Second, there’s the data that comes from web analytics platforms. SCE exists within the larger context of the digital experience you are creating for your customers. The website is the heart of that digital experience, and web analytics measures what happens on the website. Most social platforms stop short of providing all of the capabilities offered within your website, so you may need to add web analytics skills and tools to your toolkit.
Business Systems
Finally, there’s the data that exists in business systems. This data is critical to providing context to the prior sources of data: You can’t measure the impact of your social efforts on sales if you don’t have sales data. Likewise, you can’t measure cost savings if you don’t have cost data. You can’t tell whether social participants are customers without connecting to your CRM system. Unless you have transaction history, you can’t tell whether social customers are buying more, less, or the same as other customers.
Measuring return is always a process of combining social data with business data, relating what you are doing to the business results—generally measured in dollars—accruing as a result. Note here the importance of tying social measurement to financial measurement: As this book’s co-author Joe Cothrel likes to say, “It’s important to connect your metrics to your business objectives: In an expression like ‘A * B = C’ if neither A nor B has a dollar sign associated with it, then C won’t either. If that’s the case, you should be worried.”
In the remaining sections of this chapter, you’ll explore these data sources in detail. When you’ve completed this chapter, you’ll be well on your way to becoming a social measurement pro!
Social Analytics
Social platform measurement and analytics have improved considerably over the past 10 years, as organizations increasingly treat their social efforts as part of the business strategy and operations disciplines rather than as one-off experiments. Every platform maker, from enterprise platforms like Lithium Technologies, Oracle, and Microsoft to large social networks like Google+, Facebook, and Twitter, is in constant dialogue with business users to better understand the specific types of information needed to properly manage and measure SCE.
As noted previously, there are quantitative and qualitative aspects to social analytics. Consider first the quantitative side.
Quantitative Social Analytics
Every social platform produces metrics, and every social manager uses them to measure and report. An example of a typical social trend chart is shown in Figure 6-1.
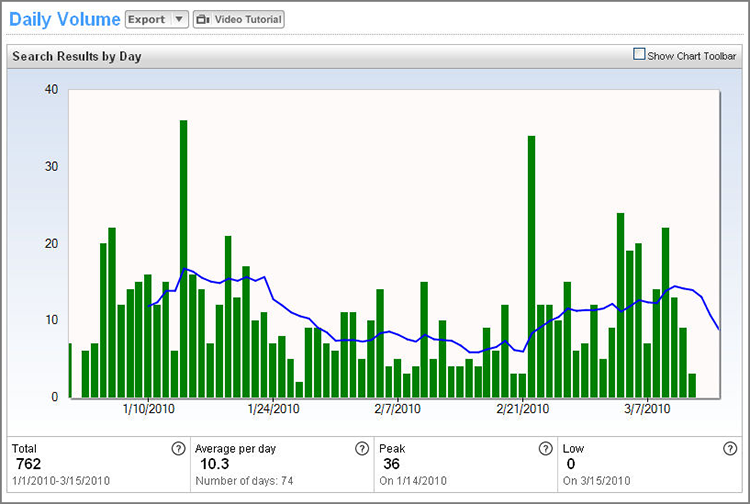
Figure 6-1: Social media analytics: trend chart
The social metrics that are available to you depend on the platforms you are using: a word to the wise when selecting your platform! Of course, there are some commonalities between platforms. Table 6-1 lists the five major types of social metrics and some of the specific metrics included in each type. Note that “amplification” and “applause” as used here are terms coined by Avinash Kaushik, featured in the sidebar that follows.
Table 6-1: Five major types of social metrics
| Metric Type | Activity Examples | Metric Examples |
| Membership | Members who have joined your channel | Registrations, follows, likes (of brand pages), subscriptions |
| Contribution | Content posted by your customers or agents | Posts, comments, updates, tweets |
| Curation | Organized or classified content | Tags, labels, pins |
| Amplification | Shared content with others | Shares, retweets |
| Applause | Endorsed content | Kudos, likes (of content or users), +1s, friends |
These five are likely a subset of the metrics available to you. In fact, a typical platform for on-domain SCE includes hundreds of metrics that you can use for measurement and reporting. But we don’t we recommend that you use every metric at your disposal. Why not?
First, the metrics available in any platform aren’t necessarily the ones available for your use. Your available metrics depend on the specific applications and features you are using in your channel. For example, if you are using an ideation application, you will have a metric related to the absolute count of ideas. This is a unique type of content that the application invites and tracks. If you don’t use ideation, that metric won’t be available to you.
The second reason for not using every metric in your system is that not all metrics are alike. Some metrics—total posts, for example—provide an understanding of a basic fact about the channel you are using. In this book and in the industry generally, these are called pulse metrics—they help you track the basic health and growth of a specific channel, as well as your overall community or networks. Other metrics—referred to as diagnostic metrics—are more useful for answering specific questions you might have about what’s happening in your community. You need to strike a balance in using these types of metrics, and as a result you’ll likely find yourself “choosing one from column A and one from column B” rather than everything on the menu. The important thing is selecting the metrics that help, over the long run, to articulate and punctuate the story you are telling. Again, we don't mean choose the measures that make you look good but rather choose the most concise set of measures needed to guide you toward success in the context of your business objectives.
For example, in a forum, member behavior around posts can be broken down into two component metrics: new threads and replies. If you see total posts decline and you want to investigate why, you might pull these two component metrics. If you see that new threads declined more than replies, then you probably have an issue with how new users are finding your community, because new users contribute a disproportionate number of new threads. If the reverse is true—if replies declined more than new threads—then you likely have a problem with your superfans or superusers, who in most communities contribute a disproportionate number of replies. Over the course of a year, you may use many of the hundreds of metrics in a system in this way, even though on a weekly basis you look at a much smaller number of metrics in addition to your fundamental success measures.
There’s a third reason as well: Not all of the available metrics matter. The metrics you track should align with your SCE effort and for your business objectives overall. For example, if you are using your Facebook channel to publish content with the goal of driving engagement, then comments will be a pulse metric for you. Or, if what’s important to you is that you respond promptly to comments on your brand page (assuming you’ve enabled replies), then replies and reply timeliness will be of interest.
Putting your measurements into the context of your business may seem an obvious first step, yet too often businesses and organizations fail to make this connection and therefore fail to formally recognize and measure the impact of social media on the business. Without such measurement, it is a stretch to think that a social business program will ever take hold, let alone thrive in a run-by-the-numbers culture. The result is that your social media efforts may plateau at social media marketing and in particular at using social channels for outbound campaigns.
This is really unfortunate, because purely outbound marketing is probably the least effective application of social media and social technology. Remember, the Social Web—unlike TV or radio—is not fundamentally a broadcast medium. Rather, it is more of a forum or place for conversations, some of which may be of interest to you as they impact your brand, product, or service. This creates an opportunity to talk, participate, and gain influence that, to be sure, can be helpful in marketing but can also provide benefits to more general business objectives. Measurement forms the basis for quantifying this work: Your story connects it to your business.
It’s often instructive to see how other companies are using and interpreting quantitative social metrics. You’ll see specific examples in Chapter 8, “Customer Engagement.”
Qualitative Social Analytics
A note of warning: When we say qualitative social analytics, we don’t mean that there are no numerical values in the upcoming section. Rather, what we mean is that the focus of our analysis here is qualitative data, that is, on conversations, the meaning of those conversations, and the sources (people) behind those conversations. The reporting of this analysis typically includes both text and numbers. However, unlike quantitative social analysis—answering questions like “What are people doing?”—the starting point of qualitative social analysis is to answer questions like “What are people saying?” and “Why?” Again, too, note the importance of stories.
Good qualitative analysis transforms the Social Web from a source of largely unstructured qualitative data to a conversational framework that can be viewed and tracked quantitatively. It is this discipline that enables two essential best practices when it comes to applying social media to your business or organization:
- Making sense of what people are talking about in a way that leads to prioritized insights in the context of competing capital efforts
- Connecting these conversations and the results of your programs designed to change these conversations for the better by addressing adverse conversations and building on beneficial ones
In traditional communications, the activities that parallel the study of conversations via social media analytics include press clipping and reporting, focus groups and consumer research, so-called pre- and post-campaign marketplace surveys, and similar. In each of these, there is a specific collection/identification/result process that underlies a fundamental learning process. This learning process is designed to anchor a brand, product, or service in the desires, needs, and reactions of customers, influencers, and others whose opinions about what is talked about in the marketplace matter. In each of these measurement practices, there is a distinct set of metrics or an accepted method of stating a learned or observed outcome.
Start with What You Know
Qualitative social analytics is built around many of the basic practices applied to traditional media—who’s talking, what are they saying—now applied to the (digital) conversations happening on the Social Web. So what’s different? For starters, social media leverages the massively scalable publishing capabilities afforded to each Social Web participant—in simple terms, recognizing that it is easy for reasonably well-connected people to command a reach that rivals TV within local markets or to reach more accurately defined niches and social circles. This means that the well-connected homemaker, or the hobbyist blogger, or anyone else with a defined passion and a basic command of social media publishing can amass a real audience and can exert real influence within it.
Measuring this reach and impact is just as important on the Social Web as it is any place else. Further, because each conversation is time and date stamped, signed by a real person and accessible with a specific URL that is forever discoverable via search, these conversations form a robust body of information that is very useful in managing your business. This is what social analytics is all about.
As a starting point in social analytics, consider sentiment, source, and volume (Figure 6-2). Sentiment is the measure of the polarity of the conversation—positive versus negative with regard to the subject—and is useful in understanding not only the immediate issue of “Do people like _____?” but also the degree to which they feel this way. This is helpful, for example, in refining a brand advocacy initiative.
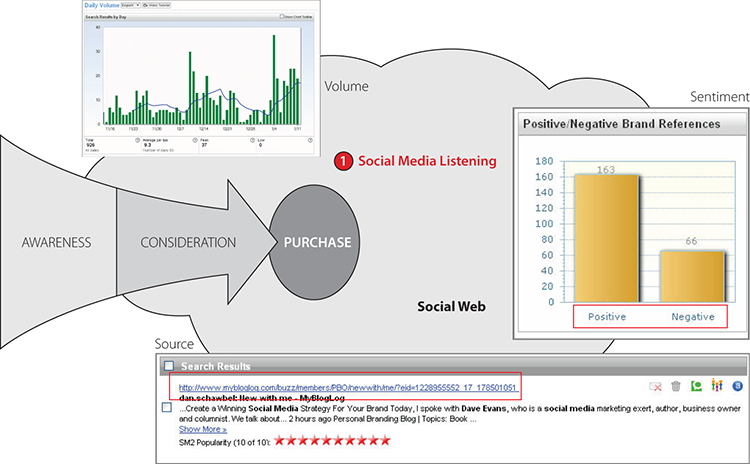
Figure 6-2: Sentiment, source, and volume
Source analysis—understanding the who—includes the identification and understanding of the author. In this context, “author” refers to the person creating the post, review, or comment. Source analysis also includes gaining an understanding of what is being posted where: on-domain in your support forums and company blog or off-domain on Twitter versus Pinterest or Facebook versus Tumblr. This combined view of the source of social content leads to an understanding of where you should be participating on the Social Web, information that is essential in planning a brand outpost program.
Volume measures are used to assess the overall level of conversation about your brand, product, or service: How many people are talking about a particular topic or picking up and reposting information, and is that changing? Volume analysis is most typically associated with conversational trends—the relative levels of positive versus negative over time, the number of conversations over time, or the sudden spiking of an adverse rumor.
Source and Sentiment Analysis
In Chapter 2, “The Social Customer,” you saw the Autodesk and Barclaycard Ring cases, where the ideas that led to the innovations represented in these cases were presented right alongside the measurements—customer retention, life cycle via CRM, and similar, for example—that were used to validate these efforts. You also read about BuzzStream, an example of the tools that provide insight into the sources of influence within an area of interest. This is useful so that you can create relationships with the people talking about you. Your active listening program takes this one step further by connecting these sources with the actual business impact of the conversations in which they are a part.
Knowing who is talking is an important part of understanding the meaning of what is being said and then applying this in a useful manner within your business or organization. Combining the sources of the conversation—especially when the sources are actual (or potential) customers—with your listening data provides insights into how you can evolve your product, how you can reshape the customer experience, and where you and your competitors have points of relative vulnerability. As you consider specific listening tools and listening programs, consider how the data provided facilitates connecting the source of the conversation, along with the actual conversation and what it means, to your business processes that are driving the conversations in the first place.
One aspect of listening—known as sentiment analysis—deserves specific mention. Sentiment analysis is one of the meaning-related processes by which conversations are categorized. It’s also one of the most talked about and one of the most troublesome. Without belaboring the point, human communication is complex. Anecdotal examples of the issues around sentiment analysis can be summed up in two words: “Dyson sucks!” Odds are, this a positive comment—perhaps an expression of joy by a new customer first using these amazing vacuum cleaners.
Sentiment analysis, important enough in its own right, is not an end in and of itself, though many would love it if it were. How great it would be if instead of actively listening all you needed to do was read a report and respond to eight negative posts or send thank-you notes to a dozen loyal fans. Unfortunately, there’s more to it—a lot more.
Like the tip of an iceberg, sentiment analysis—and more specifically tracking and trending sentiment—gives an indication of what is happening below the surface. Unlike the tip of an iceberg—which is a good indicator that there is more ice underneath the surface—in the case of sentiment analysis you generally have to go back to the original posts, to the original context of the conversations, to sort out what is really happening: You may find more ice, or you may find rocks. A strong negative comment may originate from a dedicated fan or a dedicated detractor. You must dig in and understand the differences rather than skim the surface with a sentiment score.
The challenge with automated sentiment—and one of three primary motivators for the consideration of workflow tools as a part of your listening program (the other two being data conditioning and noise elimination, along with scalable and trackable routing and follow-up) is that meaning is almost entirely context driven. One of the shortcomings of the automated listening tools is that they tend to consider the post—in which keywords of interest are embedded—in isolation. In other words, they see the immediate conversation but not the back-story.
Consider Twitter: Because of its highly fluid and distributed nature, the short posts that define Twitter are actually interlinked conversations. One person says, “I bought a new Dyson—I love it,” and another, seeing that post, replies, “Me too. My Dyson really sucks!” as a humorous affirmation of the product, resulting in the “negative” post referenced earlier. Because replies are not always linked (in the technical sense) to their originating posts, a typical listening tool sees “Dyson sucks” in isolation, applies its rule base accordingly, and flags the post as negative. With the launch of the new Dyson bladeless fans and commercial hand dryers, a whole new round of sentiment issues arises for Dyson as posts like “Dyson really blows!” will start circulating. Make sure your listening tool is up to the task so that you always know what your customers really mean.
More seriously, none of this is a knock on sentiment analysis as an idea, nor is it intended as commentary on listening tools that include sentiment analysis in particular. The fact is that using the current tools—with all their attendant shortcomings—still provides more value than not using them. The challenge—and your responsibility—is to ensure that you are, at some level, tying the conversations you discover back to their original context so that you can actually deduce the intended meaning. This is also important from the perspective of workflow (prioritization and routing) and the elimination of noise—those results that while they match your keywords are not related to your actual search. Referencing the Dyson products example, conversations mentioning Esther Dyson are likely not relevant to the concerns of the Dyson product marketing team. The effort required to winnow the results to those that are relevant to your specific interests must be considered as an integral part of any listening program.
Here’s a twist on sentiment analysis: You can, if you’re savvy, get your fans to do at least some of the work for you. Jake McKee, while at LEGO, often turned to key people within the communities he worked with for insights into brand sentiment. Fans would often let Jake know—via IM, where Jake maintained an active, open presence with fans—that there was something or other that he needed to pay attention to, adding within their posts whether this was a good thing needing more attention or otherwise. This is one more reason—as if you needed one more—to actively build a base of loyal and alert supporters.
Know Your Influencers
There’s a particular kind of qualitative analysis that deserves to be examined in more detail because of its important role in SCE. It’s called influencer analysis.
Parallel to traditional PR and the associated marketing and advertising concepts relating to influentials, there are metrics related to the social graph—the connective links, profiles, and updates connecting people on the Social Web—that define the sources of the conversations you are tracking with your social analytics tools. Just as with measuring any other communications channel, understanding how a particular source (typically an individual) fits into your overall intelligence and outreach program is essential to getting the most out of it.
From Journalists to Enthusiasts
In traditional PR in particular, there is an established practice of identifying and developing relationships with key journalists and industry experts. These media connections are useful, for example, when rolling out a new product. By communicating in advance with these contacts, you can seed the general market awareness with comments from these individuals as they begin writing about your product launch. Sometimes this is done confidentially—for example, you may embargo a press release when you want your closest contacts to have this information and be aware of what is coming but not actually talk about it before a certain date. Or, you may want these advance recipients to talk about it first, conveying to them a certain scoop value. As a tip, include in your press releases a 140-character statement intended for reuse on Twitter, what Brian Solis calls a Twitter pitch.
However you do it, the basic process involves identifying and building relationships with the journalists and experts who write about your product or service or focus on issues relating to your markets. The same process applies on the Social Web, with one big difference: The people you want to reach and build a relationship with quite often don’t wear nametags.
For any specific interest, cause, lifestyle, product, or service, there are people who blog about it, who post about it on Twitter, and who convey this information to those who follow or subscribe to the blogs of these people. This includes the wider public audience that extends beyond media professionals and specific analysts and influencers.
The challenge, of course, is picking out the influencers who are of interest to you by using tools like Buzzstream and Sysomos, now part of Marketwire, along with Vocus and Cision, and then measuring your progress in building a relationship with them. Table 6-2 shows a selected set of core metrics related to influencer relations and relationship development.
Table 6-2: Examples of core influencer analytics
| Measurement | Typical Tools and Services | What It Shows |
| Social Influence | BuzzStream, Sysomos MAP, Klout, and similar tools | Provides insight into profile connections revealed by examination of social graph |
| Reach | Facebook (fan count), Twitter Grader, Klout, and similar tools | Provides an indication of connectedness within a community relating to an individual profile or page |
| Frequency of Posts | Alterian SM2, Radian6, BuzzStream, Sysomos Heartbeat, and similar tools | Provides an indication of how active a particular person or source is |
Metrics like social influence are returned directly through tools like BuzzStream. Figure 6-3 shows the BuzzStream dashboard and the social influence ranking that is applied. Tracking this type of metric over time, as well as across influencers, allows you to develop a profile of the people likely to be helpful to you as you go about the task of quantifying what is being said and affixing a numerical score to the likely impact of who is saying it. This helps you in two ways: You can build relationships with your influencers, and you can better understand the larger social graph that is connecting participants in the conversations around your brand, product, or service.
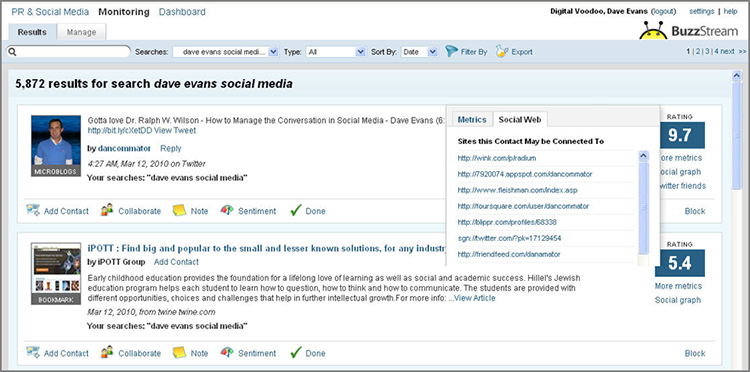
Figure 6-3: Influencer identification
Identify Your Influencers
Understanding your influencers requires more than simple tracking: You need to know who specifically is influencing others in your markets. By identifying them and then building an actual relationship with them, you can get into the subtleties of what drives the commentary they produce. This is an important insight, but it raises a question: How do you go about building these relationships?
Simply, you meet these influencers. As you discover influencers, you can connect with them. You can dig into their conversations and understand in detail what they like about your brand, product, or service and what they don’t. Based on that, you can build a stronger relationship and understand why key influencers post what they post.
The first step in identifying influencers is to sort out who is connected to whom, who is influential, and who is not. It’s not a fully automated process, so your gut instinct and skill will pay off as you sort through the quantitative information that is available and then combine that with your own industry knowledge, for example. Take advantage, too, of personal relationships that you may be able to build: If a conversation in a particular community is of interest to you, introduce yourself (in the real-world sense, for example, through email or Twitter) to the webmaster or community manager in charge. Share your point of interest, and see if this person or team will help you understand the other influencers within that community. More information is better, and if nothing else you’ll build a nice connection with a community manager that may pay off later.
Look back at Figure 6-3, which shows a typical view of influencers through BuzzStream. BuzzStream gathers influencer information by crawling the social graphs of the people identified as the sources of specific conversations. What is presented to you is a summary of all of the possible publishing points associated with this person. You can then quickly scan these publishing sites for the people you are particularly interested in and refine the list. Drop the information you’ve gathered into a contact database, and you’re ready to begin building an actual relationship.
The Role of Trust
Creating a trusted relationship is clearly important: Figure 6-4 shows the relative degree of trust across various sources of consumer information compiled by survey. It’s worth noting that the gap, while it exists, between survey participants according to age is not especially large; trust and its origins are a relative constant in business transactions. More interesting is that in general the sources associated with higher trust tended to be written by others for consumption in a social (think “two way”) context, while the least trusted were largely advertisements (think “one way”). Trust is built with influencers through participation; your participation in social channels is therefore a key to building strong influencer relations.

Figure 6-4: Relative trust in sources of information
Trust manifests itself in a related concept: social capital. Social capital, briefly, is to social media and the reputation of your brand (and you!) what economic capital is to your CFO and your organization. Social capital plays a role in influencer relations: By understanding who your likely influencers are, and by then taking a genuine interest in understanding their points of view, not only do you learn more about how your brand, product, or service is perceived in the marketplace, but you also create the opportunity to gain social capital.
Here’s an example: An influencer contacts you about a speaking date, but you are busy. You can rearrange your schedule, you can simply and politely decline, or you can refer a qualified professional you happen to know, however who is employed by competitor. If you can rearrange your schedule, that’s great. If you can’t, the best social option is to refer someone else who is qualified, because it is this act versus the simple declination that actually helps the person seeking your assistance. It’s like the old retail cliché: “Do you have this shirt in blue?” A response like “We don’t, but I know where you can get it” is the one that is remembered and appreciated. Building social capital works the same way, and it most definitely applies to building strong influencer relations.
Apply Your New Influencer Knowledge
Once you understand the people in the marketplace or stakeholders who matter to your firm or organization, you’ll want to do something with this information. Much of what can be done with influencer knowledge involves the use of the social graph and the tools that help you understand it in the context of your business objectives. You can combine this with information that highlights the interconnections between people to create an assessment of how influence actually flows. This can be tracked over time and tied back to your social-media-based marketing efforts; in other words, you can measure the impact of your influencers program.
Influence ranking further allows you to prioritize your tactical efforts. The cost of undertaking a program can be measured in terms of other opportunities foregone. The same applies to building relationships—with one caveat. When using influencer scores to prioritize your efforts, it’s important to use more than the numerical influence score. While it’s good to have highly influential people in your contacts database, it’s also important to recognize that influence doesn’t necessarily flow from the most influential directly to your prospects or others whom you have an interest in reaching. Instead, a significant amount of influence actually flows along what are called weak ties.
Weak ties are the casual bonds that exist across members of a community. Think of weak ties as “knowing someone who knows someone who….” For example, in a typical LinkedIn network there are people you know directly and people who are connected to the people you know directly. These weaker bonds are extremely important in helping information pass through a network, ultimately reaching the people who are considering some aspect of your offer.
By taking care to understand not only who your influencers are but also how they are connected to smaller—but collectively important—customer segments within your market to which you may not have a direct connection, you can significantly increase the likelihood that the conversations you participate in will ultimately reach more people. This information is especially useful in tuning an outreach program: Whether the goal is spreading your message further—think blogger outreach efforts—or building up your customer-driven intelligence program, knowing who is talking about the issues that matter to you and how these people are connected to others is vital.
Web Analytics
Prior sections define the basic metrics of social analytics. But social analytics are themselves a subset of, and deeply intertwined with, web analytics in general. What’s more, connecting social analytics with web analytics is an important step in connecting social analytics to your business.
Website Performance
Web analytics are concerned largely with the performance of your website and related online applications. What is generally meant by performance is how well your website converts visitors into customers, people supportive of your cause into donors or enlisted volunteers, or some similar transition that carries them all the way through your purchase or acquisition funnel.
Web analytics offer a number of measurement points. Table 6-3 lists a representative set of the more popular metrics associated with the performance of a website in a business context: These metrics are available through common sources including Webtrends, Google analytics, Omniture, and similar measurement platforms. The key to getting the most out of your web analytics program is understanding the individual quantitative measures shown in Table 6-3 and then creating the qualitative story that links these to your business objectives. Far too many firms track the basics—bounce rate, time spent, page views—but fail to move beyond these basic counts and into the actual analysis: refining and extracting the insights that are essential in applying analytics to business.
Table 6-3: Web analytics
| Measurement | Details and Notes |
| Unique visitors/visits | Compare with membership (registered visitors) levels |
| Bounce rate | Indicates the degree to which your landing page pulls visitors into your site |
| Time spent, pages viewed | Indicates the degree of engagement when used in combination with other measures of activity |
| Referrer URL | Provides indication of which social channels are sending visitors to your site, and which channels are likely to be most effective for social customer care |
Beyond the Basics
What’s beyond the basics? Although simply counting and reporting is an important first step, understanding what is driving the measurements you collect is essential to running your social media program and connecting what you learn to your business. The application of web analytics to your business should provide insights into how your online assets—your website, blog, or community site, for example—are driving your business and contributing to the achievement of business objectives.
By connecting the measurements to business processes, and by understanding how the process results drive the measurements themselves, you can use the trends you observe to steer your business or organization in ways that ensure achieving your business objectives. The necessary requirement here—especially as teams that span functional areas of a business or organization are brought under the increasingly large umbrella of social customer experience—is a quantitatively based understanding of how processes translate into results. The measurements you observe are indicators of results but are not themselves business results. By taking the steps to connect the measures to the business objectives, you ensure that you are tying what you’ve observed or learned through listening, for example, to the processes that create the conversations in the first place. In this way your Social Web efforts—whether outreach, listening, participation, or other forms of engagement—become measurably tied to the ongoing operation of your business or organization.
Don’t Overcomplicate
Note here that going beyond the basics doesn’t necessarily mean moving to advanced or exotic measurements. It means combining core metrics in ways that provide deeper insights and show you how to tie actions and results to your business objectives. Again, the key is taking the time to understand how relatively simple measurements can be combined, trended, and reinterpreted to provide useful information in the form of an effective story.
It is important, especially in the early stages of your social customer experience, to measure aggressively. You may end up discontinuing the collection of some items, but you will surely discover the sources of data you need to make sense of newer Social Web–based consumer behaviors.
Consider as an example unique visitors—a simple metric defined as the number of unique people who visited your channel at least once during a specified time interval (generally, one month). Particularly for on-domain SCE channels, this is a master metric, one that you should know for any channel for which you are responsible.
Starting with unique visitors you can begin to build a mathematical model for how conversions work in your channel. For example, what percentage of people who register will contribute? What percentage will return for a second visit? How many will become active users or superfans? You’ll want to understand the basic relationships that exist between these metrics so that you can extrapolate the impact that each additional registration will have (on average) with every other metric in the system. If that sounds like a lot, consider that it all came from one metric! Social measurement, while based in numbers, is largely about extracting insights and creating a compelling story that connects your social technology efforts to your business objectives.
Beyond unique visitors, consider bounce rate, the relative measure of visitors who land on your site and then leave immediately, without looking at anything else. As you did with unique visitors, dig into bounce rate, slice it by source, slice it by date, trend it over time, and run correlation analysis against it. What’s driving it? Do adjacent trends in blog activity or conversations on Twitter correlate strongly with the trends in bounce rate that you observe? These are the questions you really want to answer because when you know what is driving your bounce rate (rather than simply knowing the number itself), you can develop a plan to manage it, whether to further reduce it or to understand that further reduction has only a diminishing economic payback.
Connect the Dots
Moving beyond the basics of data collection is the difference between “12,357 people visited last week, up from 8,264 the week before” and “qualified visitors to our site increased following the release of the latest podcast program.” Counting visitors is important, no doubt about it. So is studying the ways in which people traverse your site before they choose to make an actual purchase. Combined, these metrics prove the quantitative basis to help you spot qualified visitors earlier in the process and thereby implement steps in a timely manner that drives these conversions further. Connecting trends and changes in qualified traffic to specific Social Web–based programs enables an understanding of ROI: As a sort of lingua franca, ROI helps you make the case across your organization for meaningful spending on social business efforts.
To see how the data collected through a Social Web listening program is connected to the data collected in a web analytics program, it’s important to understand correlation and causation. Figure 6-5 shows a visualization of correlation. The data represented by Data Set 1 (solid squares) appears to be correlated—note how it falls along a common line. By comparison, the relationship in the data contained in Data Set 2 (depicted by the dots) is more scattered over the chart. Correlation is the study of sets of observations, with the end goal being the detection of a possible connection between the sets of data.
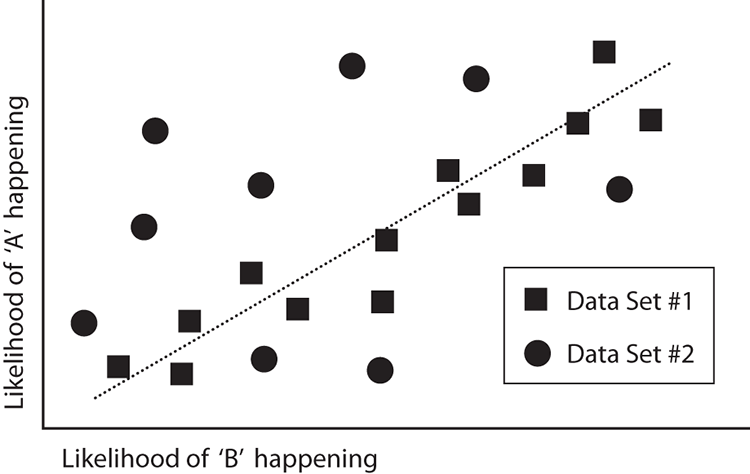
Figure 6-5: A visual chart of correlation
Correlation implies that whenever A is observed, B is also observed. An example of correlation is the observation that “People who bought dog food on the Petco website also bought dog leashes.” Purchasing one does not in itself cause the purchase of the other. However, the two tend to occur together more often than, say, people buying dog food and a bowling ball, something that may well be observed on occasion in the checkout line at a local Walmart.
Causation, by comparison, is a direct cause-effect relationship between A and B. When A happens, B results. Acquiring a dog, for example, fairly certainly causes the purchase of both dog food and a dog bowl. Cause and effect can be seen in things like the increased numbers of items in online shopping carts that result when online shoppers are prompted to consider additional items based on what they have currently placed in their shopping carts: When people are told “Others who bought dog bowls also bought dog leashes,” they tend to go look for a new leash.
The study of correlation can help connect social media analytics and other web and business analytics. Good news here: It’s easy to do. Collect your listening results, clean them to remove noise and irrelevant results, and then attempt to correlate the listening results, plotting, for example, volume and sentiment against with web traffic. If the patterns match—if the correlation is high—you’ve got an indication that some deeper connection may exist. This is not proof of such a connection! But it is an indication that looking further might be worthwhile. Consider how this technique might be used to uncover relationships that are not immediately obvious.
Try shifting the dates, too: Lag the website traffic by a day or two days or a week and see if the relative measure of correlation improves. If you have reason to believe that some action today has some impact two days from now, shift the impact measure by two days and then see if correlation improves. If you see an improved correlation, you may be seeing an indication that what happens on the Social Web takes a certain amount of time to propagate across the Social Web. That's useful.
The observation of a propagation time is certainly the case with brand advertising, for example, where a build-up time in awareness is observed. This is very different from, say, TV-based direct response or impulse buying (think QVC) where running a spot immediately triggers a known (or certainly knowable) buying response. It makes sense that these same conditions apply between the Social Web and your online purchase points or conversion funnels. It’s worth your time to sort out the relationships.
What about causation? If correlation is important, causation is the Holy Grail. When you nail down causation, you’ve got real power because the implication is that you can actually drive a particular outcome. The test for causation is tougher and more rigorous; systematic testing should be at the core of your analytics practices because of it. This is as applicable to your use of the Social Web as it is to your use of any other marketing technology that can be optimized. By testing and comparing, you’ll separate cause from correlation and identify the key activities and practices that will drive your business.
Take the time to examine the “usual suspects” in the context of web analytics—bounce rate, page views, time spent, and unique users—and connect these to your social media program by selectively changing elements of the social media program and noting the results. Building on what you learn, add your conversion results to the mix. Using Google Analytics, for example, set up conversion goals and then compare the results of your testing around your social programs with your conversions. The result will be a quantitative understanding of your business and the way in which your social programs support your overall business objectives.
Business Analytics
The application of social media to business is driven by the connection between the posting, sharing, and collaboration that happen on the Social Web and the underlying business objectives of the firm or organization. In the previous sections, the links between social media analytics and web analytics were examined, with the result being a systematic review process aimed at finding the relationships (correlation) that drive results and then extracting the key practices (causation) that you can replicate to grow your business.
Initially, these techniques may be limited to marketing and your use of the Social Web as a marketing platform, as is often the case with social media marketing programs designed to create additional outreach points or places where people within your organization can participate with customers on behalf of the brand. The next section—where the focus turns to business analytics—takes the techniques that are useful in marketing and applies them to the business as a whole. In particular, in the case of social media and the Social Web, there is a measurable connection to business, expressed through a result against a set of established business objectives. That level of understanding needs to be the end goal, and you need to be relentless about getting there.
It’s All about Results
When building a social business, the connection between the Social Web and your business objectives is your starting point. At a fundamental level, Operations drives the conversation more than Marketing. Therefore, the way in which the business is managed, what its end-output actually is, or the experience it creates becomes the focus. Compare this with business 10 or 20 years prior (not that long ago as macro trends are concerned) when the primary driver of success was how well the product or service was marketed.
Partly as a result, contemporary social customer experience and the software or technology that supports them are more likely to be paid for by the operations or information systems budgets than they are by the Marketing department. The Marketing department, by comparison, may pay for the programs associated with talking about the ways in which customers are benefiting from the implementation of a social business program or in building the outreach or listening platforms that drive them. Social technology is spreading out from marketing.
Why does this matter? Because when social business and software are seen as a business infrastructure investment rather than a marketing expense, it changes the ways in which the analytics are required to roll up. Social media analytics, web analytics, and influencer assessments must all be viewed in the context of their relationship to fundamental business analytics because they are the metrics that matter to the owners of the budgets and cost centers that are increasingly likely to pay for the costs of implementing a social customer experience program.
Because business analytics relates to the actual business operation, connecting business analytics to social and web analytics provides an end-to-end picture of the customer experience—manifesting itself as conversations on the Social Web—with the internal business processes that created the conversations.
Offline and Non-business Processes
For organizations that do not have an online commerce process—for example, for a cause that is collecting signatures—the thought process and the approach to business analytics are still largely the same. The commerce pipeline is simply replaced with the defined conversion process. Tools like Google Analytics offer well-developed conversion analysis support that you can use to refine your online programs in the same ways you would any commerce process. The objective remains pulling together the various sources of data that support measurement against your KPIs along with the process metrics around your established business goals, closing the feedback loop that the Social Web sets in place.
Sources of Business Analytics
When creating a social business program, start with the following analytic sources: commerce analytics—after all, at the end of the day we are generally in business to sell something—along with measures of acceptance or rejection.
Commerce and Pipeline Analytics
Commerce and pipeline analytics are an obvious starting point, because these measures help tie social media analytics and (where applicable) and web analytics to actual sales. The study of correlation and causation—identifying the underlying relationships between various measurements and the economic performance of the business—will yield a fundamental set of metrics that can be used to guide your business vis-à-vis social media analytics.
What about non-business applications of social technology or the task of assessing its use in organizations where the direct connections are less obvious? This is where the studies of correlation and causation, combined with your own domain expertise around the processes that drive your organization, are valuable. You can employ correlation, for example, to literally find or discover useful quantitative measurements and to then press deeper into the understanding of why these particular observations are correlated. Not only is this directly useful, you can often find new business fundamentals—especially as they relate to the emerging marketplace defined by the Social Web—that will help ensure that you achieve your business or organizational objectives.
Measures of Acceptance or Rejection
Acceptance and rejection measures—for example, defect reports or call abandonment rates—provide a second and equally rich measurement area. Defect reports highlight the issues that result in difficult or repeated service calls and are likely a root cause for negative conversations on the Social Web. Likewise, call satisfaction—knowing how happy your customers are with the support experience—is very powerful in identifying the root cause of sentiment as well as the specific aspects of a product or service that are likely to be talked about.
Applied Business Analytics
In the prior sections we discussed the sources and potential application of data; we covered social, web and business analytics. In the next two sections we’ll show how these concepts can be applied in ways that reach far beyond the ordinary aggregate trend and sentiment charts and into what really matters: business results.
Agent Productivity
One of the primary applications of social analytics as it relates to social customer experience is understanding how your social response team—your customer service agents more so than marketing professionals—is managing the inflow of customer requests in social channels. Working with a platform that provides deep analytics and workflow visibility it is well within your ability to measure and manage agent performance. Note that the following discussion and figures are based on the analytics available via Lithium Social Web, the workflow and engagement component of an overall social customer experience platform.
Figure 6-6 shows the number of posts handled by a customer service team during its first week, and then in the subsequent weeks following its initial launch of Lithium Social Web. As with the implementation of any new software or workflow process there is a training component that leads to agent mastery of the particular tool.

Figure 6-6: Agent performance following launch
The challenge facing the team is understanding how well training has been received and how effectively agents are performing against expectations. Across social channels gains in agent productivity are noted comparing the initial week with subsequent weeks, with a particular gain in Twitter-based customer inquiry productivity.
While gains in productivity are always good and successive gains in the early implementation of new tools is expected, the real business value that leads to ROI is in understanding how these gains were realized. This, by the way, is why understanding, prior to platform selection, the detailed metrics available in any specific social customer experience is so important: you can’t manage what you can’t measure!
To understand what’s really happening and to see how the significant gain in agent productivity was achieved you need to be able to see the details of the workflow, at both an agent and team level. One way to do this is to use a normal analysis, in which the actual agent results are compared with a standard normal distribution. In productivity analysis, a normal distribution is desired: In simple terms, it says all of your agents are doing about the same thing, plus or minus random process variation. This technique was pioneered by Edwards Deming and is well worth understanding.
Looking at Figure 6-7, the productivity data has been charted against a normal distribution. However, Figure 6-7 clearly shows that the smooth normal distribution—the bell-shaped curve enveloping the actual data—does not neatly fit the data itself. Instead, the data has two distinct peaks, indicating that the agent behaviors are different, with one group (A) operating at a lower efficiency that than the other (B). What would be great would be if you could understand why and then take corrective action based on that knowledge.
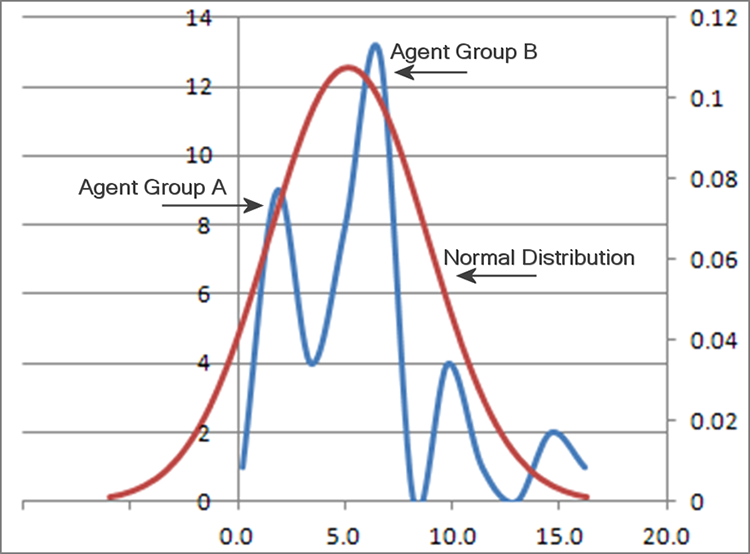
Figure 6-7: Agent performance vs. normal distribution
Robust analytics provide the ability to look into specific workflow behaviors. Turning to Figure 6-8, you can see that there is marked reduction in the number of agent-assigned posts—the queue length, as it is called within the Lithium data set—that are being held open by agents rather than closed following issue resolution when comparing the first weeks’ results versus later weeks. Being able to see this granular data alerted supervisors to the fact that one group of agents had misunderstood a critical point in training regarding case resolution and case closing: This was corrected through retraining during the first week, and as a result in the later weeks the queue length dropped to expected levels after which productivity improved.
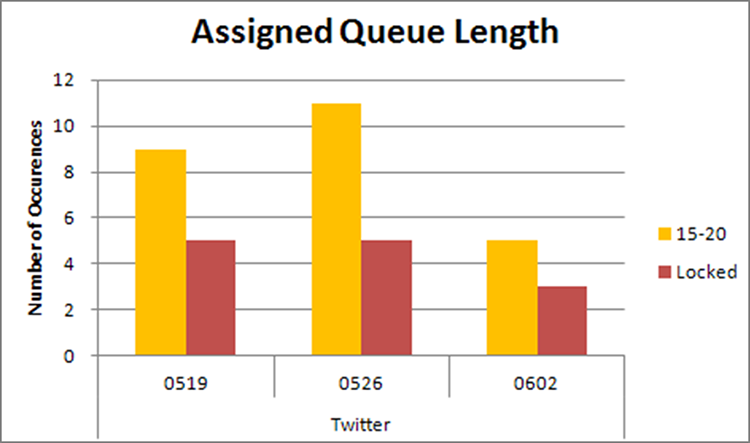
Figure 6-8: Agent workflow behavior
Turning back to Figure 6-6, following retraining the productivity across all agents improved in subsequent weeks, with agents now working at expected efficiency levels. Again, this is an example of the kind of immediate, data-based process management that is possible when the social customer experience platform you select provides the data you need to run your business. How you run your team is of course up to you: The take-away here is that you’ll want to ensure that the data available in the social customer experience platform you choose matches the data requirements for your business.
Customer Likelihood to Recommend
Beyond using social media for outreach or promotion—for example, in creating a brand outpost or using a channel like Twitter to convey sales information or collect customer comments—the Social Web can be used as part of a real-time feedback system that keeps your firm or organization on track. You do it; they talk about it. You do it a different way, and they talk about it in a different way. At the root of your interest is, or should be, one fundamental question: How likely is it that what is happening on the social web is helping your business?
As a starting point, consider the Net Promoter score (NPS). Created by Fred Reichheld at Bain Consulting, the Net Promoter score is straightforward, well documented (a benefit to you when presenting social technology and gaining internal support for its use), and easy to apply. Built around a 0–10 scale and the single question “How likely are you to recommend my brand, product, or service?” the Net Promoter Score nicely captures in a single metric what underlies the majority of the significant connections between the Social Web and your brand, product, or service.
How can the NPS methodology help you? Consider the application of NPS by Austin-based B2B technical and lab furniture manufacturer Formaspace. Implemented in earnest in 2009, NPS provided a whole-business marketplace view that was fully auditable. It was implemented at the C level and is now followed by every department at Formaspace.
Co-author Dave Evans spoke with Formaspace CEO Jeff Turk about the implementation of the Net Promoter Score. Jeff described the effort like this:
We don’t really look at NPS in terms of expecting a single great leap forward. We had a formal and frequently measured quality assurance and customer satisfaction system long before implementing NPS. We also know our most vocal customers quite well, so we had a very good idea what they would have to say about us before implementing NPS. We look at NPS as a source of continual incremental improvements.
The NPS system gives us a lot of small bits of feedback that incrementally add up to very high customer satisfaction. Some suggestions have included specific changes to furniture assembly instructions, asking for emails at certain times in the delivery process, and letting us know when we need to give kudos to a particular staff member.
Look back at the implementation and you’ll see that the company knew its customers and what they would say. NPS was used in the context of a larger measurement program. NPS was used to drive continuous improvement and thereby loyalty. The implementation of NPS at Formaspace exemplifies exactly the processes articulated in this book thus far, and it has paid off. Formaspace was originally acquired as a turnaround opportunity in 2006. Recovering and rebuilding customer loyalty was absolutely a key measure of whether its new owners were turning the company around. Based on prior customer satisfaction and loyalty surveys, Jeff and his team estimated that its NPS score would have been negative in 2006 and in the 30 to 50 range between 2007 and 2008. The measured score was 77 in 2009, and the company’s goal is to surpass 80 in 2010. That is impressive.
There’s a bigger insight here too: Paying attention, in detail, to customer conversations and measuring and tracking results doesn’t just boost measures like the Net Promoter Score; it actually drives business. Again, listen to Formaspace CEO Jeff Turk:
When we took over the company, it was doing so poorly at servicing customers that it sprouted competitors left and right. Today it would not be an exaggeration to say that Formaspace is the go-to resource for companies that use technical and laboratory furniture. We are rapidly becoming known as the “it” brand—so much so that our furniture is on the Discovery Channel, ABC’s Grey’s Anatomy, in NASA’s mission control center in Houston, and will soon be seen on the sets of more than one major motion picture. Many people import furniture from China: Ours is in sufficient demand that we send it the other way.
Because Dave is a former product manager, this last exchange really hit home. When he served in this role at Progressive Insurance Company, before the firm turned fully toward a customer orientation, it was planting the seeds for its early competitors. Nearly all of Progressive’s early competition came from former Progressive product managers and executives who simply copied the Progressive rate books and undercut the prices. Whether it’s extreme price sensitivity (technically referred to as high elasticity), such as was the case at Progressive, or poor quality or bad service, negative factors like these are invitations to more competition and lower margins. Formaspace engaged its customers, turned high quality to its advantage, and put itself—in brand-speak—on a different ladder. To learn more about Formaspace—and to see the great products they build—check out Formaspace.com.
As an important note, the Net Promoter score may not be for everyone (see sidebar), nor is it the only metric available to you (although if you had to choose only one, it would be a very good choice). Instead, the Net Promoter score is a great place to start if you don’t have a central dashboard or other in-place methodology for measuring success in creating an excellent social customer experience because it provides an understandable basis for linking the experiences you create in the marketplace with your organization as a whole, where these experiences are (largely) created.
The Net Promoter score—or your preferred equivalent—provides a quantitative assessment through which you can capture and track the degree to which your customers will recommend you to others in the market for your product or service. In a marketing environment that is increasingly driven by trust in “others like me” and by the recommendations of people “nearby” in the sense of the social graph, adopting the Net Promoter score and supporting methodology can help in the following ways:
- It creates a consistent, trackable metric that can be presented and placed into context across an organization.
- It is naturally aligned with the conversational dynamics on the Social Web. If most people would highly recommend your brand, product, or service, then the conversations about your brand, product, or service will reflect that.
- It is quantitative. The Net Promoter score “translates” unstructured data like the characterization of the recommendations that people might give on your behalf into a number. You can work with numbers.
Having a consistent metric that can be shared across an organization is vital: It enables everyone in your firm to “speak the same language” when it comes to assessing performance. Recall the Formaspace case: The context of a single metric like NPS is as important as the metric itself, and the verbatim responses (that is, individually detailed conversations with clients) that are often gathered as part of an NPS implementation are extremely valuable as well.
The net of the measurement discussion is this: Given that you already have a solid understanding of your business and your business objectives, begin an aggressive measurement program that ties social media analytics to your business. The eye candy—the sentiment charts, trend lines, and radar plots—are all cool. But the connection to business is what matters: Connect web analytics with business analytics to get more out of your social media measurements and more out of your social media and social customer experience programs.
Review and Hands-On
This chapter covered the fundamentals of measurement and then showed how to take the basic metrics that are readily available further. By moving beyond counts and trends and into correlation and causation and by aligning social media analytics with business metrics, you can move your use of the Social Web in business to a whole new level.
Review of the Main Points
The main points covered in this chapter are summarized in the points that follow. The essence of Chapter 6, with credit to Katie Paine, is “Yes We Can! (measure social media).”
- Understand quantitatively what is happening on the Social Web, on your website, and in your business.
- Tie these measures together to create a complete feedback loop that includes the delivery of what is learned to the functional areas within your business or organization that can act on and respond to this information.
- Use quantitative techniques such as correlation to find relationships in available metrics that you may not have considered and that once identified can lead you to new understanding of what the impact of social media and Web 2.0 really is.
- Move beyond basic metrics in all of your measurement areas, and press into a complete understanding how these metrics indicate where you are heading rather than simply where you have been.
By taking the time to connect the dots, to link together the fundamental sources of data that are available to you, you can significantly increase the likelihood of gaining acceptance and support for the organization-wide adoption of social business practices. This sets up the truly collaborative relationships between your business and customers, or between your organization and its constituents, that drive long-term success.
Hands-On: Review These Resources
Review each of the following, and consider subscribing to those that you find especially useful or relevant to your business or organization:
- Avinash Kaushik’s blog, Occam’s Razor
- Kate Niedehoffer
- Edwards Deming and Business Process Measurement
- Fred Reichheld and the Net Promoter community
Hands-On: Apply What You’ve Learned
Apply what you’ve learned in this chapter through the following exercises:
- Identify the primary social, web, and business analytics that matter to you.
- Run a correlation analysis on metrics you’ve identified, and then investigate why certain metrics are correlated more strongly than others and how this correlation might be used to further your understanding of how the Social Web is impacting your business or organization.
- Develop a basic dashboard, or incorporate one or two new business fundamentals that you identify through the previous exercises into your current business scorecard.