
8
DESIGNING A STRATEGY MAP AND BALANCED SCORECARD
EIGHT STEPS TO CREATE A STRATEGY MAP
The steps for implementing a strategy map and its associated balanced scorecard are like a recipe. The initial steps for building the strategy map are primarily performed by the executive team. After that, the managers and employee teams get involved to identify the projects and initiatives and core processes needing improvement, all of which are intended to achieve the strategic objectives and identify the key performance indicators (KPIs). The steps are as follows:
1. First, agree on the vision, mission and strategic intent of the enterprise. Define the strategy.
The initial step is to define the organisation’s vision and mission statements. These two statements are not the same, and their definitions must precede the construction of the strategy map and its associated scorecard and dashboards because they serve as signposts.
The vision statement answers the question ‘Where do we want to go?’ in terms that describe a highly desirable future state for the organisation. The statement should ideally be very brief, as the following examples demonstrate:
• Former U.S. President John F. Kennedy—‘We will put a man on the moon.’
• Microsoft Corporation (1990s)—‘A computer on every desk top.’
• Microsoft Corporation (21st century)—‘Information anywhere, anytime.’
• The SAS Institute—‘The Power to Know’
The mission statement provides to all employees the answer to the question, ‘Why are we here?’ in terms of desirable impacts to gain a competitive edge, such as
• to exceed customer needs well ahead of their realisation that they even have the need (eg, 24-hour automated teller machine).
• to leverage technology capabilities in fulfilling customer needs.
• to leverage employee capabilities for whatever we excel at.
Now the construction of the strategy map begins. Its initial purpose is to serve as a framework in the form of a network connecting strategic objectives, hence, the name strategy map.
2. Define the strategic objectives that support step 1.
Strategy maps (sometimes referred to as value driver trees) are used to communicate a unified view of the overarching strategy to the organisation. A strategy map defines corporate direction and aligns internal processes, strategic objectives, initiatives, KPI measures and target scores.
The balanced scorecard has received substantial attention, as if the scorecard was the answer, when, in fact, it is the strategy map that serves as a builder’s blueprint for the scorecard. The strategy map is like the special ingredient in this recipe because its straightforward logic becomes so compelling. However at this point, the themes that blossom into strategic objectives have yet to be organised or positioned among themselves. That comes in the step 3.
3. Map the interrelated strategic objectives with their cause and effect linkages.
The strategic objectives are interrelated. The four perspectives, originally proposed in Kaplan and Norton’s articles and books on the balanced scorecard, are very useful in simplifying what otherwise would be a difficult task. That task is to take all the strategic objectives (congealed from a workshop where the executives identify the strengths, weaknesses, opportunities and threats [SWOT] from the popular SWOT analysis and then cluster them into themes) and categorise each one into the perspectives it best fits.
The sequence of the four perspectives makes very good sense. The top perspective (ie, the financial perspective for commercial companies and the customer/ stakeholder view for the public sector company) is the beneficiary of the strategic objectives in the three perspectives beneath it. The bottom perspective, the learning and growth (or enabling assets) perspective, is the most foundational, not unlike the foundation for a house.
An effective way to understand a strategy map is to visualise an example of a hypothetical one. Figure 8-1 illustrates a strategy map of hypothetical XYZ Corporation, where each node in the network represents a strategic objective. The figure further adds if-then linkages where the paths drive, or at least contribute to, the outcome of the strategic objectives above them.
An interesting question routinely asked is, ‘Where is the organisation’s strategy defined and located on the strategy map? The simple answer is it does not appear. Why? The reason is that the connected network of strategic objectives is equivalent to the strategy. Strategic objectives are the actions that an organisation must complete—or at least progress toward—to achieve the organisation’s mission that, in turn, would realise its vision. The role of the strategy map is to show employees and managers what the organisation is looking for, rather than the executives questioning what they want the employees to do. In short, the strategic objectives, collectively, are the strategy.
Figure 8-1: XYZ Corporation Strategy Map

Source: Copyright Gary Cokins. Used with permission.
4. Define initiatives to close the performance gap for each strategic objective and scale back non-supportive projects.
Strategic objectives are oblique. You cannot go out there and ‘do’ an objective, but you can perform projects, programmes and actions or manage business processes that help accomplish the strategic objectives. In short, an effective performance management system demystifies the oblique strategic objectives by articulating how every action programme or business process—by teams and even individuals—contributes to the achievement of higher level enterprise strategic objectives and, subsequently, the vision and mission.
5. Select appropriate strategic measures and cascade them to relevant parts of the organisation.
A key in this step is to allow the different parts of the enterprise to define their own KPIs (tactical and operational measures), aimed at supporting the strategic KPIs and maintaining a shared focus on the strategy.
Up to this point, there have been no defined measures—specific or general. Now, they are defined. This is the most influential step for the success of the scorecard, yet is arguably the trickiest to perform.
Each strategic objective should be restricted to the KPI measures for the action programmes or business processes. A KPI should answer the question ‘What is an excellent quantitative measure that would communicate how well the strategic objective is being accomplished?’ by considering the action step or business process improvement aimed at the strategic objective. Do not confuse this step with choosing the specific target score for the KPI measure. That comes in step 7.
Figure 8-2 is the scorecard for the same hypothetical XYZ Company, whose strategy map can be viewed in Figure 8-1 in step 3. Note that strategic objectives are identical.
Figure 8-2: XYZ Corporation Balanced Scorecard

Source: Copyright Gary Cokins. Used with permission.
Although Figure 8-2 has all the columns completed, after completing step 5, we would only have the first column filled in. The remaining ones are described in steps 6, 7 and 8 that follow.
KPIs do not always need to be quantitative measures. Measurement data can come in all types. They can be text-based, as in yes or no for a discrete event, or they can be described as an estimated degree of completion (either as a % or even as basic as started, mid-way or complete). It is acceptable for scorecards to use subjective measures or measures scored with employee estimates rather than facts. These may be the most economical form of input data.
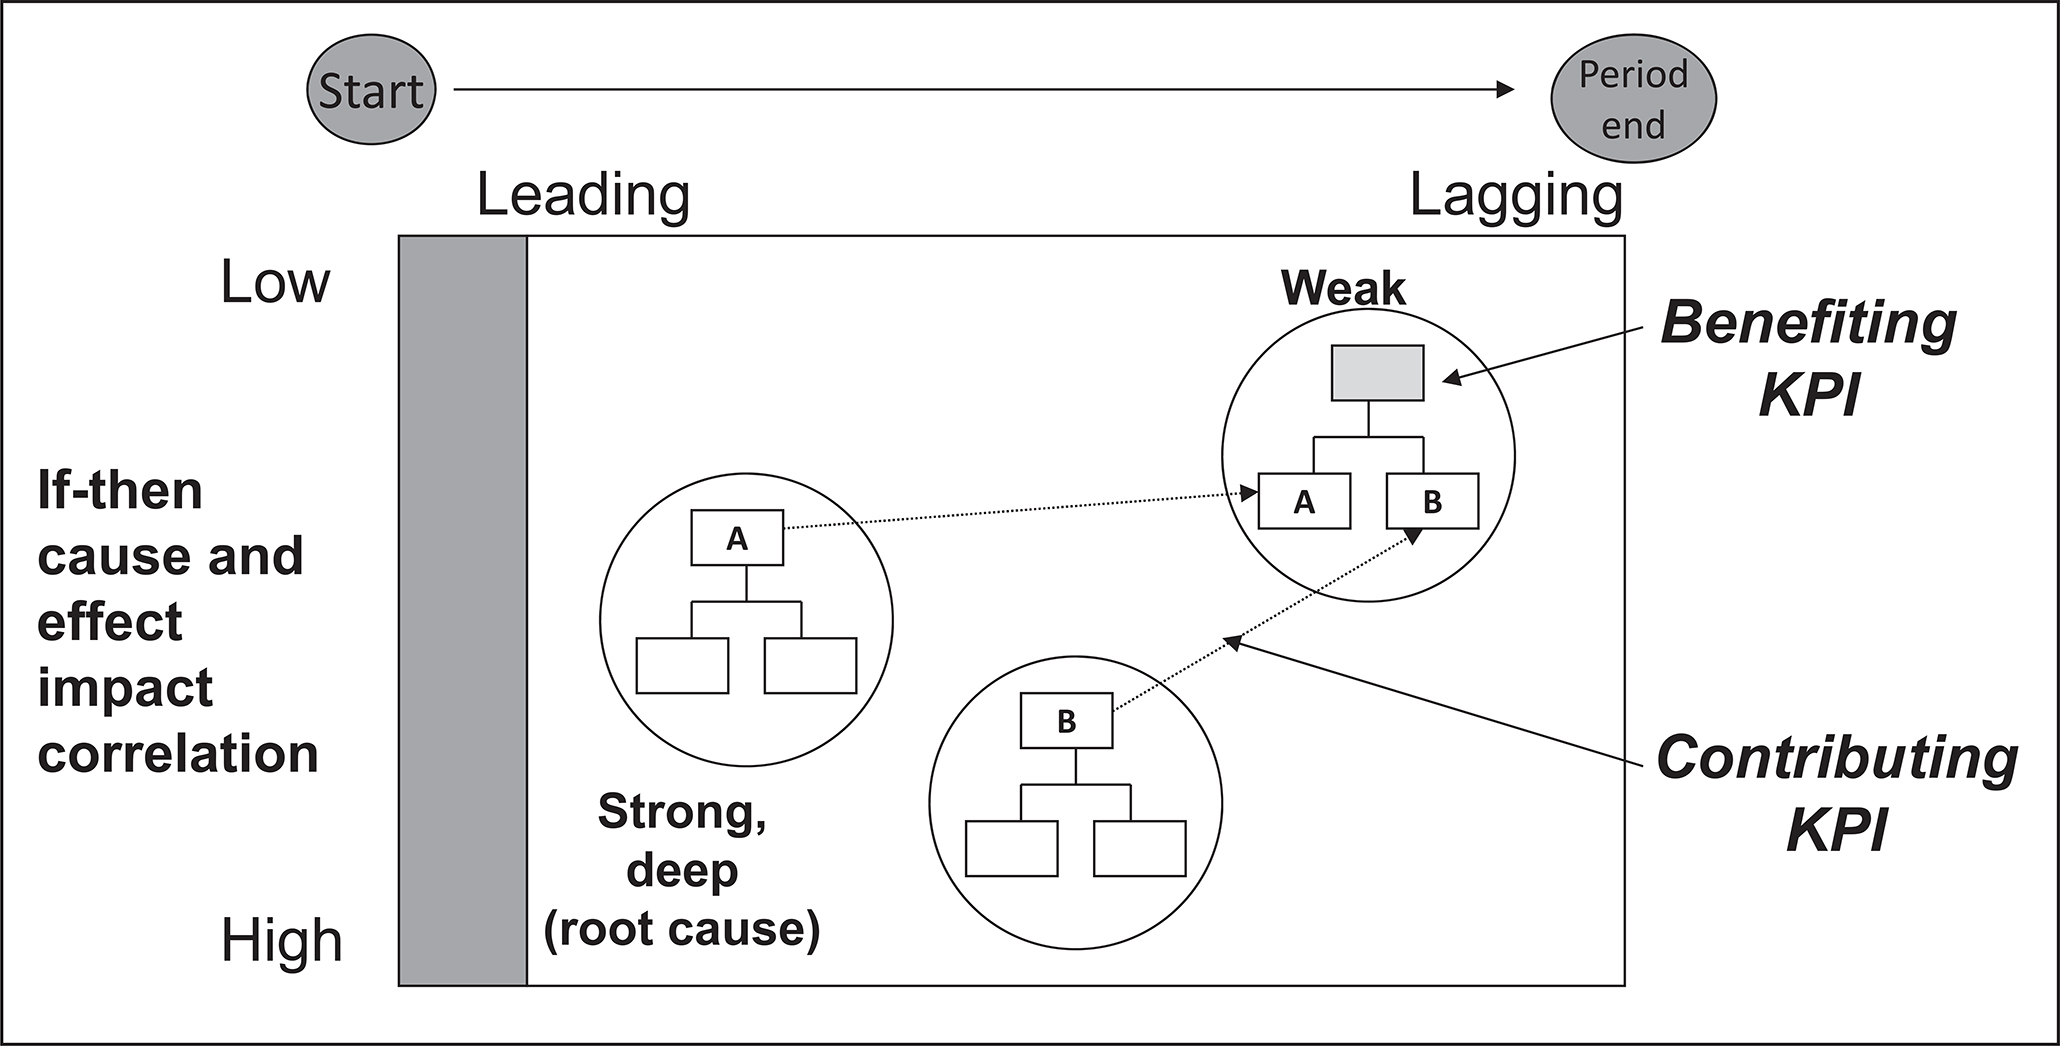
Figure 8-3 describes the differences between leading and lagging indicators. The simplest way to think of this is by asking and answering when is the actual score reported against the KPI, during the time period or at the end of the time period? (Of course, this begs the question for which time period, the past quarter, month, week, day or hour?) Figure 8-3 displays a two-dimensional view that is useful for understanding how leading and lagging KPIs relate to one another. The horizontal axis displays the time during the period, with the extreme right being the end. The vertical axis displays how deep a measure is and describes a root cause of the behaviour on the most upper-right measure, which I refer to as the benefiting KPI because this measure is a receiver of all the efforts of the actions reflected in the contributing KPIs.
Figure 8-3: Relating If-Then KPIs With Lead/Lag KPIs
A contributing KPI is a measure that is a deeper monitor of root causes. As the deep measures improve, their benefiting KPI eventually should too.
Source: Copyright Gary Cokins. Used with permission.
At this step in the enterprise performance management (EPM) process, the employee team will have selected the leading and lagging measures, configured among themselves and weighted in parallel to the levels of importance of the strategic objectives and corresponding action plans or business processes that they support. That is, with a properly cascaded scorecard hierarchy, strategic changes in strategy should result in new initiatives (or ones escalated in importance) and quickly be mirrored in the measurement system. At this point, and not before it, the scorecard as a mechanism is finally completed, but is not yet being used to measure and score actual data.
After this step, the correct KPI measures have been defined, weighted and related. The next step is inserting each KPI’s target score (and their meter ranges) into the scorecard.
6. Select the target levels for each KPI for relevant time periods. Identify the performance deficiency gap.
With this step, we finally get to the point in which a specific measurement level or amount or a text description is agreed on. A target measurement level or amount should pass the test of ‘if we were doing very well accomplishing the associated strategic objective, then this would be the level or amount of the specific measurement.’
7. Collect the actual KPIs, display the scores and compare to the targets.
This step is quite mechanical. Actual KPI measures are collected and inserted into the scorecard. The differences between the actual KPI score and its target KPI usually are calculated and displayed with a meter. Regardless of which side of the KPI meter the score differences lands, it is implicit that a favourable score positively contributes to accomplishing the strategic objectives that, when achieved, guides and excels the organisation toward realising its vision and mission.
Web-enabled scorecards, with traffic light colouring and alert messages as visual aids, add timely communications and discussion threads among managers and employees. That is, Web-enabled scorecards allow employees to actively write e-mails and record notes to investigate problems, focus on key needs and actively take corrective actions to improve their scores. These types of signals and alert messages that monitor real-time trends inform managers and employee teams that if something is likely to happen that will exceed a pain threshold, they will be notified before it happens.
8. Manage performance gaps to steer the organisation by interpreting and reacting to the score, then revising the actions plans.
If the strategy map and scorecard construction has been properly developed, what is now left is for good leadership to take over. At this point in the stage of maturity of using the scorecard, managers and employee teams are receiving continuous feedback on how they are performing. They also more clearly know what they are trying to attain—the strategic objectives that satisfy the vision and mission statements.
Unlike most internal e-mail messages, with scorecard feedback now Web-enabled for e-mail and discussion threads, the dialogues are intensely associated in the context of the strategy. A metaphor for a scorecard is like a crew team coxswain shouting to the crew. Here, the crew is having a dialogue among themselves, and the scorecard’s measures (KPIs) have been selected in the context of the strategy. This ensures behaviour alignment. Context is important. It elevates this methodology well above traditional management by objectives methods and spreadsheet performance reports.
SCORECARDS AND STRATEGY MAPS: THE ENABLER FOR EPM
In today’s environment, a business’s road is no longer long and straight. It is windy, with bends and hills that don’t allow much visibility or certainty about the future. Organisations must be agile and continuously transform their processes, cost structure and work activities. This is difficult to do when employees and managers do not understand their own strategies, the relevant performance measures, their cost structure and the economics of their environment. It is much easier for organisations to transform themselves when their performance measurement system links and communicates their strategies to the behaviour of their employees. Following are some reinforcing observations about scorecards:
• Scorecards help organisations move from being financially driven to mission-driven.
• If you fail to tie measures to strategy, you miss the chief benefit of the scorecard: alignment.
• The scorecard’s purpose is to translate strategy into measures that uniquely communicate the senior executive’s vision and mission to the organisation.
• Scorecard software systems, in which scorecards are routinely populated and published, promote e-mail dialogues for rapid messaging and note-taking documentation to prevent corporate amnesia that plagues organisations.
In short, failing to link measures to strategies will cause misalignment of the cost structure and priorities with the strategy. Because monitoring strategy attainment usually relies on output or results measures, lagging measures need to be translated into more process-operational leading measures reported during the period. Competing measures need to be minimised.
Unlike a trickle-down method of management, scorecarding is more of a trickle-up phenomenon. In order to produce good results, the expected performance measures should reflect solid, top-down planning, but the results—good or bad—will come from bottom-up performance. As an analogy, think of the organisation as a musical orchestra. You do not want to motivate all the musicians to play extremely loud. The balance comes from the correct decibels from each of the instruments.
If the measures selected are those that align employee behaviour to desired outcomes (eg, meeting strategic objectives), then the nearly-attained target measures will be met. Because the KPIs are derived from the strategy planning, the strategy itself is being achieved.
In summary, the need for reforms with organisational measures reflects the inability of senior management to communicate strategy changes and get their organisations to implement them in alignment with revised strategies.
EPM creates a shared vision that spans an organisation’s value chain upstream and downstream with its suppliers and customers. An enterprise can effectively manage its strategic objectives and performance measurements in a way that maximises value to all stakeholders and constituents, not just individual operating groups. By focusing on one version of the truth, a scorecard system can optimise organisational efficiency, support continuous quality improvement and maximise the value of human and capital assets.
Scorecards provide a comprehensive tool that can coordinate and propel large numbers of employees. In the end, if the organisation is performing well, then the rewards go to the employees, the investors, in the form of financial returns, or to the governing boards of not-for-profit organisations in the form of mission accomplishment.
Are strategy maps and scorecards going to be a management fad? Management consultants who have transitioned into these services repeatedly say this methodology has a higher retention rate than the improvement programmes they have consulted on in the past. Strategy maps and scorecards make sense, address a true need and will likely be a keeper for organisations that experiment by trying new ideas.