
11
PUT YOUR MONEY WHERE YOUR STRATEGY IS
Two easy ways for executive teams to attempt to raise profits is to lay off employees to cut costs or to lower prices to take away market share from their competitors. However these merely are short-term fixes. An organisation cannot endlessly reduce its costs and prices to achieve long-term sustained prosperity.
Entrepreneurs know the age-old adage ‘you need to spend money to make money.’ However, reigning in an organisation’s spending can be haphazard. Rather than evaluating where the company can cut costs, it is more prudent to ask where and how the organisation should spend money to increase long-term sustained value. This involves budgeting for future expenses, but the budgeting process has deficiencies.
A BUDGETING PROBLEM
Companies cannot succeed by standing still. If you are not continuously improving, then others will soon catch up. This is one reason why Professor Michael E. Porter, author of the seminal 1970 book on competitive edge strategies, Competitive Strategy: Techniques for Analyzing Industries and Competitors, asserted that an important strategic approach is continuous differentiation of products and services to enable premium pricing. However some organisations so firmly believed in their past successes that they went bankrupt because they had become risk-adverse to changing what they perceived to be effective strategies.
Strategy implementation is considered one of the major failures of executive teams. At a recent conference Dr David Norton, co-author with Professor Robert S. Kaplan of The Balanced Scorecard: Translating Strategy into Action referenced in Part 3, Chapter 7, ‘The Promise and Perils of the Balanced Scorecard,’ reported ‘Nine out of 10 organizations fail to successfully implement their strategy. ... The problem is not that organizations don’t manage their strategy well; it is they do not formally manage their strategy.’1 Empirical evidence confirms that companies poorly implement strategy. Involuntary replacement of North American CEOs in 2006 will beat the record high set just the previous year.2 In defence of executives, they often formulate good strategies—their problem is failure to implement them.
One of the obstacles preventing successful strategy achievement is the annual budgeting process. In the worst situations, the budgeting process is limited to a fiscal exercise administered by the accountants, who are typically disconnected from the executive team’s strategic intentions. A less difficult situation, but still not a solution, is one in which the accountants do consider the executive team’s strategic objectives, but the initiatives required to achieve the strategy are not adequately funded in the budget. Remember, you have to spend money to make money.
In addition, the budgeting process tends to be insensitive to changes in future volumes and mix of forecast products and services. As described in the prior chapter, the next year’s budgeted spending is typically incremented or decreased by a few percentage points for each cost centre from the prior year’s spending.
Components of the enterprise performance management (EPM) framework can be drawn on to resolve these limitations. In Figure 11-1, the large arrow at the right illustrates that the correct and valid amount of spending for capacity and consumed expenses should be derived from two broad workload streams that cause the need for spending—demand-driven and project-driven workload streams. Demand-driven expenses are operational and recur daily. In contrast, project-driven spending is non-recurring and can be from days to years in time duration.
Figure 11-1: Resource Requirements Are Derived

Source: Copyright Gary Cokins. Used with permission.
VALUE IS CREATED FROM PROJECTS AND INITIATIVES, NOT STRATEGIC OBJECTIVES
A popular solution for failed strategy implementation is the evolving methodology of a strategy map with its companion, the balanced scorecard. Their combined purpose is to link operations to strategy. By using these methodologies, alignment of employees’ work and priorities can be attained without any disruption from restructuring the organisational chart. The balanced scorecard directly connects the executive team’s strategy to individuals, regardless of their departments or matrix-management arrangements.
Although many organisations claim to use dashboards and scorecards, there is little consensus on how to design or apply these tools. At best, the balanced scorecard has achieved a brand status but without prescribed rules on how to construct or use it. For example, many companies claim to have a balanced scorecard, but it may have been developed in the absence of a strategy map from executives.
The strategy map arguably is many orders of magnitude more important than the balanced scorecard. Therefore, when organisations simply display their so-called scorecard of actual versus planned or targeted measurements on a dashboard, how do the users know that the key performance indicators (KPIs) displayed in the dials reflect the strategic intent of their executives? They may not. At a basic level, the balanced scorecard simply is a feedback mechanism to inform users how they are performing on pre-selected measures that are ideally causally linked. To improve, much more information than just reporting your score is needed.
One source of confusion in the strategy management process involves misunderstandings of the role of projects and initiatives. For the minority of companies that realise the importance of first developing their strategy map before jumping ahead to designing their balanced scorecards, there is another methodology challenge. Should organisations first select and set the targets for the scorecard KPIs, then subsequently determine the specific projects and initiatives that will help reach those targets? Or should the sequence be reversed? Should organisations first propose the projects and initiatives based on the strategy map’s various theme objectives, and then derive the KPIs with their target measures after?
We could debate the proper order. In Part 3 I argued that projects and initiatives should be defined from the strategy map. Putting this argument aside, what matters more is that the projects and initiatives are financially funded regardless of how they are identified. Figure 11-2 revisits Figure 7-2, described in Chapter 7, on implementing strategy maps and the balanced scorecard.
Figure 11-2: (1) Non-Recurring Expenses/Strategic Initiatives
Budgeting is typically disconnected from the strategy. This problem is solved if management funds the managers’ projects.

Source: Copyright Gary Cokins. Used with permission.
Regarding the second column of ‘x’ choices in Figure 11-2, what if the managers and employee teams that identified the projects are not granted spending approval by the executives for those initiatives? Assuming that KPIs with targets were established for those projects, these managers will poorly and unfavourably score. Worse yet, the strategic objectives the projects are intended to achieve will not be accomplished. By isolating this spending as strategy expenses, the organisation protects them—otherwise it is like destroying the seeds for future success and growth. Capital budgeting is a more mature practice and not as much of an issue as budgeting for strategic projects and initiatives.
Value creation does not directly come from defining mission, vision and strategy maps. It is the alignment of employees’ priorities, work, projects and initiatives with the executive team’s objectives that directly creates value. Strategy is implemented from the bottom to the top. Norton uses a fishing analogy to explain this: Strategy maps tell you where the fish are, but it is the projects, initiatives and core business processes that catch the fish.
DRIVER-BASED RESOURCE CAPACITY AND SPENDING PLANNING
For daily operations in which the normal, recurring work within business processes occurs, a future period’s amount of product and service line volume and mix will never be identical to the past. In future periods, some customer-demand quantities will rise, and others will decline, which means that unless the existing capacity and dedicated skills are adjusted, you will have too much unnecessary capacity and not enough necessary capacity. These are dual problems. The former results in unused capacity expenses, whereas the latter results in missed sales opportunities or customer-infuriating delays due to capacity shortages. Both drag down profits.
Figure 11-3 illustrates advances in applying activity-based costing management (ABC/M) to minimise this planning problem. ABC/M principles solve operational budgeting by leveraging historical consumption rates to be used for calculating future period levels of capacity and spending.
Figure 11-3: (2) Recurring Expenses/Future Volume and Mix

Source: Copyright Gary Cokins. Used with permission.
As an oversimplification, future spending is derived by calculating the ABC/M cost assignment network backwards. This was described in Part 4, Chapter 9, ‘Predictive Accounting and Budgeting With Marginal Expense Analysis,’ as closed loop activity-based planning and budgeting. The organisation starts by forecasting its activity-driver quantities (those were the actual driver quantities for past period costing). Then, it uses the calibrated activity driver unit level consumption rates from its historical costing to compute the amount of required work activities in the operational processes. Next, it equates these workloads into the number and types of employees and the needed non-labour-related spending.
This technique provides the correct, valid capacity and spending requirements. With this knowledge, management can intelligently intervene and approve adjustments by adding or removing capacity. It is a logical way of matching supply with demand. Once the capacity interventions (eg, employee headcount) and planned spending are approved, then a true and valid driver-based budget can be derived—not an incremental or decreased % change from last year—for each cost centre.
INCLUDING RISK MITIGATION WITH A RISK ASSESSMENT GRID
Measuring and managing risk possibilities identified in Part 3 is now transitioning from an intuitive art to more of a craft and science. Quantification with measures is needed; however, this area involves subjectivity and judgments. Therefore, each identified risk requires some form of ranking, such as by level of importance (high, medium and low). Because the importance of a risk event includes not just the impact but also the probability of occurrence, developing a risk assessment grid can be a superior method to quantify the risks and then collectively associate and rationalise all of them with a reasoned level of spending for risk mitigation. A risk map helps an organisation visualise all risks on a single page.
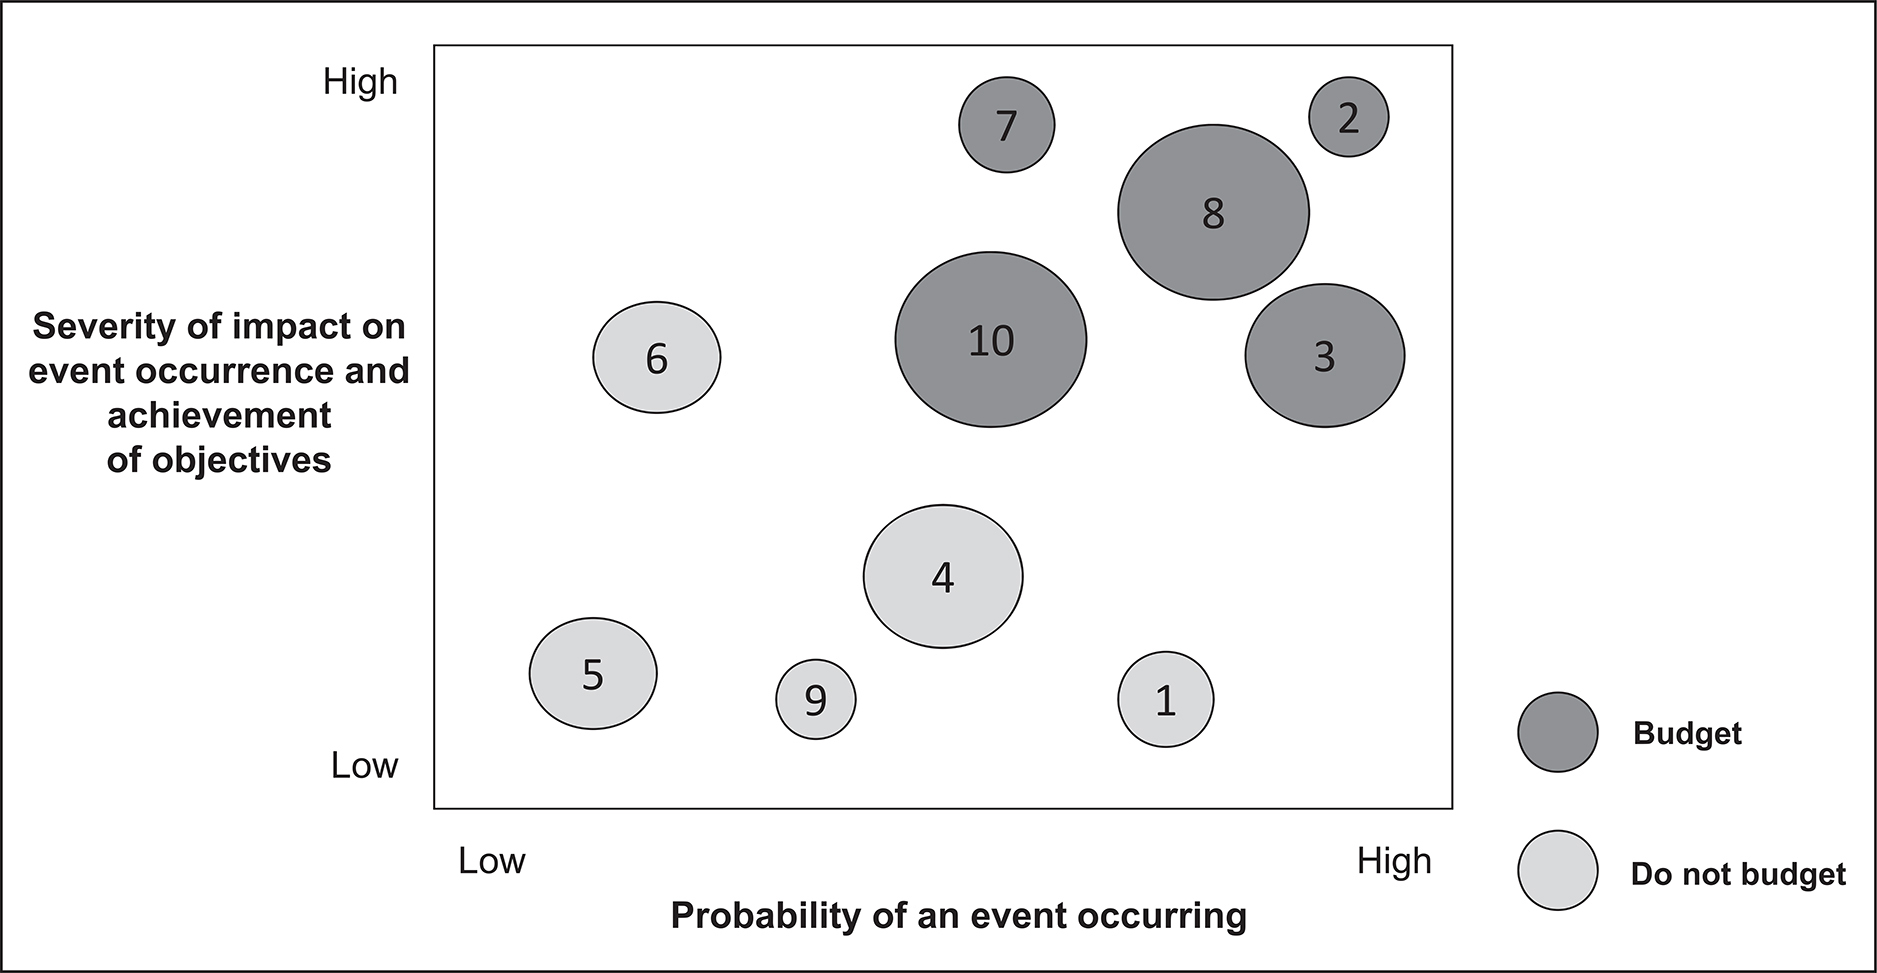
Figure 11-4 displays a risk assessment grid, with the vertical axis reflecting the magnitude of impact of the risk event occurring on the strategy implementation and the horizontal axis reflecting the probability of each risk event’s occurrence. Individual risk events located on the map are inherent risks and are not yet selected for mitigation actions. That evaluation comes next. The risks located in the lower left area require periodic glances to monitor if the risk is growing, nominal to no risk mitigation spending. At the other extreme, risk events in the upper right area deserve risk mitigation spending with frequent monitoring.
Figure 11-4: (3) Risk Assessment Grid
... ERM is not just contingency planning
Source: Copyright Gary Cokins. Used with permission.
The risks in the risk assessment grid are evaluated for mitigation action. This grid reveals that risk numbers 2, 3, 7, 8 and 10 are in a critical zone. Management must decide if it can accept these five risks, considering their potential impact and likelihood. If not, management might choose to avoid whatever is creating the risk, for example, entering a new market. Some mitigation action might be considered, which would drive the risks to a more acceptable level in terms of impact and likelihood. As examples, an action might result in transferring some of the risk through a joint venture, or it might involve incurring additional expense through hedging.
Management must decide on the cost versus the benefits of the mitigation actions. Will the mitigation action, if pursued, move a risk event within the pre-defined risk appetite guidelines? Is the residual risk remaining after mitigation action acceptable? If not, what additional action can be taken? How much will that additional action cost, and what will be the potential benefits in terms of reducing impact and likelihood? After these decisions are made, then, risk mitigation actions can be budgeted, similar to the projects and initiatives derived from the strategy map.
FOUR TYPES OF BUDGET SPENDING: OPERATIONAL, CAPITAL, STRATEGIC AND RISK
Figure 11-5 illustrates a broad framework that begins with strategy formulation in the upper left and ends with financial budgeting and rolling forecasts in the bottom right. The elements involving accounting are shaded in green. Some budgets and rolling financial forecasts may distinguish the capital budget spending (#2 in the figure) from operational budget spending (#1), but rarely do organisations segregate the important strategic budget spending (#3) and risk budget spending (#4).
Figure 11-5: Linking Strategy and Risk to the Budget

Source: Copyright Gary Cokins. Used with permission.
The main purpose of the figure is to illustrate that the budget depends on, and is derived from, two separate sources: a future demand-driven source (operational) and a project-based source (capital, strategic and risk mitigation).
The strategy creation in the upper left ideally uses meaningful managerial accounting information, such as understanding which products and customers are more or less profitable today and are potentially more valuable in the future. With this additional knowledge, the executives can determine which strategic objectives to focus on.
Note that the operational budget (#1)—those expenses required to continue with day-to-day repeatable processes—i s calculated based on forecasted volume and mix of drivers of processes, such as the sales forecast, multiplied by planned consumption rates that are calibrated from past time periods (and ideally, with rates reflecting planned productivity gains). This demand-driven method contrasts with the often too primitive budgeting method of simply increasing the prior year’s spending level by a few percentage points to allow for inflation. The operational budget spending level is a dependent variable based on demand, so it should be calculated that way.
Regardless of whether an organisation defines the strategic initiatives before or after setting the balanced scorecard’s KPI targets, it is important to set aside strategy spending (#3) not much differently than budgeting for capital expenditures (#2). Too often, the strategy funding is not cleanly segregated anywhere in the budget or rolling financial forecasts. It is typically buried in an accounting ledger expense account. As a result, when financial performance inevitably falls short of expectations, it is the strategy projects’ ‘seed money’ that gets deferred or eliminated. The priority must be reversed. Organisations must protect strategy spending and allow it to go forward because it is the key to competitive differentiation and successfully accomplishing the strategy.
The same goes for the risk mitigation expenses (#4). Enterprise risk management should be included in spending projections.
Note the question in the bottom right corner of Figure 11-5. Because the first pass at the ‘derived’ budget or rolling forecast will likely be unacceptably high and rejected by the executive team, the result is to adjust the plan. Hopefully, the project-based, strategy budget spending will be protected. As previously mentioned, organisations must protect strategy spending and allow it to go forward because it is a key to competitive differentiation and successfully accomplishing the strategy. This is similar to risk mitigation spending. Once the strategy and risk management spending are protected, the only other lever is to plan for productivity improvements in the consumption rates. This way, focused cost reductions (or future cost avoidance) become part of the EPM framework.
FROM A STATIC ANNUAL BUDGET TO ROLLING FINANCIAL FORECASTS
Most executive teams request frequent updates and revisions of the financial budget. These are referred to as rolling financial forecasts because the projection’s planning horizon is usually well beyond the fiscal year-end date. Imagine if you were a CFO or financial controller required to re-process the budget quarterly (or even monthly) as a rolling forecast. There are not enough spreadsheets to do it! Only with computer automation that integrates several of the methodologies of the EPM framework, including good predictive analytics, can an organisation produce valid, derived rolling financial forecasts.
MANAGING STRATEGY IS LEARNABLE
Organisations with a formal strategy implementation process dramatically outperform organisations without formal processes. Building a core competency in strategy implementation creates a competitive advantage for commercial organisations and increases value for constituents of public sector organisations. Managing strategy is learnable. It is important to include and protect planned spending for strategic projects and initiatives in budgets and rolling financial forecasts. Those projects lead to long-term sustainable value creation.
Endnotes
1 Dr David Norton, Balanced Scorecard Collaborative Summit, November 7, 2006: San Diego, California.
2 Jones, Del. ‘Turnover for CEOs is on record pace.’ USA Today. July 12, 2006, p. 2B.