 Adding reference lines
by Matt Floyd, Ashley Ohmann, Ashutosh Nandeshwar, Jen Stirrup
Tableau: Creating Interactive Data Visualizations
Adding reference lines
by Matt Floyd, Ashley Ohmann, Ashutosh Nandeshwar, Jen Stirrup
Tableau: Creating Interactive Data Visualizations
- Tableau: Creating Interactive Data Visualizations
- Table of Contents
- Tableau: Creating Interactive Data Visualizations
- Tableau: Creating Interactive Data Visualizations
- Credits
- Preface
- 1. Module 1
- 1. A Short Dash to Dashboarding!
- 2. Summarizing Your Data for Dashboards
- 3. Interacting with Data for Dashboards
- 4. Using Dashboards to Get Results
- 5. Putting the Dash into Dashboards
- 6. Making Dashboards Relevant
- 7. Visual Best Practices
- 2. Module 2
- 1. Connecting to Data Sources
- Introduction
- Connecting to text files
- Connecting to Excel files
- Connecting to Access databases
- Connecting to a SQL Server
- Pasting from a clipboard
- Connecting to other databases
- Connecting to Windows Azure Marketplace
- Understanding dimensions and measures
- Changing data types
- Applying filters
- Merging multiple data sources
- 2. Creating Univariate Charts
- 3. Creating Bivariate Charts
- 4. Creating Multivariate Charts
- 5. Creating Maps
- 6. Calculating User-defined Fields
- 7. Customizing and Saving
- 8. Exporting and Sharing
- 9. Exploring Advanced Features
- 1. Connecting to Data Sources
- 3. Module 3
- 1. Getting Started with Tableau Public
- 2. Tableau Public Interface Features
- 3. Connecting to Data
- 4. Visualization – Tips and Types
- 5. Calculations
- 6. Level of Detail and Table Calculations
- 7. Dashboard Design and Styling
- 8. Filters and Actions
- 9. Publishing Your Work
- A. Bibliography
- Index
Among many of Tableau's features, adding reference lines to graphs is one of them. By adding reference lines, we can compare data points with either any constant value or any statistical computation such as average of the measure values.
Let's use the sample file Sample – Coffee Chain (Access). Open a new worksheet and select Sample – Coffee Chain (Access) as the data source.
Once the data is loaded on the worksheet, perform the following steps to add various reference lines:
- Drag-and-drop Product Type from Dimensions into the Columns shelf.
- Drag-and-drop Profit from Measures into the Columns shelf.
- Drag-and-drop Market from Measures into the Rows shelf.
- Change the mark type to Shape.
- To compare Profit values for each Product Type and Market value with the average Profit value for all markets and product types, right-click on the Profit axis, select Add Reference Line, keep the Scope option value to Per Pane, accept all the default values, and hit OK. The graph should look like the one in the following screenshot:

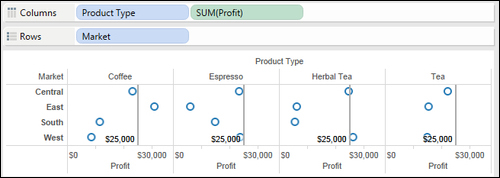
- To compare the Profit values to a fixed value, right-click on the Profit axis, select Edit Reference Line, keep the Scope value at Per Pane, under the Line selections, change the drop-down value to Constant from Average (as shown in the following screenshot), in the Value box enter
25,000, and hit OK:
- The chart with a constant reference line should look similar to the one shown in the following screenshot:
-
No Comment
..................Content has been hidden....................
You can't read the all page of ebook, please click here login for view all page.