 Viewing data
by Matt Floyd, Ashley Ohmann, Ashutosh Nandeshwar, Jen Stirrup
Tableau: Creating Interactive Data Visualizations
Viewing data
by Matt Floyd, Ashley Ohmann, Ashutosh Nandeshwar, Jen Stirrup
Tableau: Creating Interactive Data Visualizations
- Tableau: Creating Interactive Data Visualizations
- Table of Contents
- Tableau: Creating Interactive Data Visualizations
- Tableau: Creating Interactive Data Visualizations
- Credits
- Preface
- 1. Module 1
- 1. A Short Dash to Dashboarding!
- 2. Summarizing Your Data for Dashboards
- 3. Interacting with Data for Dashboards
- 4. Using Dashboards to Get Results
- 5. Putting the Dash into Dashboards
- 6. Making Dashboards Relevant
- 7. Visual Best Practices
- 2. Module 2
- 1. Connecting to Data Sources
- Introduction
- Connecting to text files
- Connecting to Excel files
- Connecting to Access databases
- Connecting to a SQL Server
- Pasting from a clipboard
- Connecting to other databases
- Connecting to Windows Azure Marketplace
- Understanding dimensions and measures
- Changing data types
- Applying filters
- Merging multiple data sources
- 2. Creating Univariate Charts
- 3. Creating Bivariate Charts
- 4. Creating Multivariate Charts
- 5. Creating Maps
- 6. Calculating User-defined Fields
- 7. Customizing and Saving
- 8. Exporting and Sharing
- 9. Exploring Advanced Features
- 1. Connecting to Data Sources
- 3. Module 3
- 1. Getting Started with Tableau Public
- 2. Tableau Public Interface Features
- 3. Connecting to Data
- 4. Visualization – Tips and Types
- 5. Calculations
- 6. Level of Detail and Table Calculations
- 7. Dashboard Design and Styling
- 8. Filters and Actions
- 9. Publishing Your Work
- A. Bibliography
- Index
Tableau, by default, aggregates the data and shows the aggregation on the visualization, but it is useful to see the underlying data that is used for that visualization. Using this feature, the user can view data behind the visualization.
Let's use the sample file Sample – Coffee Chain (Access). Open a new worksheet and select Sample – Coffee Chain (Access) as the data source.
Once the data is loaded on the worksheet, follow these steps to create a simple table, and then view the data populating that table.
- Drag-and-drop Product from Dimensions into the Rows shelf.
- Drag-and-drop Profit from Measures into the Text box under the Marks pane.
- Hit Ctrl + A on the keyboard to select all the data or the totaled Profit value for a single Product value.
- Right-click anywhere on the selected area in the data table, and click on View Data as shown in the following screenshot:

- You can see the summarized data as shown in the following screenshot:

- Click on the Underlying tab to see the complete and raw data supporting the summary view as shown in the following screenshot:
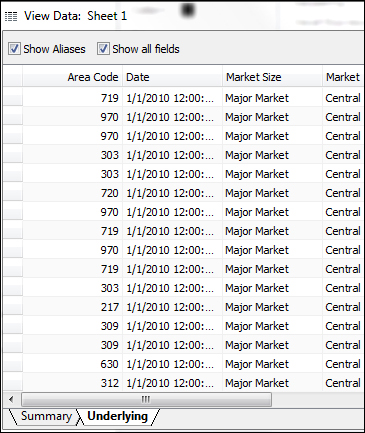
- To view fields shown on the worksheet, check the Show all fields option.
-
No Comment
..................Content has been hidden....................
You can't read the all page of ebook, please click here login for view all page.