
8 Logging and audit trails
- Logging management events to have a record of what happens in your AWS account
- Tracing resource configuration changes to identify when and for how long resources were misconfigured
- Centralizing application logs to track events across distributed applications
- Performing log analysis in CloudWatch to identify issues quickly
In the last chapter we talked about audit trails in the context of data integrity. Recall that we were able to use services like S3 access logging to verify whether data had been tampered with. In this chapter we’ll look more at the available logging and auditing options within AWS and explore the ways in which they can be used to improve the security of your cloud environment. Before we get to that, let’s talk about why audit trails are important.
Incident response is one of the biggest reasons for having audit logs. While the logs may not be immediately useful to you at the start, they’ll prove invaluable in the event of a security breach. Consider the attack on Uber in 2016. Attackers exfiltrated data on over fifty million users and then held it for ransom. They demanded $100,000 in exchange for deleting the data. What could you do in a similar situation, and what role would audit logs play?
One of the first things you’ll want to do is verify whether the attack actually happened. If you have good audit logging, you can look for signs of an attack. Anomalies in your logs are usually good indicators of an attack. Consider the following examples:
-
Do you see any large increases in the number of read accesses to your database or storage system? If someone were stealing fifty million records, you would almost certainly notice the extra calls.
-
Do you see excessively large response payloads? This could be an indicator of a SQL injection attack.
-
Do you have lots of requests from unusual geographic locations? If the majority of your customers are from one region, and you have big spikes in traffic from somewhere else, there’s a good chance it’s malicious.
-
Do you have lots of requests at unusual times? If your application is typically used between 9:00 a.m. and 5:00 p.m., then large data accesses at midnight are a bit suspicious.
Let’s say you’ve looked through your logs, and you see several signs that the attack did really happen (there are often many signs); what’s next? Can you identify the vulnerability that was exploited? One way is to do some reconnaissance using the malicious log entries you found. The logs generally indicate the source, whether it’s a user identifier or an IP address or something else. Take that, and search the logs throughout your stack for entries from the same source around the same time. Suppose in your database access logs you saw a large number of requests from a privileged user named Bob. You might search for Bob in your application logs and find tons of failed sign-in attempts for Bob’s account from a couple of IP addresses. Now, we know how the attackers gained access, and we can prevent it in the future by restricting login attempts or by using some other form of rate limiting.
We’ve identified that the attack happened, and we’ve fixed the issue, so it doesn’t happen again. What’s next? We should identify the extent of the attack. What kind of data was accessed, how many users were affected, and which specific users were affected? Earlier, you found that the issue was brute-forcing passwords, and you identified a handful of IP addresses that were making the sign-in attempts. We can search through the logs and find all of the users with failed sign-in attempts. These users are the ones that were likely compromised. Additionally, search through the logs for sign of attempts from the malicious IP addresses you’ve identified. Any successful sign-in attempts identify users who were almost certainly compromised. Once you know which users were affected and how, you can figure out what information was accessed. You may be able to tell from your application logs what data was accessed for each user. Or you may just assume that any information that could be accessed by a signed-in user was accessed. This is all critical information for your users to know. If an attacker stole the information of 1% of your users, but you don’t know which 1%, then you need to let all of your customers know that their data might have been compromised. It’s a lot better if you can tell the small group of affected users that their information was exposed and tell the other 99% that they were unaffected. The data that was accessed is important as well. There may even be legal implications, depending on what type of data was accessed and what mechanisms you implemented to safeguard that data. We’ll talk more about incident response and these kinds of notification requirements in chapter 10.
As you can see, logs and audit trails are extremely useful for incident response. They are the biggest tool you have for analyzing an attack after it happens. But incident response isn’t the only use for these logs; you can also use them to detect when an attack is in progress. In the previous example where attackers were brute-forcing passwords, you could potentially have discovered the attack when a large number of failed sign-in attempts occurred. If you were alerted to the attack early enough, you may have even been able to prevent any unauthorized access. Tools like GuardDuty, discussed further in chapter 9, do exactly this. GuardDuty processes your CloudTrail and VPC Flow Logs and alert you to potential attacks as they happen.
Logs and audit trails are also useful for many other reasons that aren’t related to security, like debugging an application or evaluating performance. In this chapter we’ll just focus on logging for the purposes of incident response and detection.
Now that we’ve seen why audit logging is important, in the rest of the chapter we’ll look at the different types of logs you should keep and the different ways you can implement them in AWS. We’ll start with logging management events using AWS CloudTrail. Then, we’ll look at recording resource configuration changes with AWS Config. Finally, we’ll cover centralizing any other logs you keep into one place for easy management and analysis, like in AWS CloudWatch Logs.
8.1 Recording management events
One source of information you want to log is resource management events. These are any calls to the AWS APIs or actions performed in the AWS console that manage any service resources. This information is very useful for going back and analyzing what happened after something goes wrong. If you find that resources are misconfigured, inadvertently deleted, or unintentionally created, you could use these logs to figure out exactly how that happened. This is also useful if you’re trying to determine whether an issue is the result of an attack or just an internal problem.
The primary way of logging this information is with CloudTrail, which is a service we’ve talked about many times throughout the book. When you create a trail in CloudTrail, all management events performed in your AWS account are logged to that trail for you. Figure 8.1 shows how management events from multiple users in the same AWS account, using different ways of interacting with AWS services, are logged to CloudTrail behind the scenes.

Figure 8.1 Management actions from all users, sources, and services in an AWS account are centralized in AWS CloudTrail.
Not every method in the AWS APIs or action in the AWS console is a management event, and thus, not all are logged in CloudTrail. For example, in DynamoDB, creating and deleting tables are management events. But reading and writing records to a DynamoDB table are data events and are not logged in CloudTrail. It’s possible to opt in to logging data events in CloudTrail for some services, like S3, but most services do not support logging data events in CloudTrail. See table 8.1 for samples of events that are and are not logged to CloudTrail. To find out exactly what events are logged to CloudTrail for a specific service, you can visit that service’s CloudTrail documentation page. For example, the events logged by S3 are documented at http://mng.bz/v6em.
Table 8.1 Sample of events and whether they are logged in CloudTrail
8.1.1 Setting up CloudTrail
Recall from chapter 7 that to keep an ongoing record of your CloudTrail events, you need to create a trail. You can use the automatic event history captured by CloudTrail, but it only goes back 90 days. The commands shown in the following listing, which use the AWS CLI, will create a new trail that records events from all regions and stores them in S3.
Listing 8.1 Creating a new CloudTrail trail and an S3 bucket to store the logs
$ aws s3api create-bucket --bucket my-cloudtrail-bucket     ①
$ aws cloudtrail create-trail --name MyTrail --s3-bucket-
➥ name my-cloudtrail-bucket                                ②
① Choose a unique name for your bucket.
② Creates a new trail, specifying a name and an S3 destination
Now that we’ve created our trail, it should show up when we describe the trails, as shown in the following listing.
Listing 8.2 Calling describe-trails to verify that our new trail was created
① Returns a list of all of your CloudTrail trails
The response we get from this call is a JSON object with our list of trails.
Listing 8.3 The output of a describe-trails call
{
    "trailList": [{
        "Name": "MyTrail",                        ①
        "S3BucketName": "my-cloudtrail-bucket",
        "IncludeGlobalServiceEvents": true,       ②
        "IsMultiRegionTrail": true,               ③
        "HomeRegion": "us-east-1",
        "TrailARN":
        ➥ "arn:aws:cloudtrail:us-east-1:123456789012:trail/MyTrail",
        "LogFileValidationEnabled": true,
        "HasCustomEventSelectors": false,
        "IsOrganizationTrail": false
    }]
}
① This matches the trail we just created.
② Indicates that this trail records global (nonregional) events, like those in IAM
③ Indicates that this trail records events from all regions, not just the home region
And we can use the LookupEvents method to check some of the events that have been logged to that trail already, as shown in the following listing.
Listing 8.4 Using the lookup-events method to search logs in CloudTrail
① lookup-events returns a paginated list of recent events recorded by CloudTrail.
This call returns the first page of events as a JSON object.
Listing 8.5 Sample output event from a CloudTrail lookup-events call
{
    "Events": [{
           "EventId": "298fc38a-456d-4645-a550-
            ➥ 427a535ce346",                    ①
           "EventName": "TerminateInstances",    ②
           "ReadOnly": "false",
           "AccessKeyId": "AKIAEXAMPLE",
           "EventTime": 1604090694.0,
           "EventSource": "ec2.amazonaws.com",   ②
           "Username": "Dylan",                  ②
           "Resources": [ ... ],
           "CloudTrailEvent": "{ ... }"
    }]
}
① Each CloudTrail event has a unique identifier called EventId.
② In this event, an IAM user named Dylan called TerminateInstances in the EC2 service.
The LookupEvents method allows for filtering the events by certain criteria. The following are the criteria you can filter by:
-
AWS access key—The access key supplied by the user who performed the event
-
Event name—The name of the event, which matches the name of the API method (e.g.,
CreateBucket) -
Event source—The service where the event was made (e.g., ec2.amazonaws.com)
-
Readonly—Indicates whether the event was a read-only operation, like listing resources
-
Resource name—The name or ID of the resource the event acted on
If you want to search for events that were performed by your IAM user, you can add that filter to your LookupEvents call, as shown in the following listing.
Listing 8.6 Filtering CloudTrail logs with lookup attributes
① This lookup attribute field is filtering for results where the Username is Dylan.
Again, we get the first page of events but, this time, only of the events for the specified IAM user.
Listing 8.7 Sample event records from a filtered lookup-events call
{
    "Events": [{
           "EventId": "298fc38a-456d-4645-a550-427a535ce346",
           "EventName": "TerminateInstances",
           "ReadOnly": "false",
           "AccessKeyId": "AKIAEXAMPLE",
           "EventTime": 1604090694.0,
           "EventSource": "ec2.amazonaws.com",
           "Username": "Dylan",                  ①
           "Resources": [ ... ],
           "CloudTrailEvent": "{ ... }"
    }]
}
① Only events performed by the specified IAM user are returned.
All of this can also be done through the AWS CloudTrail console. Figure 8.2 shows a screenshot of the CloudTrail console, where we do the same lookup operation for events performed by a specific IAM user.

Figure 8.2 The CloudTrail Console allows for searching events with various filters, like the username of the caller.
8.1.2 Investigating an issue with CloudTrail logs
Let’s see how we can use CloudTrail to examine management events in a real-world scenario. Imagine you are running an application, and that application costs you about $250 per month to host on AWS. Most of that cost comes from a few long-running EC2 instances. One day you check the billing console, and to your horror, you see the chart shown in figure 8.3.

The chart says that you’ve spent over $9,000 on EC2 this month. You quickly check the EC2 console, but everything seems fine. The only running instances are the ones for your application, and there’s nothing that should cost $9,000. How can you determine what happened? Unexpected charges in EC2 could be the result of accidentally spinning up extra instances or leaving instances running when you meant to shut them down. But it could also be the result of an attack. If an attacker gains access to privileged IAM credentials, one thing they might do is launch instances in your account that they can use for various purposes. It may be used as part of a botnet or to mine cryptocurrency. Once we figure out where the charges came from, can we determine whether this was a misconfiguration or an attack?
If we have $9,000 in charges from EC2, then EC2 resources must have been created that incurred those charges. Since creating new resources in EC2 is a management event (all EC2 API methods are management events), we can use CloudTrail to check what resources were created. We’ll use the ec2.amazonaws.com event source to narrow down the results to just events that came from EC2. After running the LookupEvents method in CloudTrail, we get back the events shown in table 8.2.
Table 8.2 Sample EC2 events logged in CloudTrail
From the CloudTrail events in table 8.2, we can see that something strange is going on. Our AWS account just has a couple of long-running instances. But the events are showing us that someone is launching and stopping several instances every day in the middle of the night. We can look at the full CloudTrail event object for one of these events, shown in listing 8.1, to get more information on what happened. The full event is part of the response for the LookupEvents method in the CLI. You can also see this in the console by clicking on the event name.
Listing 8.8 CloudTrail RunInstances event record (with some sections omitted for brevity)
   "eventVersion": "1.05",
   "userIdentity": {                                    ①
          "type": "AssumedRole",
          "principalId": "AROAEXAMPLE:Dylan",
          "arn": "arn:aws:sts::123456789012:assumed-role/Admin/Dylan",
          "accountId": "123456789012",
          "accessKeyId": "ASIAEXAMPLE"
   },
   "eventTime": "2020-11-16T10:33:45Z",
   "eventSource": "ec2.amazonaws.com",                  ②
   "eventName": "RunInstances",                         ②
   "awsRegion": "us-east-1",
   "sourceIPAddress": "192.168.0.1",
   "userAgent": "console.ec2.amazonaws.com",            ③
   "eventID": "8e688a17-3c5e-4292-a762-3134bebaf9a8",
   "eventType": "AwsApiCall",
   "requestParameters": {                               ④
          "instancesSet": {
              "items": [{
                      "imageId": "ami-0947d2ba12ee1ff75",
                      "minCount": 1,
                      "maxCount": 1,
                      "keyName": "Test"
                  }]
          },
       "instanceType": "p3.16xl",                       ⑤
   },
   "responseElements": {                                ⑥
          "instancesSet": {
              "items": [{
                      "instanceId": "i-a1b2c3",
                      "imageId": "ami-0947d2ba12ee1ff75",
                          "instanceType": "p3.16xl",
         }, ...]
      }
       }
}
① The userIdentity block contains information about the entity who performed the event.
② Event source and event name tell you what the event was—in this case, EC2 RunInstances.
③ The useragent can tell you how the event was performed, in this case, through the EC2 console.
④ The RequestParameters are all of the nonsensitive parameters that were passed in calling the event.
⑤ One of the parameters was specifying the instance type—in this case, a P3.16XL instance.
⑥ The response elements tell you what AWS returned from the event. In this case, EC2 launched a P3.16XL instance.
Notice the request parameters of the event details in listing 8.1. The request parameters show the parameters that were sent when the RunInstances API call was made. This tells us the instances that were launched were P3.16XL instance types. These are very expensive instances used for heavy machine learning or HPC workloads. That explains how we racked up several thousand dollars in EC2 charges in a month. So who was creating these instances? CloudTrail tells us that as well. The userIdentity block in the event shows the IAM entity that made the call. In this case, the event came from my IAM user. I know I didn’t launch these instances, so this is likely to be an attack, rather than a misconfiguration on my part. In this case, you should change the credentials for the affected IAM user and contact AWS support.
8.2 Tracking resource configuration changes
In the previous section we discussed AWS CloudTrail and how it gives you a timeline of the events that occurred in your AWS account. While this is useful for some types of analysis, sometimes it can be difficult with CloudTrail to identify when changes were made to a specific resource. For example, suppose you wanted to know when an S3 bucket was made publicly accessible (via the public-read ACL). To do this, you would need to search your CloudTrail logs for a PutBucketAcl event on that S3 bucket. Once you find that event, you need to check whether the request parameters show that it set the public-read ACL. However, that doesn’t necessarily mean that was when the bucket was first made public. At the time of the call, the S3 bucket may have already had the public-read ACL set. The CloudTrail event doesn’t tell you whether the event actually changed the bucket—only that the call was made. To find out when the public-read ACL was first set on the bucket, you need to find all PutBucketAcl events on that bucket as well as the initial CreateBucket call, as the bucket may have been initially created with public-read. Once you’ve found all those calls, you have to read them to find the first successful event that set the public-read ACL.
This exercise can be very tedious, especially when there’s a high volume of calls on a resource. Fortunately, there’s another AWS service that can help: AWS Config. This service tracks the configuration of all of your AWS resources over time and gives you a timeline of the changes. You can click any point and view the full configuration of your resource at that point in time. You can also click an event and see what changes were made. Let’s see how we can use AWS Config to find when a bucket was first given public-read access.
8.2.1 Pinpoint a change with a configuration timeline
The AWS Config console makes it very easy to track the changes of a resource over time. When AWS Config is enabled, the dashboard will show you an inventory of the resources it is tracking in your account. You can see an example of this in figure 8.4.

Figure 8.4 The AWS Config dashboard shows an inventory of all the resources it tracks in your account.
The screenshot shows the counts of the different resources that are being tracked in Config. Since we’re interested in an S3 bucket, we can click on the S3 bucket type to see a list of the S3 buckets and then select the one we want to view. Once we find the S3 bucket we’re interested in, we’ll see a page similar to figure 8.5.

Figure 8.5 The resource detail page of the AWS Config console shows the current resource configuration.
There are a couple useful pieces of information here. The first is the Details tab, which shows an overview of the current configuration of the resource. This typically shows important high-level resource metadata, like the resource name and ID as well as resource type–specific information. The next tab is View Configuration Item. This tab shows you the full configuration of the resource at this point in time. We can use this to see all of the different parameters of the bucket that are currently set. However, what we’re really interested in is how that configuration changed over time. For that, we’ll click the Resource Timeline link. The resource timeline will look like figure 8.6.
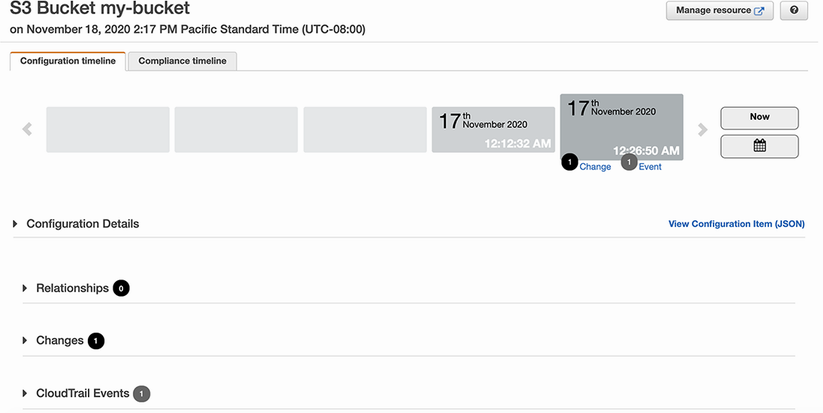
Figure 8.6 AWS Config can show you a timeline of all the configuration changes that have been made to a resource.
In this page we see a timeline of all the changes made to our S3 bucket. We can click any of the points in the timeline and get the same information we saw in figure 8.5 for that point in time; that is, the full resource configuration details. Additionally, we can also see the changes that were made at that point, which shows just the differences between this point in time and the previous configuration. Figure 8.7 highlights this configuration change view.

Figure 8.7 AWS Config can tell you the difference between the configurations of a resource at two different points in time.
In this screenshot we can see that the ACL was changed, and public-read access was added. Now, we know that this is the point at which the public-read ACL was first set on the bucket. Now that we’ve figured out what happened, we may still want to do some further analysis in CloudTrail. AWS Config makes it easy to jump directly to the CloudTrail event that made the change. In the configuration timeline for our bucket, when we click on a point in the timeline, there’s a tab to see all of the CloudTrail events associated with those resource configuration changes. You can see in figure 8.8 that it shows a high-level overview of the CloudTrail events, along with a link that takes you directly to that event in the CloudTrail console.

Figure 8.8 AWS Config links resource configuration changes to the CloudTrail events that show how the changes were made.
8.2.2 Setting up AWS Config
Before you can start tracking changes to your resources and viewing the change timelines, you first need to enable AWS Config to start recording resource changes. There are just three steps you need to follow:
-
Create an S3 bucket, where Config will store the resource configurations.
-
Create an IAM role that Config will use to access the S3 bucket you created, and read the configuration of all of your resources.
-
Turn on Config, using the IAM role and S3 bucket you created.
All of this could be done through the AWS Management Console, but we’ll use the AWS CLI here instead. To start, let’s create a new S3 bucket with a basic configuration, as shown in the following listing.
Listing 8.9 Creating an S3 bucket to use for AWS Config
Next, we’ll create the IAM role. This IAM role needs to have permissions to read the configuration of your resources as well as read and write access to the S3 bucket you just created. There’s a managed policy created by AWS we can use to accomplish the first part. Then, we’ll write a custom policy that grants access to the S3 bucket.
Listing 8.10 Creating a service-linked role for AWS Config
And now, finally, we can enable Config. This just takes a single call to the subscribe command, which takes in the IDs of the S3 bucket and IAM role we created, as shown in the following listing.
Listing 8.11 Enabling AWS Config with the subscribe command
$ aws configservice subscribe
--s3-bucket my-config-bucket
--iam-role arn:aws:iam::123456789012:role/AWSServiceRoleForConfig
--sns-topic my-config-topic
Now, we’re ready to start using Config. It may take several minutes before Config inventories your resources, but now, it will start tracking changes to your resources, and you can view the change timelines, as we did before.
8.2.3 Resource compliance information
You may have noticed in the AWS Config console that there are several references to compliance and compliance timelines. Another feature of Config is displaying a change timeline like before, except this time highlighting when a resource was in or out of compliance. You can define the rules for what it means for a resource to be in compliance with a feature called Config rules. We’ll look more at Config rules and how to write them in chapter 10, but for now we can see how this looks with a prewritten rule. This rule says that an S3 bucket is out of compliance if it is publicly readable. Whenever a change is made to one of the in-scope S3 buckets, Config will check whether the bucket is publicly readable and keep track of the compliance status. For us, this means we can view a handy timeline of our S3 bucket compliance status, as shown in figure 8.9. We can immediately see exactly when our S3 bucket was publicly readable, as it’s clearly marked in red in the timeline (look for the enlarged box in the print book).

Figure 8.9 With AWS Config rules, you can view a timeline of resource configuration changes that shows when resources were in or out of compliance.
8.3 Centralizing application logs
In the previous sections in this chapter, we’ve looked at services that automatically collect certain types of logging and audit information for you. In this section we’ll discuss a different kind of logging service, AWS CloudWatch Logs, which lets you record any other logs you want into a central place. Let’s see why this might be useful with an example.
Suppose that you run a web application that records all requests to an access log file. This application has a lot of spiky traffic, so you run it on several EC2 instances in an autoscaling group. How do you access the logs? There are two problems here. The first is that the logs are distributed across several hosts. If you want to get the log files, you need to grab the log files from every instance and then combine them. The second problem is that because the instances are in an autoscaling group, instances may be terminated at any time as part of the scale-down process. This means the log files will be lost. We can solve both of these problems by centralizing the logs in CloudWatch Logs. At any point you can check the logs in CloudWatch, even if the hosts that originally recorded the logs are no longer running. In the rest of this section, we’ll look at how to actually send your logs to CloudWatch and access them.
In addition to CloudWatch Logs, there are many third-party services and tools available for centralizing logs and events. Alternatives like Datadog, Prometheus, and Splunk are commonly used instead of CloudWatch for centralizing information. While we’ll focus specifically on CloudWatch, the principles of centralizing logs are the same for all the tools, and the features described in this section are fairly universal.
8.3.1 CloudWatch Logs basics
Logs can be uploaded to CloudWatch through the PutLogEvents API, though that is not how it is typically done. Most often, people opt for using the CloudWatch agent. This agent is configured to automatically send your logs to CloudWatch periodically. This way you can keep writing logs in the same way you always have and have them start showing up in CloudWatch. We’ll come back to setting up the CloudWatch agent in a bit, but right now we’ll start with an easy use case: AWS Lambda. Lambda comes with the CloudWatch Logs agent preconfigured, so your Lambda function can write to stdout, and it will show up in CloudWatch. This could be with print("hello world") in Python3, or System.out.println("hello world") in Java. We can create a simple Lambda function like this and see how the logs show up in CloudWatch. Figure 8.10 shows a Python3 Lambda function called TestLogs that prints hello world. We’ll run this a few times to populate some CloudWatch Logs.

Figure 8.10 A simple Python Lambda function that logs to CloudWatch. Lambda comes with the CloudWatch agent preinstalled, so print statements show up in CloudWatch.
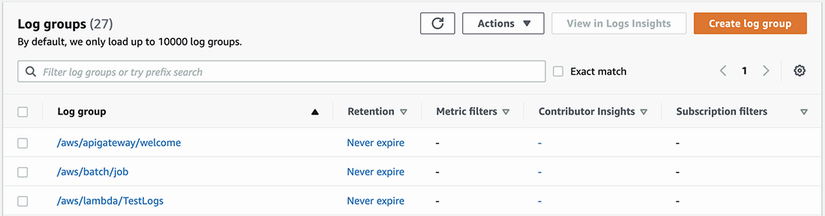
Figure 8.11 The main page of CloudWatch Logs shows the available log groups, which are collections of associated logs.
Now, let’s go to the CloudWatch Logs console where we can view these. The CloudWatch Logs console is shown in figure 8.11. Here we are shown a list of log groups. A log group is a named collection of logs. A Lambda function puts all of its logs under the same log group with the name /aws/lambda/function_name. If you’re recording access logs from an Apache server, you might create a log group named my_application/ apache/access_logs. Since we’re looking for the logs from our Lambda function, we’ll select the CloudWatch log group named /aws/lambda/TestLogs. After that we’ll see the page shown in figure 8.12.

Figure 8.12 The Log Group page of CloudWatch shows the log streams, which are logs that came from the same source.
Now, we see a list of log streams. A log stream contains log entries that came from the same source. For example, suppose you had a bunch of Apache servers that were all logging to the my_application/apace/access_logs log group. Each of those servers would upload to a separate log stream. You can choose to view the logs in a specific stream, or you can view all of the logs at once. Viewing the logs in a specific stream is convenient when you need to see multiple log entries in a row, like in a stack trace. If you view all of the logs in the log group at the same time, the stack trace might be broken up because other servers were logging at the same time. In our case we aren’t concerned about that, and we just want to see all of the logs from our Lambda function, so we’ll click the Search All button, which shows all of the logs for the log group. The result will look like figure 8.13.

We can see our hello world logs showing up. We also see additional log entries that begin with START, END, and REPORT, which are automatically logged by Lambda for each invocation of a Lambda function. Now that we know the basics of CloudWatch logging and how to view the logs, let’s try setting up the CloudWatch Logs agent for an application running on EC2.
8.3.2 The CloudWatch agent
Suppose now that we’re running an Apache web server on an Amazon Linux 2 (AL2) instance and that the server is recording access logs to /var/log/www/access on the instance. We can use the CloudWatch agent to automatically upload these logs to CloudWatch without having to change anything about our web server. The two things we need to do here are to install the agent and set up the agent configuration file. On an AL2 instance, we can install the agent with the yum package manager.
Listing 8.12 Installing the Amazon CloudWatch agent on an Amazon Linux 2 host
Once the agent is installed, you can use the included wizard to set up the configuration file. To start this, run the code shown in the following listing.
Listing 8.13 Running the Amazon CloudWatch agent configuration wizard
The wizard will ask you several questions for which you can use most of the default options. The important one is when it asks you for the log file path. For this, give the directory where the web server is already logging: /var/log/www/access. You can also specify additional paths if you have additional logs you want to collect in CloudWatch, like error logs. Now, we just have to tell the CloudWatch agent to use this new config file.
Listing 8.14 Configuring the CloudWatch agent to use the new config file
$ sudo /opt/aws/amazon-cloudwatch-agent/bin/amazon-cloudwatch-agent-ctl
   -a fetch-config
   -m ec2
   -c file:/opt/aws/amazon-cloudwatch-agent/bin/config.json
   -s
The last step is to start the CloudWatch agent, and to optionally make sure it starts at boot. This can be done with the commands shown in the following listing.
Listing 8.15 Restarting the CloudWatch agent and configuring to run on boot
$ sudo systemctl start amazon-cloudwatch-agent.service      ①
$ sudo systemctl enable amazon-cloudwatch-agent.service     ②
① This command starts the CloudWatch agent.
② This command starts the CloudWatch agent at boot.
That’s all! As long as your EC2 instance role has permission to write to CloudWatch, your server logs will start showing up in the CloudWatch Logs console. If you do have permissions issues, then you need to add the CloudWatchAgentServerPolicy AWS managed policy to your EC2 instance’s role. This can be done in the IAM console or with the CLI using the AttachPolicy command.
Alternative tools to CloudWatch have their own equivalent of the CloudWatch Logs agent. The Splunk Universal Forwarder and Datadog Agent are very similar. Once you install and configure them, they periodically upload events to the respective services. Prometheus is a bit different in that it uses per-application exporters, rather than a single host-level agent. To export data from our Apache server logs with Prometheus, we could use the Apache Exporter for Prometheus.
With our web server now uploading logs to CloudWatch, let’s explore some of the more advanced features of CloudWatch we can use for viewing and processing our logs.
8.3.3 Advanced CloudWatch Logs features
Earlier in this section we viewed the logs of our Lambda function in the CloudWatch console. CloudWatch provides many more features on top of just viewing and searching log entries. Here we’ll look at four other features and why you might want to use them.
CloudWatch Logs Insights is a feature that allows you to write queries against your log groups and view aggregated results or visualizations. The query language takes some time to get used to, but it provides a lot of useful analysis on your logs. AWS also has several very useful example queries. We’ll show one of their examples for AWS Lambda here.
Recall when we viewed the CloudWatch Logs for our Lambda function earlier that there were log statements like the following:
REPORT RequestId: 89bdae30-8b8c-4887-8c79-6921c61e4ed0   Duration: 71.59 ms
➥ Billed Duration: 100 ms   Memory Size: 512 MB   Max Memory Used: 90 MB
Part of this log entry is the duration, or how long our Lambda function took to execute. In this case it was 71.59 ms. We can use a CloudWatch Logs Insight query to visualize the duration of all of the Lambda function executions. We’ll use this query created by AWS, as shown in the following listing.
Listing 8.16 CloudWatch Logs Insight query to plot Lambda function execution durations
① Only looks at the REPORT log entries
② Calculates statistics on average duration, max duration, and minimum duration
③ Groups the values in 5-minute intervals
After we hit the Run Query button, CloudWatch Insights shows us the graph shown in figure 8.14.

Figure 8.14 A sample CloudWatch Insights visualization using the built-in logs of a Lambda function. The graphs show the average, maximum, and minimum execution durations over 5-minute periods.
CloudWatch Logs Insights gives us an easy way to visualize the data in CloudWatch Logs. We could use this same feature to view all kinds of information, like traffic patterns in our Apache web server access logs.
CloudWatch Logs supports searching on your logs. However, if you have a lot of log entries, these searches can take a very long time. In this case, you can speed up these searches by using a dedicated search engine, such as Elasticsearch. Note that AWS maintains their own distribution of Elasticsearch called OpenSearch. If you were to search for a single log entry among millions in CloudWatch Logs, it could take more than 10 minutes to get your answer. That might be fine if you only search occasionally, but if you need to make a lot of searches, then this is way too long. OpenSearch is a search engine built to solve problems like this. It can search across millions of records in less than a second.
Rather than rewriting your application to send logs to OpenSearch instead of CloudWatch, CloudWatch has a feature to support this use case. CloudWatch Logs subscriptions allow you to forward your logs to another destination—either an OpenSearch cluster or a Lambda function. The process of setting this up only takes a couple of steps in the console. First, we need to create an OpenSearch cluster to hold the logs, then we need to create a subscription on our log group to send the logs to our new cluster. Creating a new OpenSearch cluster in AWS just takes one command, as shown in the following listing.
Listing 8.17 Creating an AWS managed OpenSearch domain
$ aws es create-elasticsearch-domain
    --domain-name my-logs-cluster
    --elasticsearch-version 6.2
    --elasticsearch-cluster-config
➥ InstanceType=m4.large.elasticsearch,InstanceCount=1
    --ebs-options EBSEnabled=true,VolumeType=standard,VolumeSize=10
    --access-policies ‘{"Version": "2012-10-17", "Statement": [ { "Effect":
➥ "Allow", "Principal": {"AWS": "arn:aws:iam::123456789012:root" },    ①
➥ "Action":"es:*", "Resource": "arn:aws:es:us-west-                    ①
➥ 1:123456789012:domain/my-logs-cluster/*" } ] }’                      ①
① Replace 123456789012 with your account ID.
It may take several minutes for your OpenSearch cluster to initialize and be ready to start loading data. You can track the progress of the cluster in the AWS OpenSearch console. Once it’s fully initialized, you can configure CloudWatch to send your logs over. Though this can be done with the CLI as well, we’ll use the console, as it allows you to test some of the options before starting. Begin by navigating in the console to the log group that you want to show up in OpenSearch. As shown in figure 8.15, under the Actions menu, select the Create OpenSearch Subscription filter.

Figure 8.15 The CloudWatch log group page allows you to create an Elasticsearch/OpenSearch subscription filter, which automatically sends all of the logs to an OpenSearch cluster.
At this point you’ll see a page, as shown in figure 8.16, that helps you set up your subscription filter. You first need to select the OpenSearch cluster and then define your log format. If you’re using one of the common log formats, then AWS will prepopulate the subscription filter pattern for you. Otherwise, you’ll have to define your own subscription filter that dictates the fields of your log entries and how they’ll show up in OpenSearch. The common log formats are the following:

Figure 8.16 Setting up an OpenSearch/Elasticsearch subscription filter requires defining the log format and subscription filter pattern.
Once we’ve done that, we can test our subscription filter, like in figure 8.17, to make sure it’s working as expected. You can select a recent log stream in your log group to test on, or you can paste in some log entries yourself. When you click the test pattern button, it will show you how the selected log entries would show up as records in OpenSearch.

Figure 8.17 In the CloudWatch Logs console, you can test your subscription filter patterns before creating subscriptions.
When you’ve tested your log subscription filter, and everything is working the way you want, click the Start Streaming button to complete the subscription. Now, your logs will start flowing into your new OpenSearch cluster, and you can search on the logs there.
At some point you may want to get your logs out of CloudWatch for use somewhere else. This might be for sharing logs with someone else who doesn’t have access to your AWS account or, perhaps, for feeding into another tool that can’t read directly from CloudWatch. In this situation you can use the built-in export tool to send your logs as files to Amazon S3.
From the CloudWatch console, select the log group you want to export. In the actions menu select the Export Data to Amazon S3 option. You should see a page like the one in figure 8.18. All you need to do is choose the time range you want to export and the bucket you want to put the logs in. Once you do this, CloudWatch will start uploading the logs to your S3 bucket. If you selected a time range with a large number of log entries, this could take a while.

Figure 8.18 CloudWatch allows you to export all of the logs from a log group over a certain time range into Amazon S3, where the log files can be shared, archived, or processed for further analysis.
8.3.4 Recording network traffic
Just like the management events discussed at the beginning of this chapter, network traffic is a hugely useful auditing tool. Many of the network-based attacks we discussed in chapters 5 and 6 can be easily investigated with traffic logs. Recall in chapter 7 that we used VPC Flow Logs to record this traffic information from any of our VPCs. All we have to do to enable flow logs for a VPC is use the Create Flow Log wizard in the VPC console, as we did in the last chapter.
Unlike CloudTrail for management events, VPC Flow Logs doesn’t have its own way of viewing the logs. Instead, VPC Flow Logs are sent to either Amazon S3 or CloudWatch Logs. If we configure our VPCs and other network resources to send flow logs to CloudWatch Logs, we can use all of the tools we just discussed to analyze our network traffic. For example, we can use CloudWatch Insights to quickly get information from our flow logs, even when there is a lot of data to sift through. CloudWatch Insights comes with several predefined queries, specifically for flow logs. In the following listing is one for identifying the IP addresses that are transferring the most data.
Listing 8.18 CloudWatch Insights query highlighting send and receive IP pairs
This type of information could help you identify an attacker if they were exfiltrating data or performing a DoS attack. The output from this Insights query would look like table 8.3.
Table 8.3 Sample CloudWatch Insight result for IP addresses with most bytes transferred
Throughout this chapter we looked at several different types of logs and how we can collect and analyze them within AWS. We’ll build on this in the next chapter and see how we can use these logs to automatically detect security issues as they happen.
Summary
-
Turning on audit logging is important to do now, so the logs are available when an incident happens.
-
AWS CloudTrail logs management events in your account, which can help you identify what went wrong in an incident.
-
Having a timeline of resource configuration changes, like with AWS Config, allows you to quickly identify when attacks or misconfigurations occurred.
-
Centralizing application logs into a single place makes it easier for you to view and analyze the logs.
-
Insight queries in CloudWatch help you sift out information from your logs, even when there are a lot of them.
-
Exporting logs to S3 or OpenSearch can make it easier for you to do custom analysis or use third-party tools that don’t integrate with CloudWatch.
-
Routing VPC Flow Logs to CloudWatch allows you to do analysis on your network traffic in the same way you would for application logs.