
![]()
Standardizing BI Report Suites
So far in this book you have seen myriad ways to deliver eye-catching business intelligence to corporate users. A successful BI project can-indeed, possibly should-be a victim of its own success. That can mean users requesting more and more reports, dashboards, and output to different devices. If this happens, it is easy to get swamped by the amount of work that must be done. So you need to know some of the approaches that can save time when building BI report suites.
The time-saving techniques that you will look at in this chapter include
- Planning for reuse
- Using shared datasets
- Copying multiple elements between reports
- Using database images and image datasets
- Creating “styles” in reports to ensure homogeneity across reports
These techniques will use the same sample database that you have used so far in this book, so I hope that you have already downloaded it from the Apress web site.
Planning for Reuse
If you have spent some time developing a report, and you subsequently find yourself needing all or part of it in another report, your first reaction should probably be to think “how can I make this reusable?” Equally, if you are seeing demand grow for output to various handheld devices, or reports that share common elements, you should probably think in terms of doing some or all of the following:
- Build the “components” that make up dashboards and tablet reports, and then assemble them as required by user demand (as you have done in previous chapters).
- Create “template” reports that contain common data sources and datasets (as you have done in previous chapters).
- Design stored procedures carefully, so that they can either be reused in different reports or can serve as the basis for new stored procedures.
- Think in terms of shared datasets (more on this later).
- Build parameter lists as stored procedures, especially if you are using cascading parameters.
Of course, each project’s requirements will be different, and some solutions will not apply to every environment. Nonetheless, bearing these ideas in mind can help you to save time and energy.
Shared Datasets
A technique that you have been applying throughout this book is the centralized definition of source data as shared datasets. To reiterate, a shared dataset is a query (either as a code snippet or as a stored procedure) that is defined like any report-specific dataset. However, it can be applied to any report simply by selecting it from the list of shared datasets in a report project.
Moreover, once a shared dataset has been added to a report, you can apply filters and/or calculated fields just as you can to a standard dataset. You can even apply the same shared dataset several times (providing that you give each instance a different name). This can allow you, for instance, to have a project-wide dataset that you then filter on multiple different criteria inside a report.
A shared dataset must be based on a shared data source, as you have done with the shared datasets used as examples in earlier chapters of this book. Moreover, a shared dataset can be cached (and scheduled) to accelerate report delivery, but more on that in the final chapter.
![]() Note As you have probably noticed, Visual Studio adds a visual indicator (a small arrow in the bottom left corner) to any shared datasets that are inside the datasets folder of the Report Data window.
Note As you have probably noticed, Visual Studio adds a visual indicator (a small arrow in the bottom left corner) to any shared datasets that are inside the datasets folder of the Report Data window.
There are, inevitably, a few limitations to shared datasets. Essentially, they are fairly rigidly defined when created, and cannot be altered significantly when applied to a report. More specifically,
- A shared dataset’s data source cannot be changed in the report.
- A shared dataset’s query cannot be changed in the report.
- The fields in a shared dataset cannot be altered, but you can add calculated fields.
Generally, I recommend the use of shared datasets when creating BI reporting suites. Defining a clear set of core data is a good discipline when planning a collection of reports. Forcing yourself to specify the required data and then breaking this down into separate, reusable, shared datasets can be a profitable part of the initial analysis.
![]() Note I advise against creating very wide generic shared datasets; these can slow down report delivery because they send quantities of unneeded data through the network. Efficient shared datasets are those that deliver just the right amount of data.
Note I advise against creating very wide generic shared datasets; these can slow down report delivery because they send quantities of unneeded data through the network. Efficient shared datasets are those that deliver just the right amount of data.
Adding Multiple Data Sources, Datasets, or Image Files
You may find that you have a component file that contains multiple datasets (and possibly multiple data sources too). Another eventuality is that a report that you are building requires dozens of images that you have already added to a previous report. Adding them one by one (especially to multiple destination files) would be extremely laborious. Consequently, you would like to copy them from the existing report into the new one. Fortunately, there is an easy way to copy multiple image files, data sources, or datasets between reports. This involves using the XML code that constitutes the SSRS .rdl file. What you have to do is to open the source code, locate the XML that you want to transfer, and copy it into the destination file.
Copying Images Between Reports
Here is an example of how to copy several images between two reports. As a source for the images that you require, you will be using the file _ColorSalesWithBorder.rdl. This report contains eight images that you need in another report. Manually reinserting these images would be slow, painful, and could lead to errors. Here is how to copy them all at once.
- Right-click the file containing the images (or other reference elements) that you want to copy into another report. In this case, it is _ColorSalesWithBorder.rdl.
- Select View Code. The file will open as XML.
- Click Edit
 Find and Replace Quick Find. Enter EmbeddedImages as the text to find and click Find.
 - Select the EmbeddedImage tags, including the opening and closing tags, for the collection of images that you want to transfer, then click Copy. You will see something like the XML in Figure 11-1.

Figure 11-1. The XML for embedded images
- View the code for the “destination” report, and search for the EmbeddedImage tags. Paste the XML that you copied between the <EmbeddedImage> ... </EmbeddedImage> tags.
- Save the code and close the file.
- Reopen the file normally. You will see the images that you just copied if you expand the Images folder in the Report Data window.
Hints and Tips
There are a couple of points to note about this technique.
- If your destination report (the dashboard, in your example) does not contain the <EmbeddedImage> ... </EmbeddedImage> tags (because there are no images in the report already), you can add them manually. These tags must only be nested in the <Report>..</Report> tags, and not inside any other tag.
- If you need to copy multiple images that are not part of a contiguous bloc, as they are in this example, you could consider copying and pasting the required image tags into a Notepad file before pasting them all together into the destination file.
Copying Datasets Between Reports
If you are copying data sources between reports, the procedure is largely identical to the one you just saw for images. The only difference is that you need to look for the <DataSources>...</DataSources> Xml tags. An example is
<DataSources>
  <DataSource Name="CarSales_Reports">
    <DataSourceReference>CarSales_Reports</DataSourceReference>
    <rd:SecurityType>None</rd:SecurityType>
    <rd:DataSourceID>41799262-6788-4b94-8049-3c91f78c06a7</rd:DataSourceID>
  </DataSource>
</DataSources>
Once you have found the data source(s) that you want, copy them into the destination report. If your destination report does not already have any data sources, you will need to include the outer <DataSources>...</DataSources> XML tags. Otherwise, you can add the data source itself (the snippet enclosed by the <DataSource>...</DataSource> XML tags) inside the <DataSources>...</DataSources> tags, but not inside any existing the <DataSource>...</DataSource> tags.
Copying Datasets Between Reports
Datasets follow the same principles, only you need to look for the <DataSets>...</DataSets> tags. An example is
<DataSets>
  <DataSet Name="CurrentMonth">
    <SharedDataSet>
      <SharedDataSetReference>CurrentMonth</SharedDataSetReference>
    </SharedDataSet>
    <Fields>
      <Field Name="CurrentMonth">
        <DataField>CurrentMonth</DataField>
        <rd:TypeName>System.Int32</rd:TypeName>
      </Field>
    </Fields>
  </DataSet>
</DataSets>
Once again, if your destination report does not already have any datasets, you will need to include the outer <DataSets>...</DataSets> XML tags. Otherwise, you can add the data source itself (the snippet enclosed by the <DataSet>...</DataSet> XML tags) inside the <DataSets>...</DataSets> tags, but not inside any existing the <DataSet>...</DataSet> tags.
Images in BI Projects
In this book, up until now you have only used embedded images in the reports that you have created. This approach is a great solution for a few images, for images that never change, or for images that are only used in a single report. However, if you have hundreds of images, or if you have images that need to be added to (and probably updated in) dozens-or hundreds-of reports, then using database-based images is probably a more efficient solution.
Using images from a database is not difficult, but it does require a little planning and organization. Firstly, you need a clean table structure in which to store your images, and it helps to have all the image metadata that you could require as well. Then, as you will soon see, you need ways of selecting images from a table of images and delivering them to the report. This section explains all of the basic techniques you will use to centralize and distribute images in SSRS.
Loading and Importing Database Images
If you are aiming to store report images in a SQL Server table, you need to be able to load and unload binary files to and from a database. This is not difficult, but to save you having to dig out the code, an example follows. Firstly, you need a table to store the images. The code for this is
CREATE TABLE Data.ReportImages
(
        ID int IDENTITY(1,1) NOT NULL,
        FileName nvarchar(50) NULL,
        FileExtension nvarchar(5) NULL,
        FileType nvarchar(5) NULL,
        ImageDescription nvarchar(max) NOT NULL,
        BinaryData varbinary(max) NULL,
        DateLoaded datetime NULL
)
Loading a single image requires a short code snippet like the following one:
INSERT INTO Data.ReportImages
(FileName, FileExtension, FileType, ImageDescription, BinaryData)
SELECT 'UK_Round', '.png', 'PNG', 'UK Flag'
, * FROM OPENROWSET(BULK N'C:BIWithSSRSImagesUnionJack.png', SINGLE_BLOB) img
You do not have to add or use fields such as FileName and FileExtension if you do not want to, but they can be useful in certain circumstances. Indeed, you might want to add fields that allow you to categorize your images, or even list the reports they are used in. You might also want to add fields to store the image height and width, or possibly categorize the image resolution (high, medium, or low).
![]() Note If you need further information on images in databases, or have a requirement to load multiple images at once, export or update images, or if you simply prefer to use SQL Server Integration Services to load your image files into a database, these techniques are explained in my book SQL Server 2012 Data Integration Recipes (Apress 2012).
Note If you need further information on images in databases, or have a requirement to load multiple images at once, export or update images, or if you simply prefer to use SQL Server Integration Services to load your image files into a database, these techniques are explained in my book SQL Server 2012 Data Integration Recipes (Apress 2012).
Using Images from a SQL Server Table
I will assume that you have created the table Data.ReportImages using the DDL given above, and that you have loaded the following images from the directory C:BIWithSSRSImages (assuming that you have downloaded the sample data from the Apress web site):
- UnionJack
- UK_Round
- SwissFlag_Round
- FrenchFlag_Round
- GermanFlag_Round
Once you have loaded the image files, running a simple SELECT query against the table Data.ReportImages should return the data shown in Figure 11-2.

Figure 11-2. The image table with a few files loaded
You will now see how to use these images in
- Image items
- Text boxes
- Table backgrounds
- Gauge backgrounds
Adding a Dataset for Images to a Report
As any images that you want to use are in a database, you will need a dataset to deliver them from the database to the report. However, you will need a way to define which image is going to be used from all those in the table. There are really only two solutions:
- Set up a dataset for each image so that a single image is returned.
- Pivot a group of images and select the appropriate image to apply from the fields that are available in the pivot set.
Let’s see an example of each.
Multiple Image Datasets
If your report only contains a handful of images at the most, then you are probably best served by doing the following:
- Creating a shared dataset that returns the image data.
- Creating multiple datasets based on this shared dataset where each derived dataset has a filter applied to return only the required image.
To make this clearer, here is an example.
- Create a stored procedure named Code.pr_Images using the following code:
CREATE PROCEDURE Code.pr_Images

AS

  SELECT
  BinaryData AS ImageData
  ,FileType
  ,FileName

FROM Data.ReportImages - Create a new, shared dataset named ReportImages using the data source CarSales_Reports. Set it to use the stored procedure Code.pr_Images.
- Create a new, blank report and add the shared data source CarSales_Reports.
- Add a new dataset using the shared dataset named ReportImages. Name the first instance of this shared dataset UKFlagImage.
- Click Filters on the left.
- Click Add.
- Set the following filter attributes:
- Expression: FileName
- Operator: =
- Value: UK_Round
- Click OK.
Once your first dataset has been set up, you can create as many similar datasets as you have images that you want to use in your report. The only trick is to use a suitable name for the dataset, and filter each dataset to use the appropriate record from the image table. You will see how to apply this image in a couple of pages.
Pivoted Image Datasets
As you can probably imagine, having a dataset per image can rapidly become unmanageable when reports have more than a few images. An alternative solution is to deliver images to reports using a single dataset. This dataset consists of a single record where each column in the dataset contains an image. In other words, you are simply pivoting the source table.
As a simple example, take a look at the following code snippet, which returns a chosen subset of images from the table Data.ReportImages:
CREATE PROCEDURE Code.pr_ImageFlags

AS

SELECT
 (SELECT BinaryData FROM Data.ReportImages WHERE FileName = 'UK_Round') AS UK_Round
,(SELECT BinaryData FROM Data.ReportImages WHERE FileName = 'SwissFlag_Round')
  AS SwissFlag_Round
,(SELECT BinaryData FROM Data.ReportImages WHERE FileName = 'FrenchFlag_Round')
  AS FrenchFlag_Round
The output from this ’sproc looks something like Figure 11-3.

Figure 11-3. Pivoted image output
As it is the column name that specifies which image is contained in the binary data, you effectively have a useable set of images to apply in a report. To use this pivoted source of database images, follow these steps.
- Create a report and add the dataset UKFlagImage that you created previously.
- Create a new, shared dataset named ReportMultiImages using the data source CarSales_Reports. Set it to use the stored procedure Code.pr_ImageFlags.
- Create a new, blank report and add the shared data source CarSales_Reports.
- Add a new dataset using the shared dataset named ReportImages. Name this shared dataset ImageFlags.
![]() Note You do not have to use a shared dataset, but as this chapter is all about reusability I want to stick to the principles that you should be applying across the board.
Note You do not have to use a shared dataset, but as this chapter is all about reusability I want to stick to the principles that you should be applying across the board.
Hints and Tips
There is one tip that you may find useful when using multiple images from a database in SSRS.
- It can be a good idea to prepare several sets of pivoted images (grouping them thematically, for instance) rather than trying to create a single massive image set containing every image in your table of images. This also makes applying the images easier, as you will not be scrolling through vast lists of images.
Database Images in Image Items
I realize that many readers will find this illustration a little obvious, but in the interest of completeness, here is how to use a database image in an image item.
- Drag an Image item from the toolbox onto the report area. The image properties dialog will appear.
- Select Database as the image source from the pop-up.
- Select =First(Fields!ImageData.Value, "UKFlagImage") as the field to use.
- Select Image/png as the MIME type.
Be warned that you will not see the image until you preview or deploy and display the image. I realize that this can be frustrating at first.
![]() Note If you are using the pivoted image dataset (ImageFlags) in step 3, then you must be sure to use the appropriate dataset name as well as the column name that maps to the image that you want to see displayed.
Note If you are using the pivoted image dataset (ImageFlags) in step 3, then you must be sure to use the appropriate dataset name as well as the column name that maps to the image that you want to see displayed.
Database Images in Text Boxes
To ensure that you can use database images in all possible circumstances (while accepting that this may be a bit simplistic for some readers), here is how to add a database-based image as the background to a text box.
- Create a report and add the dataset UKFlagImage that you created previously.
- Add a text box to the report where you want to use an image as a text box background.
- Display the Properties window.
- Expand the BackgroundImage category and set the following elements:
- Source: Database
- Value: =First(Fields!ImageData.Value, "UKFlagImage")
- MIMEType: image/png
Once again, you will only see the image when the report is previewed, or deployed and viewed.
Database Images in Table Backgrounds
Adding an image from a database to a table as the table background is virtually identical to the way that you added an image to a text box. For the sake of completeness, here is how to do it.
- Create a report and add the dataset UKFlagImage that you created previously.
- Select the table where you want to use an image as a text box background.
- Display the Properties window.
- Expand the BackgroundImage category and set the following elements:
- Source: Database
- Value: =First(Fields!ImageData.Value, "UKFlagImage")
- MIMEType: image/png
Once again, you will only see the image when the report is previewed, or deployed and viewed.
![]() Note An image sourced from a database is an image like any other. So you will still have to set any relevant properties such as the Sizing property for image items and the BackgroundRepeat for text boxes.
Note An image sourced from a database is an image like any other. So you will still have to set any relevant properties such as the Sizing property for image items and the BackgroundRepeat for text boxes.
Database Images in Gauge Backgrounds
Using database images for a gauge is only a slight variation on the techniques that you have seen so far.
- Select the gauge (and not the gauge panel) where you want to add an image.
- Expand the BackFrame category, then the FrameImage category, and set the following elements:
- Source: Database
- Value: =First(Fields!ImageData.Value, "UKFlagImage")
- MIMEType: image/png
Once again, you will only see the image when the report is previewed, or deployed and viewed.
![]() Note Remember that if you have an image database, you may want first to create a shared dataset to query the image table, and secondly to add this dataset to any reports that you are using as templates (or models) for future reports. In the example solution used in this book, you would add a shared dataset like this to the reports __BaseReport.rdl and __DateSelector.rdl, for instance.
Note Remember that if you have an image database, you may want first to create a shared dataset to query the image table, and secondly to add this dataset to any reports that you are using as templates (or models) for future reports. In the example solution used in this book, you would add a shared dataset like this to the reports __BaseReport.rdl and __DateSelector.rdl, for instance.
As many developers have noted over the years, SSRS does not have any form of built-in style sheets. This means, in practice, that you can expend considerable effort doing the following:
- Creating objects (tables, text elements, chart attributes) that look the same across dozens of reports.
- Updating objects in dozens of reports when the corporate style gurus decree a minor change to an aspect of a report.
There is a (fairly) simple workaround to this problem-a problem that affects all SSRS reporting, and not just BI reports, incidentally-and it is to record style attributes in a central database table. These attributes are then applied from the database table. Although this approach can add a little time to the initial development of a report, this investment is rapidly recovered because
- Standards are defined.
- Presentation attributes are applied across an entire reporting suite.
- Stylistic and typographical errors are minimized.
- Any update is made once at a central point, and then the reports that refer to the style are updated automatically the next time they are displayed.
It has to be said that applying styles from a database table is a little laborious; the approach is not as simple or harmonious as the use of style sheets in Microsoft Word, for example. However, I can only repeat that if this approach is implemented early on in a project, it is truly worth the effort.
As an example, let’s suppose that you have analyzed a series of presentational attributes that you will be applying to a set of BI reports. These attributes cover the following aspects of a report:
- Header text
- Subheader text
- Table text (header, subheader, body text, and totals)
- Chart titles
- Chart axis titles (X and Y)
Clearly, there could be much, much more but this is surely enough to give you an idea of what can (and must) be done.
These elements are stored in a table with the following DDL:
CREATE TABLE Reference.SSRS_Styles(
     ID int IDENTITY(1,1) NOT NULL,
     StyleFamily varchar(50) NULL,
     HEADER_Font_Colour varchar(50) NULL,
     HEADER_Font_Size varchar(50) NULL,
     HEADER_Font_Family varchar(50) NULL,
     HEADER_Font_Style varchar(50) NULL,
     HEADER_Font_Weight varchar(50) NULL,
     SUBHEAD_Font_Colour varchar(50) NULL,
     SUBHEAD_Font_Size varchar(50) NULL,
     SUBHEAD_Font_Family varchar(50) NULL,
     SUBHEAD_Font_Style varchar(50) NULL,
     SUBHEAD_Font_Weight varchar(50) NULL,
     TABLE_MAINTITLE_Font_Colour varchar(50) NULL,
     TABLE_MAINTITLE_Font_Size varchar(50) NULL,
     TABLE_MAINTITLE_Font_Family varchar(50) NULL,
     TABLE_MAINTITLE_Font_Style varchar(50) NULL,
     TABLE_MAINTITLE_Font_Weight varchar(50) NULL,
     TABLE_MAINTITLE_Background_Colour varchar(50) NULL,
     TABLE_SUBTITLE_Font_Colour varchar(50) NULL,
     TABLE_SUBTITLE_Font_Size varchar(50) NULL,
     TABLE_SUBTITLE_Font_Family varchar(50) NULL,
     TABLE_SUBTITLE_Font_Style varchar(50) NULL,
     TABLE_SUBTITLE_Font_Weight varchar(50) NULL,
     TABLE_SUBTITLE_Background_Colour varchar(50) NULL,
     TABLE_TOTAL_Font_Colour varchar(50) NULL,
     TABLE_TOTAL_Font_Size varchar(50) NULL,
     TABLE_TOTAL_Font_Family varchar(50) NULL,
     TABLE_TOTAL_Font_Style varchar(50) NULL,
     TABLE_TOTAL_Font_Weight varchar(50) NULL,
     TABLE_TOTAL_Background_Colour varchar(50) NULL,
     TABLE_STANDARD_Font_Colour varchar(50) NULL,
     TABLE_STANDARD_Font_Size varchar(50) NULL,
     TABLE_STANDARD_Font_Family varchar(50) NULL,
     TABLE_STANDARD_Font_Style varchar(50) NULL,
     TABLE_STANDARD_Font_Weight varchar(50) NULL,
     TABLE_STANDARD_Background_Colour varchar(50) NULL,
     CHART_MAINTITLE_Font_Colour varchar(50) NULL,
     CHART_MAINTITLE_Font_Size varchar(50) NULL,
     CHART_MAINTITLE_Font_Family varchar(50) NULL,
     CHART_MAINTITLE_Font_Style varchar(50) NULL,
     CHART_MAINTITLE_Font_Weight varchar(50) NULL,
     CHART_MAINTITLE_Background_Colour varchar(50) NULL,
     CHART_SUBTITLE_Font_Colour varchar(50) NULL,
     CHART_SUBTITLE_Font_Size varchar(50) NULL,
     CHART_SUBTITLE_Font_Family varchar(50) NULL,
     CHART_SUBTITLE_Font_Style varchar(50) NULL,
     CHART_SUBTITLE_Font_Weight varchar(50) NULL,
     CHART_SUBTITLE_Background_Colour varchar(50) NULL,
     CHART_Y_AXIS_Font_Colour varchar(50) NULL,
     CHART_Y_AXIS_Font_Size varchar(50) NULL,
     CHART_Y_AXIS_Font_Family varchar(50) NULL,
     CHART_Y_AXIS_Font_Style varchar(50) NULL,
     CHART_Y_AXIS_Font_Weight varchar(50) NULL,
     CHART_X_AXIS_Font_Colour varchar(50) NULL,
     CHART_X_AXIS_Font_Size varchar(50) NULL,
     CHART_X_AXIS_Font_Family varchar(50) NULL,
     CHART_X_AXIS_Font_Style varchar(50) NULL,
     CHART_X_AXIS_Font_Weight varchar(50) NULL,
 CONSTRAINT PK_SSRS_Styles PRIMARY KEY CLUSTERED
(
     ID ASC
)WITH (PAD_INDEX = OFF, STATISTICS_NORECOMPUTE = OFF, IGNORE_DUP_KEY = OFF, ALLOW_ROW_LOCKS = ON, ALLOW_PAGE_LOCKS = ON) ON PRIMARY
) ON PRIMARY
As you can see, the table reflects the some of the various properties that you can set in the Properties window for text boxes (including inside tables) and charts. Indeed, you must create a separate field in the style table for each property element that you wish to set in this way.
A small snippet of what some of the data in this table will look like is shown in Figure 11-4.
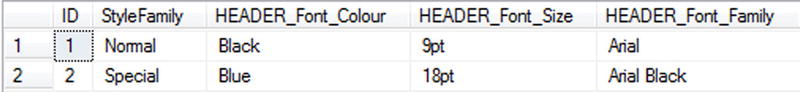
Figure 11-4. Data in a style table
As you can see, this approach lets you set multiple “families” (or groups) of attributes identified by a reference, Normal or Special in this example. You will use this criterion to set the overall presentation of a set of visual attributes in a few minutes.
In keeping with the logic used so far in this book, here is the stored procedure that will be used to return data from the table to a report:
CREATE PROCEDURE Code.pr_StyleOutput
(
@StyleFamily VARCHAR(50)
)

AS

SELECT  *
FROM    Reference.SSRS_Styles
WHERE   StyleFamily = @StyleFamily
Applying Style Information from a Database Table
Once you have a table that contains style definitions for a report suite, you can start applying the style attributes, rather than hard-coding them as you have done up until now. Here is a short example to show how to format a text box.
- Create a new, shared dataset named StyleOutput using the data source CarSales_Reports. Set it to use the stored procedure Code.pr_ StyleOutput.
- Create a new, blank report and add the shared data source CarSales_Reports.
- Add a new dataset using the shared dataset named StyleOutput. Name this shared dataset StyleOutput.
- While the Dataset Properties dialog is open, click Parameters on the left.
- Click Add.
- Set (though it should appear by default) @StyleFamily as the parameter name and Special as the parameter value.
- Add a text box and enter some text. Tradition dictates that this really should be Hello World...
- Select the text box and display the Properties window.
- Expand the Font property.
- Set the FontFamily property to the expression =First(Fields!HEADER_Font_Family.Value, "StyleOutput")
- Set the FontSize property to the expression =First(Fields!HEADER_Font_Size.Value, "StyleOutput")
- Set the Color property to the expression =First(Fields!HEADER_Font_Colour.Value, "StyleOutput")
That is all that you have to do, at least for this text box. As was the case with images earlier, you will not see the results of your formatting until you either preview or deploy and view the report.
The advantages of this approach are probably not instantly obvious. So to make the point, double-click the dataset StyleOutput and alter the parameter value from Special to Normal, then preview the report. A completely different set of attributes will be applied, and the text box will no longer be in blue, Arial Black 18 point, but black Arial 9 point.
So, despite the fact that applying the properties takes a little longer, you now have a centralized repository for key visual attributes for a report. You can decide at the level of a report which set of styles is applied as well as ensure that a single change to a table element is reflected across a suite of reports.
Hints and Tips
Just to give you a few more ideas, consider these tips.
- If you are reusing widgets targeting different devices (for smartphones, tablets, or laptops, for instance), you can define a style set for each type of device. So, for instance, smartphones could have smaller text but more striking colors, laptops could use pastel shades, etc.
- Rather than using a single style table as I did here, you could have smaller (and more manageable) tables focusing on a type of object: one for tables, one for charts, and one for gauges, for instance.
- Create preformatted tables using the colors, fonts, and borders that you want to use across your reportset. All you then need to do is change the dataset and apply the fields in cells and expressions.
Conclusion
In this chapter, you saw a series of ideas that enable you to standardize presentation across a range of BI reports. You saw techniques that range from ways to copy essential objects such as dataset and images between reports, to ways of sharing commonly used items between reports. Then you saw how to store repeatedly-used images in a database and from there deliver them to reports, both individually and as sets of images. Finally, you saw that report properties can be centralized too in a database and used as the basis for standardized presentation.
So now it is time to move on to the last chapter and take a look at a few ways of delivering your BI dashboards and tablet visualizations to your users faster and more smoothly.