Chapter 9
The (Un)Common Data Analytics Tools
This chapter covers Objective 3.4 (Identify common data analytics tools) of the CompTIA Data+ exam and includes the following topics:
 Structured Query Language (SQL)
- Python
- Microsoft Excel
- R
- Rapid mining
- IBM Cognos
- IBM SPSS Modeler
- IBM SPSS
- SAS
- Tableau
- Power BI
- Qlik
- MicroStrategy
- BusinessObjects
- Apex
- Dataroma
- Domo
- AWS QuickSight
- Stata
- Minitab
For more information on the official CompTIA Data+ exam topics, see the Introduction.
This chapter covers the most common and not-so-common data analytics tools.
ExamAlert
The intent of this CompTIA Data+ objective is not to test specific vendor feature sets or the purposes of the tools but to ensure that you understand the variety of tools available for data analysts to perform analytics and get insights about their organizations for better decision making.
Data Analytics Tools
Data analytics tools enhance organizational capability to examine a wide amount of information, enabling better insights and visibility into key processes and leading to data-driven decision making. Data analytics tools make it possible to gain insights ranging from business intelligence to predictive analytics—leveraging unstructured and structured data. The sections that follow briefly describe various data analytics tools.
Structured Query Language (SQL)
Structured Query Language (SQL) is a database query language that was developed for the management and extraction of data in relational database management systems (RDBMSs). SQL has the capability to communicate with several databases at a time and can be used to construct complex queries. SQL operations—including create, read, update, and delete (CRUD) operations—can be used to perform tasks on data in a database.
SQL is an outstanding tool for constructing data warehouses that provide data organization, simple accessibility, and capability to communicate efficiently with business processes and reporting as well as analytics toolsets. Moreover, SQL analytics can be used within languages and/or software platforms such as Hadoop, Python, and Scala.
Note
Chapter 1, “Understanding Databases and Data Warehouses,” covers the basics of SQL as a language of choice for relational database and data warehouse solutions.
The following example of a SQL statement allows you to select all values from the specified table:
SELECT * FROM <table_name>This example allows you to select all customers with which your organization interacted in the year 2010 and orders them by country names, in ascending order (that is, A–Z):
SELECT * FROM Customer

 WHERE year = 2010

 ORDER BY Country
It is important to understand that SQL by itself is not an analytics tool; however, analytics tools such as Tableau and Google Looker Studio leverage SQL to interact with data warehouses and data lakes.
Python
Python is a very popular scripting language that is used to automate network operations. It is often used because of its extensive set of libraries by network engineers. It is, however, also very popular among data scientists. Python can manage huge amounts of information and can manage and create data structures rapidly. Python is an open source language, and there is a very strong community around Python-based data analytics. A simple search on Google for “Python data analytics” with “GitHub” would yield multiple results.
For example, Numerical Python, or NumPy, is the fundamental package required for scientific computing and data analysis. With this package, you can run an analysis of variance (ANOVA) test to compare the sample means of multiple groups.
Note
There is a lot more to Python in the context of data analytics and data science; however, the information provided here is all you need to know for the CompTIA Data+exam.
Microsoft Excel
Microsoft Excel is a very familiar program used primarily for spreadsheets. You can use it to arrange data in rows and columns and leverage formulas that prompt the software to carry out mathematical functions on data. Microsoft Excel is typically used to organize information and perform financial calculations as well as for information technology project management. Its dedicated Data tab offers multiple options for analyzing data (see Figure 9.1) and makes Microsoft Excel a very powerful tool. You can play around with what-if situations and carry out data analysis by leveraging data models and queries from within Microsoft Excel.

Figure 9.1 The Data Tab in Microsoft Excel
Figure 9.1 shows the default options available on the Data tab. You can add additional options by selecting File > Options > Add-ins > Analysis Toolpak (see Figure 9.2).

Figure 9.2 Adding Advanced Data Analysis Add-ins
By selecting the option shown in Figure 9.2, you can add a Data Analysis option to the Data tab that opens the door to many advanced functions, as shown in Figure 9.3.
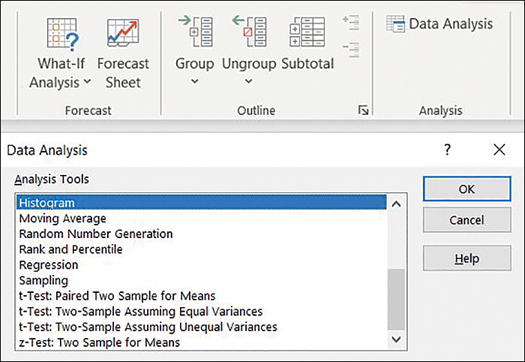
Figure 9.3 Data Analysis Options
R
R is a data analysis tool that is based on the open source R programming language. R is extensively used for statistics, data visualization, and data science projects. You can use R to manipulate information easily and represent it in various ways. R is very popular for the visualizations it offers, including plots, graphs, and charts.
An R package is a collection of functions and data that extends the capabilities of R. Data analysis in R involves importing data to R and running functions to visualize as well as model the data.
R can be downloaded at https://cloud.r-project.org/index.html. Various R packages are available at this website as well.
You can try https://plotly.com/r/ for creating a variety of graphs using R. And you can find an IDE at https://www.rstudio.com/products/workbench/.
Note
Google uses the R data analytics tool for economic forecasting and determining the effectiveness of ads, Facebook uses it for behavior analysis, Uber uses it for statistical analysis, and Twitter uses it for semantic clustering and data visualization.
Rapid Miner
Rapid Miner is an open source data science platform that includes several algorithms for machine learning, preparation of data, text mining, predictive analysis, and deep learning. Data engineers and analysts can use Rapid Miner to extend the Python and R programming languages for data mining.
Rapid Miner can be combined with many types of data sources, including Microsoft Excel, Microsoft Access, Teradata, Microsoft SQL, Sybase, Oracle, MySQL, IBM DB2, Ingres, dBase, and IBM SPSS.
As an example of its use, Rapid Miner can produce analytics based on real-life data points from multiple Internet of Things (IoT) sensors on livestock to predict the quantity of milk that will be produced.
Note
Rapid Miner offers data mining with a template-based approach that reduces human error and enhances speed of delivery.
To learn more about Rapid Miner, visit https://rapidminer.com/.
IBM Cognos
IBM Cognos is a business intelligence (BI) tool that is used for web-based analytics and reporting. IBM Cognos is primarily used by enterprises to aggregate corporate data and produce user-friendly reports. It can be used to create and view reports, examine data, and supervise metrics and events, for effective decision making.
IBM Cognos analytics combines modeling, reporting, dashboards, analysis, event management, and stories to help organizations understand their information and make decisions efficiently.
IBM Cognos is now being offered as part of the IBM Watson family of solutions. To learn more about IBM Cognos, visit https://www.ibm.com/products/cognos-analytics.
IBM SPSS Modeler
IBM Statistical Package Social Science (SPSS) Modeler is a machine learning (ML) and data mining solution from IBM. It is used to construct a predictive structure and organize data for further analytics. IBM SPSS Modeler is designed to acquire predictive intelligence for driving decision making by enterprises and/or systems. It offers both programming-based and visual approaches to data analytics and can enhance the capabilities of R- and Python-based analytics.
IBM SPSS offers advanced statistical analysis and provides a large number of ML algorithms, open source extensibility, and text analysis. In addition, it can be seamlessly deployed and easily used with big data.
Note
Data analysts use IBM SPSS Modeler to examine information by carrying out data mining and then organizing the information into models.
IBM SPSS Modeler assists in the whole process of data mining. IBM SPSS Modeler can be bought as a standalone product or employed as a client that is integrated with an SPSS Modeler server.
To learn more about IBM SPSS Modeler, visit https://www.ibm.com/products/spss-modeler.
SAS
Statistical Analytical System (SAS) is one of the most commonly used solutions for complex statistical operations and advanced analytics. The main uses of SAS are to analyze, extract, and present statistical data in an easy-to-consume format. SAS provides descriptive visualization in the form of graphs, and various SAS solutions offer reporting of data mining, time series, machine learning, and other data.
SAS is easy to learn and offers simple and intuitive interfaces for data analysts who know SQL already. SAS is much prominent across academia and is commonly used in a number of industry verticals, such as banking, life sciences, and manufacturing. SAS offers several types of analysis:
 Mixed model analysis
- Regression analysis
- Distribution analysis
- Descriptive analysis
Note
SAS is a fourth-generation language that depends on user-written SAS programs or scripts.
To learn more about SAS, visit https://www.sas.com/en_us/home.geo.html.
Tableau
Tableau, which is one of the fastest-growing data visualization solutions, has an intuitive interface. Figure 9.4 shows the Tableau dashboard.
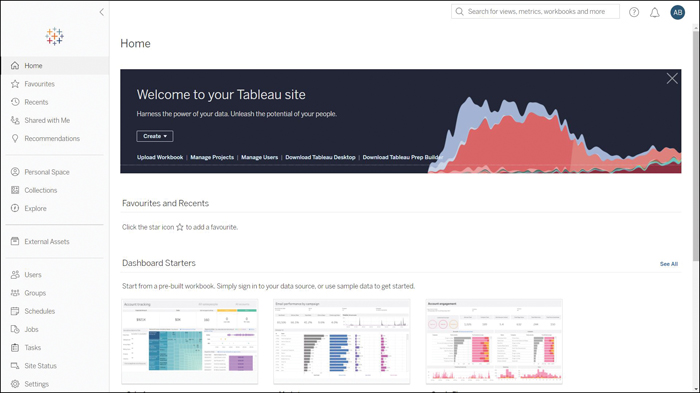
Figure 9.4 Tableau Dashboard
Fun Fact
Visualization tools can make big data analytics look small and small data analytics actionable and insightful!
Figure 9.5 shows a sample Tableau dashboard that illustrates sales progress.

Figure 9.5 Tableau Sample Sales Account Tracking Dashboard
(Source: https://linpack-for-tableau.com/tableau-dashboard/bank-cash-flow/)
Tableau is a remarkable tool for BI and supports effective decision making.
Note
Tableau uses Visual Query Language (VQL) to transform a SQL into visualizations. Moreover, Tableau can handle both continuous and discrete data.
To learn more about Tableau, visit https://www.tableau.com/.
Power BI
Microsoft Power BI is a business analytics solution that enables reporting and visualization—much like Tableau. Power BI is a suite of visualization applications, connectors, and services that can be used together to examine unrelated data sources to form coherent, interactive insights and view immersive visuals.
For example, a sales dashboard might help senior leadership of an organization perceive how the firm is performing in sales compared to the previous year. It may also provide data about the performance of various product segments and what channels are succeeding in acquiring the revenue.
Power BI is a cloud-based offering, and Power BI Desktop allows you to perform localized analytics and dashboarding/reporting. Figure 9.6 provides an overview of Power BI.

Figure 9.6 Power BI Service (Cloud-Based SaaS)
By using Power BI, you can import datasets and start creating reports. You can also use Power BI Desktop to connect with data sources.
To learn more about Power BI, visit https://powerbi.microsoft.com/en-us/.
Qlik
Qlik is a self-service tool for data analytics, data visualization, and BI that drives business value. Qlik offers a complete range of creative visualizations and provides artificial intelligence support for creating charts; it suggests relationships, shows the shape of data, and even prepares the data.
Qlik can consume a large number of data rows from a variety of sources, with different schemas, as well as data with multiple dimensions. It provides responses in a fraction of second.
Qlik offers two BI tools:
- QlikView: QlikView is based on guided data analytics, allowing an end user to work with data models, create diverse visualizations, and deploy their own analytics apps.
- Qlik Sense: Qlik Sense is a self-service tool that allows an end user to perform service analytics, create intuitive and interactive dashboards, and perform custom analytics. Qlik Sense is available as a SaaS offering.
If you are a developer and an avid data analyst, you would be likely to work with Qlik Sense. If you are a non-IT user who wants to perform data analytics, you’ll leverage QlikView.
Visit https://www.qlik.com/us/ to learn more about Qlik.
MicroStrategy
MicroStrategy is a BI platform that supports data mining, predictive analysis, and visualization. MicroStrategy assists in creating scorecards, interactive dashboards, ad hoc reports, highly formatted reports, and alerts and threshold reports. It also handles automated distribution of reports.
Users can leverage drag-and-drop functionality to generate reports using MicroStrategy cloud-based or on-premises solutions. Users are given a choice of sources to collect data from, such as social media or big data platforms. They can create and modify BI reports or dashboards via the MicroStrategy Desktop. MicroStrategy Cloud offers customers agility, scalability, and performance.
Visit https://www.microstrategy.com/ to learn more about MicroStrategy.
BusinessObjects
SAP owns many software solutions, and BusinessObjects is its core data analytics, reporting, and visualization suite. SAP BusinessObjects can be leveraged to publish, create, store, and share reports. Users can start with discovery of data, perform analysis to attain insights, and ultimately create reports that visualize the insights.
SAP BusinessObjects aims to make reporting and analysis simple enough that users can generate reports and perform predictive analytics without input from data analysts. It is geared toward making reporting and visualization possible from a business user perspective.
Learn more about SAP BusinessObjects at https://www.sap.com/australia/products/bi-platform.html.
Apex
The Apex data analytics tool enhances reference data centralization for reliable reporting and aggregation at the enterprise level.
Apex is a development platform for constructing SaaS applications on top of the CRM functionality of Salesforce.com.
Apex permits software developers to access back-end Salesforce databases and client/server interfaces to create third-party SaaS applications.
Datorama
Datorama is a SaaS solution from Salesforce that is focused on analytics and marketing intelligence. Users can leverage this solution and connectors to acquire data from various marketing tools.
Note
Datorama has artificial intelligence–powered processes that enable users to link multiple marketing tools/sources easily and unify all their marketing information in one place.
Datorama can report on and monitor a variety of marketing information in a unified way. Its dashboards offer stakeholders appropriate KPIs and trends.
Note
While the other tools and solutions described to this point in this chapter are usually industry and line of business neutral, Datorama is very specific to marketing operations. It enables marketing teams to invest valuable time performing marketing work rather than spending resources and time on manual reporting and analytics.
To learn more about Datorama, visit https://datorama.com/.
Domo
Domo is a SaaS platform that offers simplified access to BI for decision makers. Domo Business Cloud offers a self-service approach to performing data analysis, generating reports, and making informed decisions based on key data points. Domo offers prebuilt pages that are assembled based on input data automatically. It also offers automated reporting. Domo provides design flexibility and a user-friendly interface.
Visit https://www.domo.com/ for more information about Domo.
AWS QuickSight
Amazon Web Services (AWS) QuickSight is a machine learning–powered cloud-native BI service. You can use AWS QuickSight to collate data across AWS databases and data warehouse solutions as well as traditional data sources.
Being cloud native gives QuickSight the advantage (as well as other SaaS or cloud-hosted BI and analytic solutions ) of being able to scale out without requiring manual provisioning of resources. It offers an intuitive interface for performing data analysis and creating data visualizations and dashboards. AWS QuickSight uses an in-memory engine called Super-fast, Parallel, In-memory Calculation Engine (SPICE)—much like a cache—for quicker data retrieval for visualization in memory.
To learn more about AWS QuickSight, visit https://aws.amazon.com/quicksight/.
Stata
Stata is an integrated package of statistical software that offers everything users need for visualization, data analysis, and data management. It is mostly used in the biomedicine, economics, and political science industry sectors, primarily to investigate patterns of data. Stata offers a graphical user interface (GUI) and can be used from a command-line interface (CLI).
To learn more about Stata, visit https://www.stata.com/.
Minitab
Minitab is statistical software that is primarily used for empowering statistics and visualizing outcomes. It is commonly used in universities and for statistical analysis.
Fun Fact
Almost all major universities around the globe subscribe to Minitab. If you are a university student, it is worthwhile to see if you can get a free student copy of Minitab from your university website. Using Minitab can help you could learn business process improvement via data analysis.
Visit https://www.minitab.com/en-us/ for more information about Minitab.
What Next?
If you want more practice on this chapter’s exam objective before you move on, remember that you can access all of the Cram Quiz questions on the Pearson Test Prep software online. You can also create a custom exam by objective with the Online Practice Test. Note any objective you struggle with and go to that objective’s material in this chapter.