Chapter 11
Exploring Data Analysis and Key Analysis Techniques
This chapter covers Objective 3.3 (Summarize types of analysis and key analysis techniques) of the CompTIA Data+ exam and includes the following topics:
 Process to determine type of analysis
- Type of analysis
For more information on the official CompTIA Data+ exam topics, see the Introduction.
This chapter covers topics related to data analysis techniques. It is important to explore the processes used to determine the appropriate type of analysis. This chapter also focuses on reviewing and refining business questions, determining data needs and sources to perform analysis, and scoping/gap analysis. It covers the key aspects of types of analysis, including trend analysis (comparing data over time), performance analysis (tracking measurements against defined goals), exploratory data analysis (basic projections for achieving goals), use of descriptive statistics in determining observations, and link analysis (connections of pathway or data points).
Process to Determine Type of Analysis
Data analysis plays an important role in running a successful business. When data is adopted efficiently, it helps an organization understand its previous performance and make good decisions for future needs. Analysis of data is a process of transforming, cleaning, and modeling data in order to discover the information needed to make better decisions related to the business.
For example, when you want to make a decision in your daily life, you would probably base your decision on what occurred during a past time. You would analyze your past decisions and the outcomes of those decisions, and based on that information, you would make a decision now and in future, expecting a favorable outcome. For example, when buying a loaf of bread, if your experience with a brand has been positive, you would likely prefer that brand over other brands. Likewise, data analysts perform data analysis to help in making business decisions that lead to growth and expansion of the business through acquiring more customers or expanding the service/product footprint.
Determining Data Needs
It is important to understand the basics of data analysis and why an organization would invest in the process of analyzing data. The data analysis process involves collecting data by using an appropriate tool or an application that permits exploration of the data as well as possibly identifying trends or patterns in the data. With the help of such information, conscious decisions can be made.
Data analysis involves the following phases or steps:
Requirements gathering for data: It is a good idea to consider the need to perform data analysis and the outcomes that may be achieved by analyzing the data collected. That is, it is a good idea to identify the reason for performing data analysis. During the requirements gathering phase, also known as the preparation phase, you need to decide what to examine, the data structure, and the volume of data. In addition, it is important to understand what/why you are examining and what evaluation methodologies you expect to leverage to perform your analysis.
Collection of data: Once you have an understanding of what you need to evaluate and what the outcomes/results will be, the next phase is data collection. As data is collected, it needs to be organized or processed for analysis. Because data might be collected from multiple sources, it is a good practice to keep a log of data sources and collection dates/times.
Cleansing of data: Any kind of data gathered for analysis purposes has to be cleaned so there is minimal noise, redundancy, and duplication in the data and so pertinent information can be extracted as a result of analysis. Data gathered may include white spaces, duplicate records, and errors. Data should ideally be error free and cleansed. The cleansing phase is completed prior to the analysis phase because, after cleansing the data, the results of analysis will be closer to the expected results.
Note
Noise in the context of data refers to unwanted data.
Analysis of data: After data is gathered, processed, and cleansed, it is ready for analysis. As you analyze/manipulate data, you can identify whether you have all the data required for successful analysis and outcomes or whether you need to gather more data for effective decision making. At this stage, the tools and software for data analysis help you interpret, understand, and make conclusions based on well-defined needs.
Interpretation of data: After data is analyzed, results have to be interpreted. Data interpretation involves assigning meaning to data such that it can be leveraged for driving/discussing outcomes. Interpretation can be done leveraging the qualitative or quantitative methods.
Visualization of data: It is common to leverage visualizations to show the analysis and conclusions in the form of graphs and charts. Illustrating data graphically helps make it easy to understand and process. Visualizations may be used for discovering unknown trends and facts. By comparing datasets and relationships, you can identify a way to discover meaningful outcomes. The most common way to visualize data is via reports and dashboards. Reports can be in simple English or may include charts or tables for brevity.
Review/Refine Business Questions
In order to transform data into business insights and drive decisions, it is important to prepare and follow a set of questions that provides a direction for the analysis performed. These questions will form the basis from which you would acquire answers prior to starting the process of data gathering. These questions can be based on an organization’s goals, strategy, budget, addressable market, and target clientele. Some of the questions to be reviewed are as follows:
 What is the problem we are trying to solve or outcome we are trying to achieve?
- Who is the sponsor for this activity?
- What are the resources (people, time, budget) that we should think about?
- What are the different sources from which pertinent data can be collected?
- How can we assure quality of data?
- Which techniques can possibly be applied for data analysis?
- What end users or stakeholders might benefit from the analysis?
- What type of visualizations might help articulate the findings effectively?
- What type of software would help with collection, analysis, and visualization?
- Are there other things we should consider to ensure that the outcomes are in line with the business goals?
- What are the standard/key performance indicators that may define success criteria?
Data Collection Sources
At the heart of data analysis is data collection. Data may be well organized (for example, in SQL tables) or unorganized (for example, in figures or files), and it may consist of facts.
Broadly, there are two types of data: statistical and nonstatistical data. Statistical sources include official surveys and the census. Nonstatistical sources include administrative records, particularly in the private sector. Additional data sources are categorized on the basis of the methods for collection:
- Primary or secondary
- Internal or external sources
Figure 11.1 illustrates sources for collection of data, which include the following:

Figure 11.1 Data Collection Sources
- Primary data sources: Data collected firsthand from a researcher or surveyor is known as primary data. This kind of data is gathered for the first time and may be from internal or external sources.
- Secondary data sources: Data that was previously gathered, processed, published, or analyzed is known as secondary data. This data may be gathered from internal or external sources by investigators, researchers, or surveyors for carrying out statistical analysis and may be referred to as secondhand data.
- Internal data sources: Internal data sources, as the name suggests, are internal to an organization (for example, archives, records, and other sources within the organization). The organization (in most cases) has direct control over these data sources.
- External data sources: External data sources are outside the organization, sometimes also referred to as public sources (for example, census data). The organization may not have direct control over or access to them.
Gap Analysis
A gap analysis is typically performed to compare the current state to a future state, and an action plan is created to get from the current state to the desired state. Organizations perform gap analysis to enhance their competence and competitive advantage in terms of their products, services, or processes. Gap analysis enables business leaders to make conscious decisions to optimize the ways in which money, human, and time resources are spent.
Note
Gap analysis is also known as need analysis or need-gap analysis.
Gap analysis yields insights into the following aspects:
- Current/present state
- Desired/future state
- What needs to be done (action plan) to bridge the gap
These aspects can be leveraged to drive performance improvements. Figure 11.2 illustrates the basics of gap analysis.

Figure 11.2 Gap Analysis
As Figure 11.2 illustrates, the gap separates the present or current condition/state from the desired or future condition/state. In this example, an organization wishes to bridge the gap between the current state of $1 million in sales year on year (YoY) and the desired state of $6 million in sales YoY by the end of the next 2 years.
Gap analysis can assist in identifying specific areas for enhancement, whether related to optimization of the workforce, efficiency, strategy, or performance.
The following steps are involved in gap analysis:
Understand or determine the current or present state.
Determine the future or desired state.
Understand the gap between the current/present state and the future/desired state.
Implement a plan of action or required steps (also known as remedies) to reduce or eliminate the gap and improve performance, productivity, efficiency, and so on.
Several types of gaps exist, and how they are analyzed differs:
- Strategy or performance gap: This type of gap is analyzed in terms of actual performance vs. expected performance.
- Market or product gap: This type of gap is analyzed in terms of actual sales vs. budgeted sales for a product or service. It may also be analyzed from a competitive perspective to improve a product/service to compete and increase its market share.
- Manpower gap: This type of gap is analyzed based on the actual number of work hours vs. a projected number of work hours.
- Profit gap: This type of gap is analyzed in terms of actual profit vs. target profit.
The gap analysis involves the following steps:
Determine what data to analyze.
Identify the methods to use to assess the present state.
Identify the future state and create an action plan to move from the current state to the future state.
Record the attributes that may influence the success or failure from a gap perspective.
Let’s consider an example of improving sales figures for a product that your organization wishes to release a new version of. In this scenario, you would need to use gap analysis and develop a plan of action (or action plan).
The current state is the number of products being sold, and the data sources that can be taken into consideration to carry out gap analysis are the historical and current sales figures as well as customer feedback. This information acts as a baseline for the future state or the number of products your organization would like to sell. Based on current sales numbers, you can get an idea of the gap between what is currently being done (for example, sales training, product enhancements, market demand) and create a plan to attain the future-state sales numbers. You should document this plan and ensure that all attributes that influence sales (such as training, market demand, and product features) are communicated effectively within the organization.
Types of Analysis
A number of analysis techniques can be leveraged—including text analysis, statistical analysis, predictive analysis, diagnostic analysis, and prescriptive analysis—and the ones chosen depend on the business needs.
ExamAlert
CompTIA Data+ exam will focus on different analysis techniques.
This list gives you a better understanding of these techniques so that you can better learn the intricacies of trend analysis, performance analysis, and exploratory analysis:
- Text analysis: Text analysis, also known as text mining, involves identifying patterns in large sets of data with the help of data mining tools. The core purposes of text analysis are to enable extraction and examination of data as well as drive data interpretation and patterns. It is primarily adopted for transforming raw data into business-pertinent information.
- Statistical analysis: Statistical analysis offers insights into the trends and patterns in the data by leveraging existing information and by examining data samples or datasets. It encompasses interpretation, analysis, collection, data modeling, and presentation. Statistical analysis is categorized into two types: inferential analysis and descriptive analysis. These methods are covered in Chapter 10, “Understanding Descriptive and Inferential Statistical Methods.”
- Diagnostic analysis: This type of analysis explains why something happened by determining the root causes, based on insights identified in statistical analysis. Diagnostic analysis is helpful for identifying behavioral patterns. For example, if a new issue is noticed in the business process, you can observe and use diagnostic analysis to find answers to problems with similar patterns. For example, an organization can leverage diagnostic analysis to understand why its marketing campaign was not as effective as expected.
- Predictive analysis: This type of analysis explores what will happen, based on available information from the past. For example, predictive analysis can be used to forecast future results on the basis of past or current data. A very common example of predictive analysis is the use of existing information to forecast weather patterns up to a month in advance. These analyses provide the best possible approximations, given data on atmospheric pressure, sun, rain, and other factors, and more often than not, the weather forecast on your smartphone is very close to the weather you actually experience.
- Prescriptive analysis: Prescriptive analysis describes how something will happen and integrates perceptions from prior analysis to determine which actions can be taken for a current decision or problem. Most organizations adopt prescriptive analysis for analyzing data based on current problems and in certain circumstances to make decisions in the future. For example, an organization might leverage past data and prescribe the way its platform should be used by customers to drive better profits.
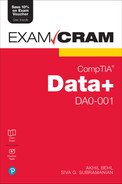
Trend Analysis
Trend analysis is the process of gathering information from diverse periods (via time series data analysis) to drive insights about trends or patterns. Trend analysis is based on comparisons of data over specific time periods in order to spot patterns or trends.
Note
Time series analysis, or trend analysis, is typically plotted with information on the X-axis, or horizontal line, for review.
In a business context, trend analysis can be leveraged for a number of purposes:
- Facilitating comparison: Based on market trend data, analysts can compare two or more organizations in terms of their sales performance.
- Investment analysis: Analysts can conduct a comparative study of the financial performance of an organization over a period of time.
- Cost and revenue analysis: Analysts can measure the profitability of an organization over a period of time.
Figure 11.3 gives an overview of trend analysis in which the analyst studies trends of sales of a product over different periods to determine future demand.
Trend analysis is used across industries, typically to ensure that an organization stays ahead of competition by understanding consumer buying and spending trends as well as trends related to products and features.
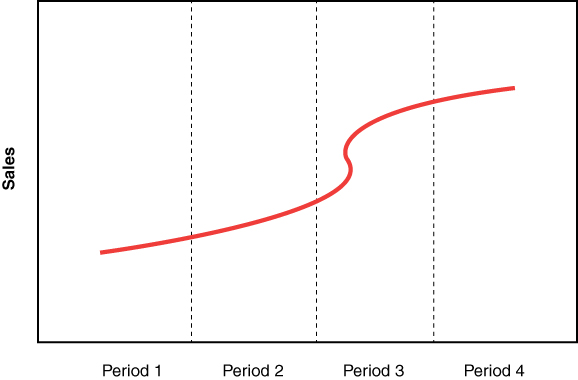
Figure 11.3 Trend Analysis for Sales of a Product over Different Periods
Comparison of Data over Time
Often organizations have to compare data over different time periods to understand what happened, what is happening, and what may happen. There are four basic factors involved in analyzing data that can assist in transforming raw numbers into information:
- Relationship: Relationship indicates the connection or correlation of two or more variables and their properties. It shows how the data does or does not influence other variables, negatively or positively. For example, with increasing age in a young human being, height also increases. Age and height are two variables that are related.
Figure 11.4 gives an overview of the relationship factor.
Charts and graphs typically adopted for illustrating relationship include:
- Table charts
- Line charts
- Bubble charts
- Scatter plots

Figure 11.4 Data Relationship Between Height and Age
- Composition: Composition refers to how one or more variables can be integrated to offer better insights. It is used for showing how a total value can be categorized into parts or focus on the importance of every part within the total value. For example, with food items, the amounts of sugars, grains, and other elements constitute the composition.
Composition can be depicted by using the following:
- Waterfall charts
- Stacked area charts
- Donut or pie charts
- Columns or stacked bar charts
Figure 11.5 illustrates composition of data.
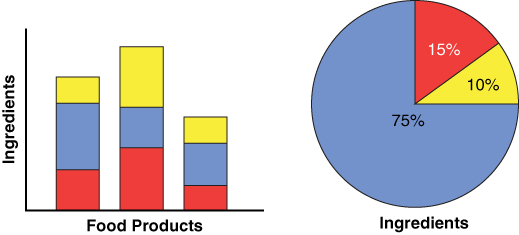
Figure 11.5 Composition Leveraging Stacked Bars and Pie Charts
- Comparison: Comparison is used for evaluating and comparing values between two or more variables or data points. Comparison makes it possible to identify the highest and lowest values in a chart. For example, a comparison of revenue for one or more products across different countries gives insights into sales performance.
The types of charts/graphs used to compare data points include:
- Bar charts
- Column charts
- Timeline or line charts
Figure 11.6 provides an overview of data comparison:
Figure 11.6 Comparison Leveraging Bar Charts
- The annual salaries of scientists and of engineers using a bar chart
- Distribution: Distribution integrates the functionality and merits of both composition and comparison. It assists in viewing the complete spectrum of a variable or data point and seeing related or unrelated data points. With the help of distribution, you can observe shapes, patterns, averages, correlations, outliers, and clusters.
Charts/graphs adopted for distribution include:
- Map charts
- Data tables
- Area and line charts
- Bar and column histogram charts
- Scatter plots
Distribution is illustrated in Figure 11.7, using data about the heights of students in a class as a histogram.

Figure 11.7 Distribution Illustration Using a Histogram
Performance Analysis
Performance analysis involves studying or comparing the performance of a particular activity or process in order to identify strengths and weaknesses. Performance analysis from a human resources point of view can assist in reviewing the contribution of employees toward a given assignment. It could be used to analyze business performance or sports performance, for example. In either case, an individual’s performance is analyzed, and their strengths and weaknesses are noted to improve performance (in terms of sales or race times) in the near or far future.
Performance analysis can be used to improve profitability, increase employee engagement by ensuring that employees’ efforts are valued and rewarded, and set a baseline to drive performance measurements across organizations.
Tracking Measurements Against Defined Goals
Goals measure how we meet the target objectives pertinent to activities we set out to do. In the context of data analysis and measuring success, goals are the main element of a digital analytics plan. But how are goals related to performance? Well, they might not be directly related; however, in order to measure performance, you need to track relevant metrics, or key performance indicators (KPIs). KPIs are tangible and measurable values and show progress toward goals.
Now let’s put all these pieces together. Say, for example, that an organization wants to increase its sales as well as increase the revenue per employee. In this case, the right KPIs need to be selected; these KPIs need to be relevant to the organization and must be measurable and provide outcomes to achieve the stated goals. Then the goals of increasing sales and revenue should be measured and tracked against these KPIs. The KPIs could be:
- Operating margin
- Net profit margin
- Total cost of operations
Note
Setting KPIs and goals involves setting up milestones, timelines, and more, but these topics are beyond the scope of the CompTIA Data+ exam.
Basic Projections to Achieve Goals
Projections to achieve goals are made in order to observe what the results will be if the present state of a program proceeds as usual and no modifications are made to the program. There are a few ways of making projections, including:
- Looking at a trend line and expanding it forward
- Adjusting for a number of internally and externally influenced factors
Exploratory Data Analysis
Data scientists and statisticians use exploratory data analysis for analyzing and investigating sets of data and summarizing their major characteristics. In the process, they leverage various methods of data visualization. In a nutshell, this type of data analysis allows data scientists and statisticians to uncover patterns as well as insights, often with the aid of visual methods. It also assists in testing a hypothesis, spotting anomalies, and checking assumptions. Some of the key aspects of exploratory analysis can be categorized based on the outcomes expected, such as:
- Hypothesis: What patterns are emerging, and how can I explain them?
- Graphs and charts: What can I see here?
- Grouping (or ungrouping) data: How can the data be sliced and diced as well as clustered?
- Model building: What patterns/trends/shapes can be observed, and why?
Use of Descriptive Statistics to Determine Observations
Descriptive statistics involves describing the characteristics of a dataset or sample data and often leverages graphical methods to illustrate data characteristics. Descriptive statistics is usually used for the following purposes:
- To offer characteristics of the variables in a dataset
- To highlight the potential relationships between two or more variables
The most common measures of descriptive statistics are central tendency, dispersion, and frequency, which are discussed in Chapter 10. Additional methods are shown in Figure 11.8.

Figure 11.8 Descriptive Statistics Methods
Descriptive analysis methods can be described or depicted using:
- Measures of position: A measure of position makes it possible to determine the position of a particular data value within a given dataset. Common measures include standard scores, quartiles, and percentiles.
- Contingency tables: These tables describe relationships between two or more categorical values in a tabular matrix arrangement.
- Scatter plots: Also known as scatter charts, scatter plots illustrate relationships between two values across X- and Y-axis plots.
- Histograms: A histogram is used to graphically illustrate the distribution of numeric values as a series of bars.
- Sociograms: A sociogram is a graphic representation for finding relationships within a group of people.
Advantages of adopting descriptive statistics are as follows:
- It provides a high level of neutrality and objectivity.
- It provides a wide representation of an event leveraging the variable characteristics.
Link Analysis
Link analysis is a data mining mechanism that can help structure data as a network of unified nodes and links for identifying and analyzing connections and relationships. Link analysis allows analysts to identify connections and association patterns within the nodes and links of a network. Examples of link analysis are semantic networks and social networks.
Link analysis considers the following key aspects:
- Network: This is a unified body consisting of interconnected nodes and links.
- Node: This is a point that represents a real-world object, such as a person or place.
- Link: This shows the relationship or connection between nodes.
Note
Each node and link may have properties that further define the relationship.
For example, a crime investigator would use clues and evidence to set up a network of suspects and link them to the victim via their relationships, as shown in Figure 11.9. As you can see, for each object/node, there is additional information.

Figure 11.9 A Sample Crime Link Analysis
Link analysis can be useful for:
- Analytical applications that leverage network graphs for drawing conclusions
- Assessing the influence of individuals in a social network
- Process or path optimization (such as an airline carrier optimizing flight routes for better fuel efficiency)
Connection of Data Points or Pathway
When conducting link analysis, illustrating data with a visual (such as a network graph) requires unraveling the data into individual displays or data points. For example, data on media influencers can be presented in graphs that become unintelligible displays of lines and numbers showing followers and subscribers. It is best to create visualizations that easily represent the association of data points that establish correct associations/relationships and make the network graph usable. Moreover, the pathways created to each node can be meaningful if there’s context around why a data point was chosen to create a relationship to a node.
Essentially, the main benefits of a visualization using link analysis data points and pathways are helping determine who the key contacts are, how often they are in contact and for how long, and their long- or short-term relationships.
What Next?
If you want more practice on this chapter’s exam objective before you move on, remember that you can access all of the Cram Quiz questions on the Pearson Test Prep software online. You can also create a custom exam by objective with the Online Practice Test. Note any objective you struggle with and go to that objective’s material in this chapter.