Chapter 16
Applying Data Quality Control
This chapter covers Objective 5.2 (Given a scenario, apply data quality control concepts) and includes the following topics:
 Circumstances to check for quality
- Automated validation
- Data quality dimensions
- Data quality rules and metrics
- Methods to validate quality
For more information on the official CompTIA Data+ exam topics, see the Introduction.
This chapter starts by examining data quality dimensions such as accuracy, coverage, consistency, timeliness, and completeness, as well as circumstances to check for quality, including data acquisition, data transformation, conversion, data manipulation, and final product. Next, this chapter focuses on automated validation, which depends on data type validation and number of data points. This chapter also discusses rules and metrics to be followed in data quality. Finally, this chapter looks at various methodologies for validating data quality, including cross-validation, data auditing, data profiling, spot checking, and ensuring reasonable expectations.
Data Quality Dimensions and Circumstances to Check for Quality
When you are making a business decision, it needs to be based on facts. If the facts are not right, the decision is not likely to be right either. This is why the quality of information to make an informed decision matters—and data quality is what this chapter is about.
To ensure that good-quality data is available for organizational stakeholders to make the right decisions at the right times, multiple factors need to be considered to ensure that the quality is acceptable. This focus on quality needs to begin when data is collected at the source, whether manually or automatically, and it needs to continue through transformation, manipulation, and display of data (as reports or dashboards, for example).
Data Quality
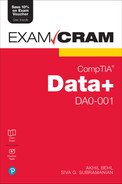
The quality of any dataset being leveraged for analysis and reporting can be measured across several key aspects:
 Data consistency
- Data accuracy
- Data completeness
- Data integrity and validity
- Data attribute limitations, including timing, retention, and range
Figure 16.1 illustrates these dimensions.
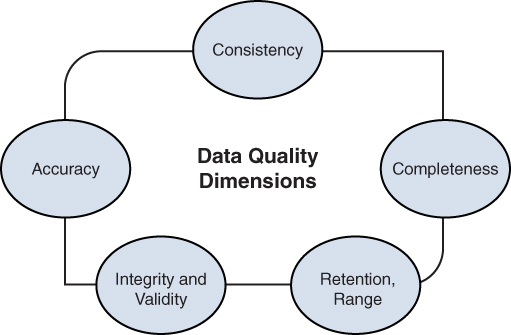
Figure 16.1 Data Quality Dimensions Overview
Let’s explore these aspects in detail to better understand how they are relevant to data quality.
Note
Concepts related to data quality—including consistency, accuracy, completeness, integrity, and validity—are discussed in the following sections in the context of customer details in an organization’s sales database.
Data Consistency
Data consistency refers to the ability to offer a consistent view of data across all users in an organization. Any transactions happening at any time need to be reflected across all the data views used by all consumers. For example, there can be multiple points of sale where customer information is captured and sellers are entering customer details across retail outlets. There are fields for name, sex, address, phone number, and email. While some of the fields are required, some are marked optional, and this may lead to the data being represented inconsistently, depending on the context. (See the section “Data Completeness,” later in this chapter, for more insight.) Hence, to have consistency across datasets, it is best to either omit the optional fields or have fields set to required.
Another issue is that some sellers may be entering sex as male/female or man/woman or N/A, and this also leads to data possibly being inconsistent in the fields; in this case, the fields can be better defined to allow only a couple of options.
Note
A concept related to data consistency is data quality at the source, which is covered later in this chapter.
Data consistency can also be affected by database distribution. Distributed databases are not necessarily always in sync because latency may occur, and geographically separated instances may not always be available due to maintenance. Read and write locks as well as caching can help with these issues.
ExamAlert
Data quality is an important topic, and you need to understand the various dimensions described in this section for the CompTIA Data+ exam.
Data Accuracy
Data accuracy refers to information being correct at the time it is used for analytics. Data accuracy can also refer to a correct description of a real-world value in the context of analytics. Let’s look at some examples to get a better idea of why accuracy is important.
When you go to a hospital, if your health records are inaccurate, the health analysis will not be accurate, and the doctor will not be able to prescribe the right medications for your ailment. As another example, if the sales numbers in a business are not accurate, the sales leaders will not be able to rely on past performance to gauge future performance.
Essentially, inaccurate data leads to inaccurate predictions or outcomes. In the world we live in, where data is an important currency, data accuracy is very important. So how do you ensure or improve data accuracy? Well, data accuracy can be improved by doing a number of checks, from the data acquisition phase to the transformation of data to reporting; data accuracy depends on the frequency of the checks.
Data Completeness
You learned about the various factors that can lead to data incompleteness and missing values in Chapter 6, “Cleansing and Profiling the Data.” Getting a complete and comprehensive dataset for analysis is an important aspect of data quality. Data completeness refers to the expected wholeness or comprehensiveness of a dataset. In other words, in the dataset, values that are required for insights are not missing or incomplete.
Does this mean that every field needs to be filled—even if it is optional? Think about a dataset where a customer record has multiple fields, and the customer’s first name and last name are required, but the middle name is optional. If this is a sales database outlining customer details, you can expect the middle name field to be filled only if a customer has one and provides it. In this context, the data is considered to be complete even if optional data is missing.
Data Integrity and Validity
Data integrity is a measure of the overall consistency, accuracy, and completeness of data stored in a database, data lake, or data warehouse over the life cycle of the data, from acquisition to insights. Data validity refers to the way the data is entered in the system to begin with—with the right inputs from the end users in terms of the data types and format expected.
For example, in a database that stores customer records, there should be a valid customer ID, with customer address, contact details (email address and phone number), and the products sold to the customer. When end users enter the right data in the right fields, the data is considered valid; if they don’t enter the right data in the right fields, the data is invalid at the source. Data validity is also an issue with automatic data updates based on rules or queries.
Now, as the volume of data grows over time, splitting datasets across various databases might be required for better query performance and to make the table size manageable; this is where the integrity aspect becomes important. The customer details should be referenced across databases correctly, with the customer ID linked to the right address and other details.
There are a number of steps you can take to ensure data integrity. When segregating data across datasets and databases, all views should be referenced and show the same information. In addition, the keys and constraints should enforce data integrity across all databases.
Data Attribute Limitations
Data attribute limitations can be defined for a data point’s retention and range, as well as the amount of time for which the data point remains usable. As you learned in Chapter 13, “Exploring the Different Types of Reports and Dashboards,” there are two major types of data attributes: qualitative and quantitative. Certain limitations can be placed on these attributes in terms of number of characters and range, as well as when the data is received for analytics. Moreover, thinking about when data is considered good vs. stale gives a good idea about the quality of data being considered, and this quality is reflected in the insights produced using the dataset.
For example, a dataset might have multiple data attributes, such as numeric values, nominal data, and binary data about a certain subject. Within the dataset, there can only be as many characters or digits as you allow, and each data type needs to be well defined. On the other hand, this information may belong to a personally identifiable information (PII) category, such as name, address, and sex, and this information cannot be stored indefinitely. PII information should be removed from records upon request from the person from which it was collected or as per the organization’s information retention policy.
Note
For more information on PII, refer to Chapter 15, “Data Governance Concepts: Ensuring a Baseline.”
Another important aspect is the timeliness of data, which comes up in expectations of when certain data should be available and when data should be updated. All of these aspects impact the data quality and insights that can be made based on the data, which will certainly be affected by outdated or inaccessible data.
Note
Keep in mind that it is not just data that can be impacted by any attribute limitations; metadata can also be impacted by such limitations.
Besides understanding the dimensions (also sometimes known as data quality metrics) discussed here, you need to know that quality data should be available to those who need it in a timely manner. This metric, referred to as data accessibility, is related to the ease of retrieving data.
Circumstances to Check for Quality
As discussed in the previous section, data quality matters when making decisions, and the data quality it depends on multiple dimensions. There are ways to maintain data quality, and some of them can be deployed during data collection, whereas others are better used during the life cycle of data insights.
Note
A good-quality dataset can be more than just an asset; it can be used extensively to positively impact marketing campaigns, optimize operations, optimize business processes, and more. A data steward can help manage data quality by analyzing the data quality, optimizing data operations processes, and leveraging the right data toolsets.
Figure 16.2 shows an overview of the data quality life cycle.

Figure 16.2 Data Quality Life Cycle Overview
Note
This figure shows only quality specifics and not details related to discovery, remediation, and other data life cycle processes.
Data Acquisition/Data Source
Most data dimensions can be maintained by leveraging data quality mechanisms at the source or where the data is being acquired. It is important to understand that a business problem or decision may require data from different sources to be used together, and the quality of data from these sources impacts the results. You can consider several factors to improve data quality at the source:
- Ensuring data completeness: If the data you need to make a business decision is not complete, it cannot be used for analysis. For example, to reach out to customers for an upcoming large sale, you would need their email and/or physical addresses. In a data source, while unnecessary data can be missing from a dataset and not impact the analysis (or query outcomes), if required data is missing, the data is considered incomplete and becomes unusable for analytics.
- Ensuring data consistency: Each source dataset needs to be logically consistent within itself and in line with its defined data model. Unless everyone interested in a dataset sees the same outputs, the data is not useful for decision making.
- Maintaining data lineage: It is always good for a data engineer to know where data has come from in terms of the source or acquisition as well as how it was transformed during the data life cycle, as the data transformations could potentially improve or reduce source data quality. (You’ll learn more about this in the next section.)
Note
It is always better to ensure that data being sourced is of suitable quality than to implement correction mechanisms later.
Data Transformation/Intrahops
When you hear the word transform, it usually refers to altering something from its current state to a future state with a few or many changes. It is very common for business processes and technology implementations (including data) to undergo transformation. Data transformation essentially means standardizing the structure, format, and values of the source datasets and creating consistency between the datasets before allowing them to be leveraged by data engineers/analysts for analysis. Transformation can be done by using extract, transform, and load (ETL) or extract, load, and transform (ELT) mechanisms, which are covered in Chapter 5, “Understanding Data Acquisition and Monetization.”
Following are some the advantages of performing data transformation:
- Data transformation validates and formats data and therefore enhances the quality of the data by removing duplicates and incompatible formats.
- Data transformation enables compatibility between disparate systems and/or applications in terms of data types.
- Data transformation makes it possible to reduce duplication and store a current single version of data rather than multiple versions.
Note
Data transformation is performed by using rules or lookup tables or by combining the data with other data in ETL or ELT processes.
Data quality is important as organizations gather enterprise data from multiple sources and systems. After data goes through a transformation and cleansing process, it can be used for multidimensional analysis to provide insights. Quality data = quality insights!
Data transformation can be broadly categorized as pass-through or conversion. When data transformation happens, not all data needs to be transformed; in some cases, data from a source is in a usable format and can be copied from source columns to destination columns. This is referred to as pass-through data. When data is subjected to transformation from one data type/format to another while moving from a source column to a destination column, it is referred to as conversion data.
Data transformations can be active or passive. In an active transformation, the number of rows is modified, whereas in a passive transformation, the data is changed at the row level, and the number of rows is not changed. For example, data masking (discussed in Chapter 15) is a passive data transformation mechanism, and data filtering is an active data transformation mechanism. Whereas data masking will not alter the number of rows, during the transformation process, the filtering condition may drop rows. This means that any active or passive transformation process doesn’t reduce the quality of datasets.
Data Manipulation
You learned about data reconciliation as well as data manipulation in Chapter 7, “Understanding and Executing Data Manipulation and Techniques.” Recall that data manipulation refers to the process or methodology of organizing data to make it more structured.
Data manipulation is required to make it easier for organizations to organize and analyze data. With regard to quality, data manipulation has the following advantages:
- Data manipulation helps maintain consistency across data gathered from diverse sources, giving a unified view that helps organizations drive meaningful decision making.
- Data manipulation makes it possible to cleanse and organize data by focusing on important fields and data types, improving data completeness.
- Data manipulation helps remove unwanted data and keep information that matters, thereby improving data accuracy.
Final Product, Reports, and Dashboards
There’s a very famous concept in computing—garbage in, garbage out (GIGO)—which means that the quality of output or information is determined by the quality of input or data. GIGO applies to data as well as other areas of computing: If the inputs are not meaningful, the reports and dashboards based on them are also not going to be very useful. It is important to maintain data quality throughout the data life cycle.
An organization can derive meaningful outcomes based on meaningful inputs, and maintaining and ensuring data quality leads to good reports and usable dashboards.
There is another dimension to look at when it comes to data quality dashboards. Some applications help ascertain data quality and can also help you focus on the various data quality dimensions. You can use tools such as Qlik Sense, Tableau, and Power BI with different business rules and KPIs to measure the data quality by checking for data completeness, data accuracy, data consistency, data integrity, and more. Figure 16.3 shows a sample data quality dashboard in Tableau (taken from https://tabsoft.co/3sTaYf0).

Figure 16.3 Data Quality Dashboard in Tableau
You don’t have to guess about data quality because modern BI tools give analysts several opportunities to examine data for completeness. Some dashboard graphs, for example, might show gaps where data is missing or incomplete.
Note
Data quality management is a recursive process and needs to be repeated again and again to ensure that quality data is available for usable insights.
Data Quality Rules and Metrics, Methods to Validate Quality, and Automated Validation
In this chapter we have already discussed the various data quality metrics and how they are important to ensuring the quality of data available for driving meaningful decisions. This section explores the various rules that can be used to check quality against these metrics and various methods for validating the quality of data being used for analytics.
Data Quality Rules and Metrics
Before we get into data quality rules, let’s talk a little bit about data profiling. Data profiling can be leveraged for analysis and assessment of the quality of data values within a dataset. It also helps in finding relationships between datasets. Why is this important? It all starts with finding a baseline in one or more datasets in terms of data quality issues.
Note
Data profiling is based on algorithms, and performing data profiling can yield insights about various data rules associated with datasets.
By using data profiling, you can create data quality rules that are required to perform ongoing inspection of data values across datasets. Data quality rules are guides that allow data engineers and data analysts to determine whether the data being considered for analytics is fit for the desired purpose. These rules specify what is considered good in data quality. Data quality rules can focus on data detection, data validation, or data correction. These rules can be broadly classified as business rules and physical data store rules. Table 16.1 shows some examples of business rules.
TABLE 16.1 Business Rules for Customer Data Collection
Business Rule | Quality Dimension | Rule | Data Field |
|---|---|---|---|
Email Format | Accuracy | Check for the email format <[email protected]> | Email_ID |
Phone Number | Completeness | Check for the phone number format <country code><area code><number> | Phone_Number |
Validation rules, on the other hand can be used to validate values, data ranges, and data types as well as to distinguish between mandatory and optional fields. Figure 16.4 shows the validation rules available in Microsoft Excel.

Figure 16.4 Excel Data Validation Rules
The following sections cover several topics related to data validation: conformity, non-conformity, rows passed, and rows failed.
Conformity and Non-conformity
Data conformity measures the alignment of data types and format with defined standards. These might be industry standards or internal standards set by an organization. In simpler terms, data conformity refers to the amount of data stored in a standard format in an organization.
ExamAlert
Data conformity is a key topic and CompTIA Data+ exam may test you on this topic.
Let’s consider an example. At a product sales organization, the customer records are maintained and updated regularly by various departments. These departments may use different data stores, and the formatting and data types across these records may therefore be different. Table 6-2 and Table 6-3 show the different records and the conformity across these records.
TABLE 16.2 Marketing Dataset
Customer ID | Customer Name | Customer Address | Product Renewal Date | Product Value | Marketing Email Subscription |
|---|---|---|---|---|---|
C101 | Marteen Huges | 67 Brooklyn St, Brooklyn | MAY/10/27 | $1300 | Yes |
C103 | Cheryl Vantage | 85 Kites St, Kites | SEP/30/27 | $1900 | Yes |
TABLE 16.3 Sales Dataset
Customer ID | Customer Name | Customer Address | Product Renewal Date | Product Value | Potential New Leads |
|---|---|---|---|---|---|
C101 | Marteen Huges | 67 Brooklyn St, Brooklyn | 05/10/2027 | USD 1,300.00 | Yes |
C103 | Cheryl Vantage | 85 Kites St, Kites | 09/30/2027 | USD 1,900.00 | Yes |
If you compare the sales table (Table 16.3) to the marketing table (Table 16.2), you can see that the formatting of renewal dates is different, and so are the data types used for the product value field. To ensure conformity across these tables for these specific fields, you could develop business rules and validation rules such that the renewal date is set to the format MM/DD/YYYY, and the product value is a numeric value.
What about non-conformity? Non-conforming data refers to dataset elements where values are missing, inconsistent, or incomplete compared to values in related or comparable datasets.
For example, a non-conforming product that fails to meet one or many requirements such as specified requirements, customer expectations, or usage requirements would not be fit for its intended purpose. Similarly, any data that is non-conforming to expectations would be less than useful for analytics. Again, leveraging Tables 16.2 and 16.3, if the customer names have not been captured properly or if their contact details are not complete, the marketing team would not be able to personalize a marketing message, and sales could not follow up regarding an existing or new requirement. Now you can see the effect of data non-conformity in the context of real-world applications.
Before we jump into the next section, there’s a term that you should be aware of: data veracity. Data veracity refers to the quality of data in terms of conformity to data dimensions such as accuracy and completeness.
Rows Passed and Rows Failed
As you learned in the previous section, data conformity can be achieved by accessing data being entered via validation rules. (You’ll learn more details about validation in the next section.) As you have already seen, you can validate data being entered in databases by using record validation rules or field validation rules. Whereas a field validation rule focuses on a specific field within a dataset, a record validation rule checks for all relevant fields, depending on the query, in a table. The query can be set up to check for specific values, data type, data length, duplicate information, and referential integrity across rows in a database. A validation rule can also count the number of rows across the datasets, based on source or target-based row count. Thus validation rules lead to conformity of data.
Another key aspect to consider when looking at conformity of data is the way data quality rules operate. These rules may be based on metrics such as:
- Greater than or less than
- Equals or not equals
- Within range or outside range
- Null or contains
- Starts with or ends with
- Valid
- Unique
- Match
Columns and/or rows can be matched based on the field content (such as ranges or values). Based on a rule, a row may be declared fit for insertion in the target data store and use in analytics.
Let’s consider an example in which a number of rules are applied to transformed data to ensure that the data that will be used for analytics will be validated for errors. Say that an organization has a customer database that is extracted as an Excel sheet and put through an ETL tool. As shown in Figure 16.5, there are 200 rows and 20 columns; all the rows are being validated for missing email addresses, missing customer IDs, and products with quantities less than 1. In this case, metrics such as “is null” can be used for email and customer ID, and “less than” can be used for number of products.
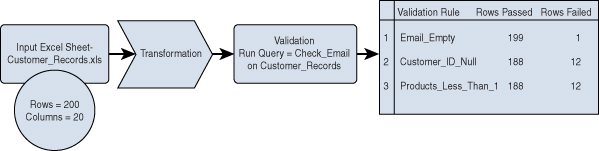
Figure 16.5 Validation Rules for Data Across Rows in a Customer Dataset
Based on how many rows passed vs. failed, the database administrator or a data engineer can fix the rows with missing data before the information is processed.
Methods to Validate Data Quality and Automated Validation
As important as it is to have the right data for analytics in order to come out with the right results, it is equally important to ensure that the data is validated before it is used for insights. Data validation is significant as it ensures that data is clean and complete and, therefore, meaningful.
If, for example, there are hundreds of sources of live events or static data, it would not make sense to cleanse data after processing without validation just before running any analysis. It would, however, make sense to validate the data by leveraging the various methods or algorithms nearest to the source and only process intelligible data before you try to run any analysis. This section discusses these methods.
Data Profiling
We started to talk about data profiling earlier in this chapter. Let’s now take a deeper dive.
Note
Think of data profiling as a prescribed method of examining datasets to determine if there are any quality issues in the metadata and/or data being used.
The key purpose of data profiling is to discover any discrepancies, imprecisions, and missing data so that the data engineers can correct the data before it leads to incorrect outcomes. Data profiling enables data engineers to get a representation of the structure of the data, any validation rules that may apply to the data, data types, data field lengths, cross-file and cross-column data relationships, and more.
Data profiling provides a better understanding of the quality of datasets in terms of structure and interrelationships, and it leads to the creation of data quality rules pertinent to the business outcomes and insights required.
Note
Remember that business requirements drive the metrics that are required for quality data.
Let’s consider an example. Say that there are two major divisions in your organization that drive sales activities: sales and marketing. Following are the business objectives for these divisions:
Marketing: The business objective of the marketing division is advertising new products/services. The following data is required:
- Customer name
- Profile/title
- Company name
- Email address
- Mailing address
- Phone/mobile number
- Past products or services sold
Insights include:
- Subscription to marketing updates
- Possibility of event attendance
Sales: The business objectives of the sales division are finding new leads and identifying new opportunities. The following data is required:
- Customer name
- Profile/title
- Company name
- Email address
- Mailing address
- Phone/mobile number
- Past products or services sold
- Annual revenue
- Industry
- Number of employees
- Lead/opportunity source
- Next steps
Insights include:
- Possibility of closure of product or service sales
- Possibility of cross-selling/upselling
This list qualifies the business requirements and the objectives as well as the insights. To move ahead, you would need to qualify the data quality metrics (for example, completeness, accuracy, consistency, validity, timeliness). To do so, you create data rules (both business and validation rules) to ensure that you get the complete datasets needed for analysis and ensure that the data profiling is performed based on these rules.
At a high level, it is good to understand that data profiling can be broadly categorized as relationship discovery (that is, exploring relationships between datasets) and structure discovery (that is, ensuring the formatting, data types, and fields across datasets).
Cross-Validation
Cross-validation is a popular validation method pertinent to training machine learning models. Cross-validation is based on splitting data into training and test sets. The whole idea is to partition a given dataset into several subsets. While one of them acts as a test set, the others are training sets. Whereas a training set is data used to construct a model, a test set is data used for validation of the model being created.
Note
Data engineers use a K designation for each split (for example, K1, K2, K3, K4) also in a form of validation known as K-fold cross-validation (see Figure 16.6).

Figure 16.6 Cross-Validation Data Split Across Multiple Sets
Now, with the splits across K1 through K4, you can train the data model on the first fold starting with K1, and then you can proceed to the second fold and so on. Each iteration yields an accuracy score, so in this case, you would be getting four accuracy scores.
Sample/Spot Check
Data validation need not be always structured. You can in some cases just pick a random sample and check it for any errors. For example, you might pick up a dataset and run a null validation against rows 110 through 130.
Fun Fact
At schools, teachers may ask toddlers to show their hands and check whether the students’ fingernails are overgrown. Data samples/spot checks are not very different.
Sampling or spot checking does not guarantee an error-free outcome as it does not involve checking against all queries and all data fields. However, you can use these methods on data that has high confidence in terms of the data quality—that is, when other validation methods have already been used on the data. In addition, if you cannot check everything due to time or other constraints, then spot checking can be a good option. In fact, it is possible to leverage BI solutions as shown in Figure 16.3 to perform sample checks on data.
Data Audits and Reasonable Expectations
The term audit can mean different things to different people. IT folks might think of IT asset management audits, compliance teams might think of compliance audits, and data people might think of data quality audits. A data quality audit is a process of ensuring that the data quality is above an established baseline and meets an acceptable standard. Ongoing data quality audits help maintain the data quality standards and also ensure that more time-consuming corrections are not performed; for example, these audits ensure that data metrics such as data completeness, accuracy, and consistency are maintained by deploying the right tools during the ETL or ELT processes.
A data quality audit includes a number of checks, including:
- Data source verification
- Data formatting checks
- Data type checks
- Data profiling rule checks
- Data report/dashboard checks
The outcomes from data audits are reports that highlight the non-conformities across various metrics/dimensions.
Data quality expectations can be qualified when working with data stewards as well as business stakeholders. These expectations guide what should be measured and indicate the impact of these measurements on decisions. For example, data quality expectations may be very high for sales stakeholders as they are driving front-end sales with customers—and any unusable insights may be quite frustrating for them. A customer’s incomplete details for the last orders placed can be very challenging for a salesperson as he cannot go to the customer and ask what products they have; the customer would expect the salesperson to know this. This example shows again that data completeness and accuracy matter.
Now let’s consider the data quality expectations of a marketing team. Unusable insights might not prevent the marketing team from operating successfully as it uses different KPIs and outcomes than the sales team. Even without information on what products a customer has, marketing can still engage the customer for an upcoming marketing event where a new product is being promoted.
So again, expectations for data quality depend on the person or group using the data. Particular expectations can be reasonably fulfilled by leveraging business rules to validate the data, as shown in Figure 16.7. Based on the rules, the variation from expectation can be measured by using a report or dashboard.
Figure 16.7 Expectations from Sales and Marketing for Customer Data
Automated Validation
We all love automation; you probably use some form of home automation, car automation, or coffee machine automation. Automation aims to make life simpler by taking care of repeatable tasks. Data quality validation automation can automate the task of running rules against datasets. With automated data quality validation, it becomes easier to automatically detect changes and thereby improve data quality over time.
There are two basic automated data validation types: data field-to-data type validation and number of data points validation. Data field-to-data type validation confirms that the data entered in a data field has the correct data type. For example, a birthday data field is designed to accept only numeric characters, and thus, the system should reject any data containing other characters such as letters or special symbols. Figure 16.8 shows how a simple rule can be created in Microsoft Excel to validate a data field as a date data type and to ensure that it cannot be left empty or contain any special symbols.
Microsoft Excel offers validation for several data types to restrict data fields or cells as needed:
- Whole number
- Decimal
- List
- Date
- Time
- Text length
- Custom

Figure 16.8 Data field-to-data type Validation in Excel
You can make and automate additional rules by using Excel macros and other tools. For data stores, SQL-based rules can be run on a regular schedule to ensure that the data being entered in the database or taken from an existing data source is validated in terms of the data types expected for various data fields.
You can consider data points to be measurements across a certain population. For example, when doing a study on volcanos, you might need to have data points for volcanic activity, temperature, and lava quantity. Unless you have multiple data points, you cannot make useful comparisons. However, you can have too many data points; you might not need more than a few data points to arrive at a statistical conclusion. Automated validation of the number of data points can be provisioned when the ideal number of data points for a certain activity is known and anything less than or more than the approximate ideal number would be considered unfit for analysis. In such a case, you might use rules including greater-than or less-than metrics.
What Next?
If you want more practice on this chapter’s exam objective before you move on, remember that you can access all of the Cram Quiz questions on the Pearson Test Prep software online. You can also create a custom exam by objective with the Online Practice Test. Note any objective you struggle with and go to that objective’s material in this chapter.