
Chapter 2
Analytical Tools for Competitive Intelligence: from Data Collection to Data Processing1
2.1. Introduction
Competitive intelligence (CI) emerged as a response to the upheavals caused by the global environment on our society. In an increasingly complex and fast-moving economy, companies must be able to develop new knowledge to maintain levels of innovation and gain a competitive advantage [OUB 05]. In addition to this, the use of information and communications technology (ITC) has introduced new constraints to which businesses must adapt to survive: a continuous flow of information, considerably faster circulation of information, and evermore complex techniques (it is more and more difficult to rapidly master new software) [COL 97]. There is a risk of “drowning” in this information, of losing the ability to distinguish between the essential and the superfluous. With the emergence of the new market-dominated economy, the industrial issues facing businesses have increased considerably in complexity. Now, to remain competitive, a business must be able to manage its intangible assets. CI is an approach and an organizational process that allows a company to be more competitive, through surveillance of the environment and of external changes alongside self-evaluation of internal changes.
In 2000, 6 years after the canonical definition put forward by Martre [MAR 94], the borders of the notion of CI were still unstable [SAL 00]. Over the last few years, more and more definitions of CI have emerged, with a perceptible shift from definitions based almost exclusively on CI processes and techniques toward definitions including the strategic aims of CI, and more recently toward definitions including notions of knowledge management, collective learning, or cooperation [SAL 00].
Our vision of CI is essentially strategic, an approach based on anticipation and forecasting [BES 96], which works by uncovering the links between actors in the same sector of activity. CI is based on individual and collective anticipation and on in-depth knowledge of the current environment and existing networks to act and react in relation to their development [BES 98], [REV 98], [LEV 01]. The coordination of actions, in the case of a common strategy, requires a strong capacity to seize on variations and environmental reactions each step of the way, to identify factors for change and account for these factors by suitable modifications [WIL 67], [LEV 96], [VAS 99], [GUI 03].
Table 2.1 presents a historical synthesis of the main themes in CI since 1961 [PAT 98]. It can be broken down into two tendencies: the core of the domain, which has been stable for over 15 years (including collection, processing, diffusion, interpretation, knowledge, coordination, decision making, and environment), and new, less consistent preoccupations, which have emerged in more recent years and essentially introduce the time factor (immediate, ulterior, continuous, anticipation, “right time”, etc.). The time factor is of increasing importance and should always be taken into account in any strategic analysis.
In the context of our approach, we will use the definition set out by Martre [MAR 94], who defined CI as a group of coordinated research, data processing, and information distribution activities that allow actions to be carried out and decisions to be made. This goes further than the partial actions involved in Documentation. Watch in different skills (scientific and technological, competitive, financial, judicial, territorial, and regulatory) invites us to “move from individual processing of information toward information management and a collective action process” [MAR 94].
From now on, our work will consist of defining a model for data processing and management in the context of the CI cycle, including relational and temporal dimensions. Thus, our multidimensional analytical model will be based on the following four main steps of the CI process [JUI 05]:
– formulation of need,
– data collection and processing,
– analysis,
– presentation and interpretation of results.
Table 2.1. Synthesis of main themes in CI: gray shades highlight described concepts by authors over the time
The main aim is the creation of new knowledge, often totally implicit and of strategic importance, which is most often found through the analysis of the development of networks of actors (authors, inventors, companies, towns, regions, countries, journals, etc.), semantic networks (keywords, free terms, multiterms, ontologies, etc.), and interactions (actor/semantics) [MAR 95].
2.2. Overview of the multidimensional analysis model
The proposed model may be described graphically, as shown in Figure 2.1.
Figure 2.1. Multidimensional analysis model

– Formulation of need: this element contains the interpretation and identification of the decision aim. It is defined by five objects: <Subject>, <Aim>, <Indicator>, <Actor>, and <Attribute>. These elements provide a detailed description of the problem or information need connected to the aim of the analysis. In the case of an information need, we may identify one or more subjects, and for each subject, we define one or more aims, indicators, and actors. We may also assign several attributes to each actor.
– Data collection and processing: this element contains the sources of data chosen for use in relation to the information requirement [GOT 92], [RED 94]. It is described by the <Body of source material>, <Body of processed material>, and <Multidimensional corpus>. The body (or corpus) of the source material may be taken from one or more data sources. The body of processed material is most often obtained after formatting, retagging, and homogenizing the source material.
– Analysis: this element contains <Dimension>, <Filter>, and <Semantic function>. When analyzing a multidimensional corpus, we define one or more semantic functions based on one or more dimensions. For each dimension, filters may be applied to the dimension’s attributes.
– Results: results are described by one or more <Visualization function> elements used for the visualization of each <Result>.
2.2.1. Information process
The main purpose of our model is the management and creation of knowledge in the context of a decision-making process. In this context, we will present the different steps of the information process supported by the model, from raw data to knowledge and the decision (see Figure 2.2).
Figure 2.2. Information process (based on [BOU 04])

– Raw data—useful information: the relationship between data and information consists of selecting potentially useful information for analysis from among existing raw data, leaving aside any superfluous data. The data are therefore considered the origin of the information. The selected data are transformed into useful information by a value-adding process that consists of structuring and memorizing it to facilitate access.
– Useful information—pre-knowledge: this relationship consists of analyzing useful information and identifying various dependencies between pieces of information. The representation of useful information in the form of “pre-knowledge” is based on the restructuring and analysis of information based on relationships.
– Pre-knowledge—knowledge: this step is based on the interpretation of “pre-knowledge” by the decision maker via a synthetic vision of the information environment in the context of the decision. This relationship, therefore, describes the passage from explicit knowledge1 (pre-knowledge) to implicit knowledge,2 which belongs to the world of mental objects (decision maker).
– Intelligence—decision: intelligence is an interaction between the decision maker’s personal knowledge and the knowledge deduced from “pre-knowledge” analysis, an interaction that can exercise influence on the decision maker in terms of the decision, that is, in terms of the choice among different possible solutions.
2.2.2. Process architecture
The process proposed for the implementation of our model can be presented following an architectural pattern over three levels (Figure 2.3):
– Sources and extraction: this level “feeds” the data stock from the available corpus of textual data. It allows us to pass from the initial representation of textual documents (qualitative data) to their synthetic form (quantitative data: occurrences, co-occurrences, etc.).
– Data warehouse: this is a storage space that provides both a unified view of the source corpus (documents) and a multidimensional representation of actors and concepts (relationships).
– Analysis and presentation: this level allows multidimensional analysis of the data taken from the warehouse and their presentation to the user using the reporting tools.
Figure 2.3. System architecture

2.3. Application of the multidimensional analysis model
We will present this analytical model using a study carried out on the domain of nanotechnology.
The field of nanoscience and nanotechnology represents a strategically important research sector, with high levels of competition and rapid growth. The domain has considerable economic potential in a number of domains, including computing and telecommunications, medicine and biology, materials, chemistry, energy and the environment.
Nanosciences and nanotechnology can be defined, in a basic manner, as the set of studies and processes involved in the fabrication and manipulation of structures, equipment, and material systems measured in terms of nanometers (nm). In this context, nanoscience is the study of phenomena and the manipulation of phenomena and materials on the atomic, molecular, and macromolecular scales, where physicochemical properties are significantly different from those observed at higher levels. Nanotechnology is the design, characterization, production, and application of structures, equipment, and systems by controlling forms on the nanometric scale.
Despite the relative simplicity and precision of these definitions, the terms “nanoscience” and “nanotechnologies” have several accepted meanings, linked to the transversal nature of this relatively new discipline.
These definitions refer to, and create new possibilities in domains such as optics, biology, mechanics, chemistry, and microtechnology.
The analysis that follows refers to a study of actors in the field of nanotechnologies. It is based on the results obtained by decision assistance tools, without going into the details with regard to their modes of operation.
Interested readers may refer to our research publications where the development and principles of these functions are covered in detail.
We will first consider the main actors in the domain, with the aim of identifying the key actors over the last 4 years. In the same way, we will investigate the existence of classes, their size, and, especially, their structure.
Next, we will identify those journals that are most characteristic of the domain. Finally, we will look at those countries where most work and collaboration in this domain are being carried out.
To do this, we will use the Tétralogie platform for strategic foresight, developed by the Institut de Recherche en Informatique de Toulouse (IRIT) Systèmes d’information Généralisée — Exploration et visualization d’Information (SIG-EVI) team, which allows macroscopic analysis of data on nanotechnologies. Tétralogie’s graph creation module, VisuGraph, allows these data to be presented in a more intuitive form, facilitating the analysis of the structure and the evolution of these data.
The plan for this analysis is as follows. First, we will explain the preliminary data processing stage used to obtain the co-occurrence matrices from the textual data found in a database. Next, we will present a detailed breakdown of each step of the analysis. In conclusion, we will provide an assessment of the analysis of nanotechnologies.
2.3.1. Preliminary data
The data used for this analysis are taken from the Pascal database (see http://web5s.silverplatter.com/webspirs/start.ws?customer=tlseups3&language=fr&databases=S(PASC)). The body of the material to be analyzed is made up of papers relating to the domain of nanotechnologies.
Once these documents have been retrieved, they are concatenated to form a single corpus of material in the form of a single text file. This text file is tagged to allow users to distinguish between and extract different types of data found in the file.
The bibliography of the Pascal database may be unpacked using either long or short tags.
In the first case, the tags are often made up of several words (e.g. CONFERENCE OR MEETING INFORMATION): this is a hindrance for the analyst and adds unnecessary additional weight to the corpus.
In the second case, it is no longer possible to differentiate between DESCRIBERS and IDENTIFIERS in English, French, and Spanish, a fact that poses problems for the processing of these fields. For this reason, we use a reformatting program written in Perl (Figure 2.4).
Figure 2.4. Reformatting the Pascal database in Perl

This process has another advantage in that it allows us to assign standard names to certain common tags, allowing Pascal to be used in multibase analyses (fusion of databases such as SCI, Current Contents, Medline, Biosis, Francis, and Chemical Abstract).
To check the homogeneity of the corpus, we will enumerate, for each tag, the number of notices in which the tag is present. Thus, if a tag is found infrequently, we know that the information it contains is not sufficient for use in a reliable statistical study.
To do this, a filter is created to keep only those tags found in the corpus in its target format obtained after reformatting: TI:, AU:, AD:, SO:, NO:, …, DE:, DF:,… and so on.
Once this filter has been established, we define specific metadata (Figure 2.5) to run the automatic tag counter. The file that corresponds to the metadata indicates a single tag, which is found at the beginning of each entry (the NO: tag). The names of other tags are considered to be attributes of this tag. The filter allows us to keep only that which concerns the tags. If a tag occurs several times in an entry, as in the Medline database, it is only counted once.
Figure 2.5. Specific metadata allowing tag counting

From the “results” file, we can create a histogram showing those tags that occur most frequently.
From Figure 2.6, we can easily pick out those tags that occur most often: DP:, SO:, TI:, AU:, and so on. In our analysis, we will pay particular attention to authors (AU:), to heir origins (organizations, towns, countries, shown by the OR: tag), and to dates (DP:); this information is almost always present in the entries. Other fields, somewhat less frequent, such as English keywords (DE:), journals (JN:), and conferences and meetings (CF:) may also be very useful, but in processing them we must neglect certain documents.
Figure 2.6. Histogram showing the number of appearances of each tag in the corpus

A second problem concerns the “cleaning” of some data fields, which are not important for our purposes. In the Pascal database, the “Author” field may be polluted by “parasite” information concerning editors, preface authors, directors, or translators (see Figure 2.7). This information, while useful in gaining a picture of particular social networks, is a hindrance when trying to identify research teams and their interactions. A filter may be used in this case to remove superfluous information. It is also possible to look only at this information or at the links between these individuals and the authors. To do this, we would create a virtual additional field to process these additional data.
After this “cleaning” stage, we must create a dictionary of items contained in each field and look for possible equivalences. Tétralogie includes a module for the automatic detection of synonymy (equivalence between terms) using several comparison algorithms. Manual validation is sometimes necessary, particularly for the names of authors of Asian origin, for names of organizations, or for certain keywords.
Figure 2.8 is an extract from the automatically generated synonymy file for the “Author” field. In this extract, we note that a false synonym has been created for the author ARNOLD-KLAUS and that the form ARNOLD-K is ambiguous, having two possible equivalents. The two synonymies to ARNOLD-KATHARINA must therefore be removed. Those for author AVOURIS-PHAEDON, however, seem to be perfectly correct (as do all the others).
Figure 2.7. Extract from an entry in the reformatted database

Figure 2.8. Extract from the author synonymy dictionary
2.3.2. Data visualization
Once the filters and synonymy dictionaries are in place, the data are cross-referenced in the form of co-occurrence matrices. If our analysis is targeted toward the evolution of authors over the last 4 years, we obtain co-occurrence matrices based on cross-referencing the fields “Author X” and “Author X, Time”. In this way, we can detect and analyze different structures and identify major players in the domain.
Figure 2.9. Co-occurrence matrices for authors in the domain of nanotechnologies

As our study is concerned with the development of nanotechnologies over the last few years, we will cross-reference authors for each of the years being studied to obtain four co-occurrence matrices (one per year), as shown in Figure 2.9.
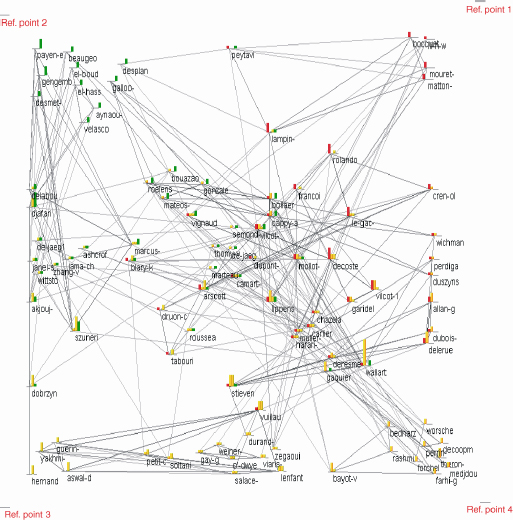
From these four co-occurrence matrices, we can produce a time graph using the VisuGraph tool. The nodes and connections in this graph represent authors and collaborations between pairs of authors, respectively, collaborations that produced at least one co-publication.
On the development graph, reference points are distributed in a circular manner, like the hours on a clock, following the space—time analogy. Nodes, representing authors, are located in relation to these reference points depending on the period of their activity, that is, we use centroid bodies. Nodes, representing authors, are located in relation to these reference points depending on the period of their activity. We use centroid bodies to specify temporal characteristics. The nodes found closest to a reference point therefore correspond to authors who published their work only in the period under consideration. If a node is situated equidistantly from two reference points, then the author displays the same level of activity over two periods only. Authors in the center of the graph appear throughout the four periods and are therefore permanent contributors to the domain.
The study of the links between authors in each instantiation of the graph allows us to identify all of their collaborations over time. The graph in Figure 2.10 may be seen statically as a connate class showing collaborations at any given moment. If, however, we wish to consider a single period, then many authors will be absent and the graph is no longer connate.
We see, then, that the continuous study of instantiations of the graph produces a conclusion that is completely opposed to that produced by a static study as far as the essential notion of connexity is concerned.
In the case of a static analysis, the graph is seen to be connate, in spite of the fact that it was never connate in the four periods under consideration. This demonstrates the importance not only of the temporal component, but also of ignoring this component on occasion.
The global structure of the graph is already difficult to perceive using a static study; this problem arises in the same way when trying to understand any macroscopic or specific structure (collaboration networks, new arrivals, rapprochements, fusions, breakaways, progressive restructurings, etc.).
Looking at Figure 2.10, we see that teams were essentially present in a single period: they are found in the four corners. Those present over two periods are found in the middle of the sides. Those present over three periods are found between the three relevant reference points, and those present over all 4 years are found in the center of the graph. From this initial breakdown, the graph may be redrawn to make each team easier to read and to facilitate analysis of the internal structure and relationships with other teams.
A morphing algorithm may then be used to animate the graph, with progressive development from one moment to the next. We can, therefore, detect structural changes and interpret their strategic implications.
Figure 2.10. Graph showing evolution of research teams
Finally, using segmentation, transitive unfolding, and K-core threshold functions, it is possible to either focus on a detail or obtain a simplified view of the global structure.
In addition to Tétralogie and VisuGraph, our team was responsible for the development of a third tool, XPlor, which allows more detailed exploration of structures, updated via a data warehouse concerning relationships. The data warehouse is uploaded to an Internet portal. To add to a macroscopic study of the evolution of the authors, for example, we might extract the n best authors over the four periods, the first n for a given period, produce a histogram showing their evolution or compare their dynamics. In the same way, we can obtain knowledge of the full environment of their static and dynamic interactions with all the other information presented in the corpus. This tool is very useful when zooming in on targeted data, such as a competing team, a potential partner, new arrivals, leaders in the field, and so on.
To illustrate these capabilities, we have produced Figure 2.11, showing the top 20 authors in the static case, and Figure 2.12, showing the top 20 authors in dynamic mode.
Using the same procedure, we might study which countries produce the most work in the domain of nanotechnologies or which countries show the most interest in one particular application of nanotechnology.
Figure 2.11. Histogram showing top authors

Figure 2.12. Visualization of top authors by period

2.4. Conclusion
We have seen that the results produced by our three tools were obtained using different, but complementary, approaches. Tétralogie was used to prepare data (reformatting, synonymies, filtering, and cross-referencing) and for global analysis (macroanalysis). VisuGraph allowed us to look at the relationship aspects of the data and to study its development, specifically in terms of author networks. XPlor made it easier to look at data in depth (targeted microanalysis), providing all the information needed to validate the knowledge we discovered. This set of tools, developed in our laboratory, has been tested on hundreds of data sets (using both single and multiple databases) from extremely varied sources, including bibliographical databases, patent databases (Uspto, Esc@cenet, Wipo, Google patents, Patents.com, Derwent, Wpil, etc.), directories (for medicine, pharmacies, businesses, etc.), Webpages, Weblogs, streaming and press databases, and latterly, databases in Unicode UTF-8 (Chinese, Korean, Japanese, Arabic, etc.).
As the tools used are completely generic, all forms of textual data may be used, after a very short period of adaptation, to support decision making by the revelation of implicit knowledge contained within the data. Work is underway to extend this extraction process to other, non-textual sources (audio, video, films, images, genes, encrypted data, etc.); conclusive tests have already been carried out on .mp3 files and animated films.
2.5. Bibliography
[BES 96] BESSON B., POSSIN J.C., Du Renseignement à l’intelligence économique, Dunod, Paris, 1996.
[BES 98] BESSON B., POSSIN J.C., L’audit de l’intelligence économique, Dunod, Paris, 1998.
[BOU 04] BOUAKA N., Développement d’un modèle pour l’explication d’un problème décisionnel: un outil d’aide à la décision dans un contexte d’intelligence économique, Doctoral Thesis, University of Nancy 2, Nancy, 2004.
[COL 97] COLLETIS G., “IE: vers un nouveau concept en analyse économique?”, Revue d’intelligence économique, no. 1, 1997.
[GOT 92] GOTTHARD W., LOCKEMANN P., NEUFELD A., “System-guided integration for object-oriented databases”, IEEE Transactions on Knowledge and Data Engineering, pp. 1–22, 1992.
[GUI 03] GUILHON A., MANNI C., “L’intelligence économique comme processus de création de savoir: le cas de Mecaplast”, in Guilhon B., Levet J.L., De l’intelligence économique à l’économie de la connaissance, Economica, Paris, 2003.
[JUI 05] JUILLET A., Commission nationale consultative de la formation de l’IE, référentiel de formation en intelligence économique, SGDN, Paris, 2005.
[LEV 96] LEVET J.L., PATUREL R., L’intégration de la démarche d’IE dans le management stratégique, Acte de l’Association Internationale de Management Stratégique, Lille, 1996.
[LEV 01] LEVET J.L., IE: mode de pensée, mode d’action, Economica, Paris, 2001.
[MAR 95] MARTINET B., MARTI P., L’IE: comment donner de la valeur concurrentielle à l’information, Editions d’Organisation, Paris, 1995.
[MAR 94] MARTRE H., IE et stratégie des entreprises, Œuvre Collective du Commissariat au Plan, La Documentation Française, Paris, 1994.
1 Chapter written by Ilhème GHALAMALLAH, Eloïse LOUBIER and Bernard DOUSSET.
1 Explicit knowledge, contrary to tacit knowledge, is knowledge clearly set out in a written document or in a computer system; this knowledge is physically transferable, as it appears in a tangible form, whether in a document, a paper file, or a computer file.
2 Tacit, or implicit, knowledge is knowledge that belongs to the world of “mental objects”, mental representations that often relate to personal life experience. It is generally difficult to put into words or “formalize”, unlike explicit knowledge (source: Wikipedia). Michael Polanyi goes into more detail with regard to this distinction.