21
Recycling of Carwash Effluents Treated with Subsurface Flow Constructed Wetlands
A. Torrens1, M. Folch1, M. Salgot1 and M. Aulinas2
1Soil Science Laboratory, Faculty of Pharmacy, University of Barcelona, Barcelona, Spain
2Life MinAqua PM, Grup Fundació Ramon Noguera, Girona, Spain
21.1 Introduction
In some Mediterranean regions such as Catalonia, urban development is putting existing water resources at risk. In these zones, any attempt to reclaim, recycle and reuse water is considered a “win–win” strategy by both enhancing water supplies and reducing pollution. Such win–win strategies can be implemented in many industrial sites and for activities that involve tap water consumption [1].
A sector contributing to high water consumption is commercial car washing. Currently, vehicle washing facilities are widely spread throughout all urban areas in developed countries. Despite their significant negative environmental impacts that result from the high consumption of resources (water and energy) and generation of waste, there are very few facilities that are committed to using innovative solutions to address this problem. Efforts to improve water use efficiency should be placed in conjunction with maintaining or improving water quality. Therefore, water consumption and pollution should be reduced by better management and technical improvements in the treatment and recycling of wastewater. The car wash industry poses additional environmental threats due to the use of detergents with surfactants and additives.
The car wash industry appears today to be more conscious of the need for wastewater treatment and water reclamation. Environmental legislation and guidelines concerning this specific issue have been released worldwide. In Queensland, Australia, it is forbidden to use more than 70 L of fresh water per vehicle, and some European countries restrict water consumption to 60–70 L per car and/or impose reclamation percentages (70–80%). In the Netherlands and Scandinavian countries, 60–70 L/car is the maximum amount of fresh water consumption allowed. The recycling of 80% of car wash effluent is compulsory in Germany and Austria [2].
The majority of car wash facilities in Europe and Spain do not recycle their wastewater; they treat the wastewater in order to meet the established thresholds to discharge to the sewer system or the receiving media. Currently, car wash facilities in the city of Girona use tap water, and each car wash uses approximately 320 L of water [3]. The total consumption of water in the car wash industry mainly depends on the type of vehicle cleaning system. Table 21.1 shows water consumption according to type of car wash, expressed in liters per washing. The figures are based on data from the literature [4] and the experience of the Life MinAqua project (2012–2016), as it is shown in the last column.
Table 21.1 Water consumption average according to the type of car wash.
| Vehicle cleaning system | Water consumption (L/washing) | Water consumption (L/washing) Life MinAqua (water audits) |
| Conveyor car | 100–350 | 252–295 |
| Large vehicles | 200–650 | 66 |
| Self-service box | 70–80 | 440 |
| Hand-wash | 50–500 | – |
The criteria for vehicle wash reclamation systems must include public acceptance, aesthetic quality of reclaimed water, microbiological risk and chemical issues. Reports by the International Carwash Association indicate that the water quality of vehicle washes should be sufficiently high such that the vehicles and wash equipment are not damaged (chemical risks include corrosion, scaling and spot formation), the microbial risk to operators and users must be minimal, and the aesthetic conditions must be acceptable [5]. Therefore, controlling the microbiological risk of reclaimed water is an important issue in the car wash industry. In addition to bacterial indicators, Legionella content is an important parameter that must be controlled if the installation has any equipment that can produce aerosols.
The car wash process consists of the following steps: (1) application of a degreasing agent all over the surface of the vehicles; (2) addition of acid and alkaline cleansers; and (3) a coating [6]. Effluents from car wash facilities contain a number of pollutants such as sand, dust, detergents/surfactants, organic matter, oil, fat, oil/water emulsions, carbon, asphalt and salts [7]. This effluent also presents high levels of turbidity, organic matter, phosphorous and nitrogen compounds, plasticizers, brake dust from rubber linings and various heavy metals [4, 5]. Few studies have characterized car wash effluents, and even fewer from a microbiological point of view. However, the study conducted by Zaneti et al. [5] demonstrates that car wash effluent includes high concentrations of bacterial indicators (fecal coliforms).
Conventional treatment methods such as series of settler tanks and hydrocarbon separators are often used when wastewater needs to be discharged into the environment or to the sewerage. If wastewater reclamation is envisaged, the effluent must be treated to meet an acceptable level of water quality such that it can be recycled; thus, higher quality effluents are needed. In the car wash industry, a typical approach used for reclamation systems entails usually physical–chemical treatment, i.e., flocculation–sedimentation and direct filtration. Some suppliers have developed recycling equipment based on flocculation–coagulation processes and compact filtration systems. According to Brown [8], car wash wastewater reclamation requires the separation of sand, gravel, oils and fats prior to reuse. Additional treatment processes can be employed to strengthen the quality of the reclaimed water, such that it can be used in different washing stages (pre-soak, wash, rocker panel/undercarriage, first rinse, and final rinse). Some processes and technologies that have been proposed and tested include reverse osmosis, nanofiltration, ultrafiltration, flocculation–sedimentation and flocculation–flotation [2]. Filtration treatments with activated carbon, ozone and ultrafiltration are being studied along with electrochemical methods such as anodic oxidation with diamond and lead dioxide anodes [9, 10].
As far as the authors know, natural technologies have never been applied to treat these effluents, even though Constructed Wetlands (CWs) are used to treat effluents with similar characteristics (e.g., urban runoff) or those even less biodegradable (e.g., petroleum and oil industry). Therefore, in this context it is proposed the use of natural treatments to reclaim wastewater from car wash facilities.
The general objective of the pilot project study presented in this chapter is to demonstrate that natural treatments can effectively reclaim wastewater from car wash effluents facilities. Specifically, the purpose of the study is to evaluate the viability of different Subsurface Flow Constructed Wetlands (SSFCWs) configurations to treat the effluent from car wash facilities for internal recycling and reduce tap water consumption.
21.2 Case Study: Description
Montfullà's car wash facility, from the special employment center owned by the Grup Fundació Ramon Noguera, is located at Montfullà's industrial park in Bescanó, province of Girona (Catalonia, Spain). This facility was opened in 2011 and has a conveyor or pull-along car wash, a gantry car wash for commercial and large vehicles (buses, trucks, etc.) and a self-service car wash facility. The area's average yearly rainfall is between 700 and 900 mm, and average monthly temperatures range from 1 –24°C. Three pilot plants were purposely designed and constructed for the project: one Vertical Flow Constructed Wetland (VFCW), one Horizontal Flow Constructed Wetland (HFCW) and one Infiltration–Percolation (IP) filter with subsurface drip irrigation equipped with disk filters before the IP. Figure 21.1 presents the layout of the whole pilot installation. As mentioned before, the aim of this chapter is to focus only on the results obtained with the Subsurface Flow Constructed Wetlands configurations used.
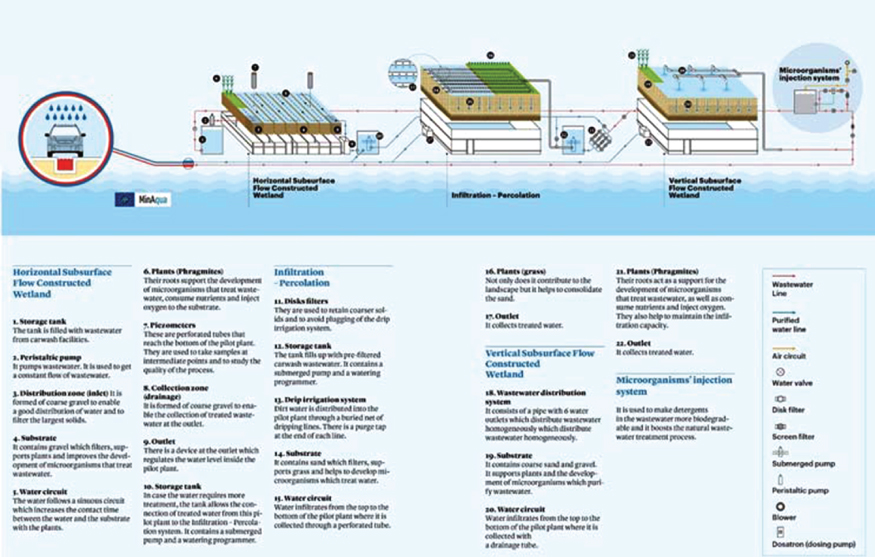
Figure 21.1 Pilot plant layout (modified from [11]).
21.2.1 Pilot Vertical Flow Constructed Wetland
The VFCW is made up of a movable container filled with filtering and draining material. This pilot treats wastewater directly from the settling tank (ST) of the facility. Wastewater is discontinuously applied onto the surface through a distribution system (Figure 21.2). The water percolates through the VFCW, and is collected by a draining system connected to the sewer. Figure 21.3 shows a view of this equipment and Table 21.2 summarizes the general characteristics of this pilot.
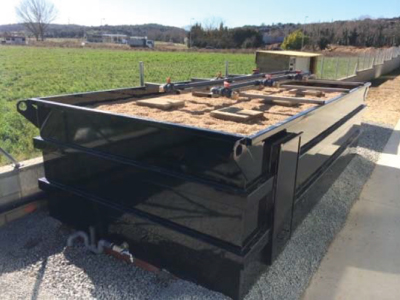
Figure 21.2 Pilot VFCW distribution system.

Figure 21.3 View of the pilot VFCW.
Table 21.2 Summary of the pilot VFCW characteristics.
| Operation | Discontinuous by batches |
| Feeding mode | Instant flow at the application point: 4.8 m3/h |
| Distribution system | Overground pipeline with 6 outlets |
| Container | Built in steel |
| Container size | The container has a total surface of 10.58 m2 – Total length: 4.6 m – Total width: 2.3 m – Height: 1.3 m |
| Filtering material | Two layers of filtering material: – Top layer of calibrated fine sand (d10 = 0.23, CU = 3.2, fines content < 3%) 0.40 m height – Bottom layer of fine gravel (2–8 mm) 0.50 m height |
| Draining material | Transition layer 0.1 m (7–12 mm gravel) Draining layer 0.2 m (25–40 mm gravel) |
| Vegetation | Phragmites australis |
| Outlet structure | PVC Pipeline |
21.2.2 Pilot Horizontal Flow Constructed Wetland
The HFCW pilot system initially consisted of an elevated storage tank receiving wastewater from the ST by means of the main pump of the system. This 1,000 L tank used gravity to send water into the HFCW. The feed flow was manually regulated by opening or closing a valve. However, it was not useful to adequately regulate the flow because solids clogged it. These solid deposits caused a progressive decrease in flow and made it impossible to control and regulate it. A peristaltic pump was installed to feed the HFCW and in order to better regulate the inflow.
The HFCW container is divided into compartments (Figure 21.4). Water is applied under the surface in the inlet area. The water flows through the HFCW and is collected on the opposite side. The outlet system has and adjustable pipe to regulate the level inside the HFCW (Figure 21.4). From the HFCW, the treated water can be discharged into the sewer system by gravity or be pumped to the IP system. Figure 21.5 shows a view of the HFCW pilot. Table 21.3 shows a summary of the general features of the HFCW pilot.

Figure 21.4 Pilot HFCW container and outlet device.

Figure 21.5 View of the pilot HFCW.
Table 21.3 Summary of the pilot HFCW characteristics.
| Operation | Continuous |
| Feeding mode | Peristaltic pump |
| Container | Built in steel; interior compartments of 2 × 0.6 m |
| Size | The pilot has a total surface of 10.58 m2 – Total pilot length: 4.6 m – Total pilot width: 2.3 m – Height: 0.6 m |
| Filtering material | Inlet and outlet areas (25–40 mm gravel; 1 m length of this gravel is placed in the inlet zone and 0.5 m length in the outlet zone) Filtering zone (12–18 mm gravel) |
| Vegetation | Phragmites australis |
| Outlet device | Adjustable level pipe |
21.2.3 Operation and Monitoring
The two pilot CWs treated wastewater from a setting tank and operated in parallel during the entire monitoring period (2 years). The HFCW was fed continuously whereas the VFCW was intermittently fed. The HFCW was fed with a peristaltic pump; three different hydraulic loads (HL) were applied: 1.4 cm/day, 7.5 cm/day and 14 cm/day. For the VFCW pilot, three HL were tested: 4.5 cm/day, 19 cm/day and 36 cm/day and for each HL, two dosing modes were tested for a different number of applications (4 or 8 batches per day).
Water quality was monitored by systematically taking samples from the pilots (inlets, outlets). The sampling frequency was weekly, biweekly, monthly or bimonthly depending on the parameter and the sampling points. The parameters were analyzed by using a multi-parametric probe: pH, electrical conductivity (EC), water temperature, redox, turbidity and dissolved oxygen (DO) or in laboratory (LABAQUA S.A.): COD, dCOD, DBO5, SS, VSS, TKN, N-NH4+, N-NO3–, P-PO43–, sulfates (SO42–), chlorides (Cl–), calcium (Ca2+), magnesium (Mg2+), alkalinity, total surfactants (anionic, cationic, non-ionic), oil, fats, hydrocarbons, E. coli and Legionella spp. Additionally one annual sample was taken at the pilots' inlets for helminths eggs (Ancylostoma, Trichuris and Ascaris).
21.3 Case Study: Results and Discussion
21.3.1 Influent Characterization
During the study period, the pump that feeds the pilot system was placed between 30 and 120 cm from the bottom of the ST (between 80–120 cm from the base of the basin the first year, and nearer the bottom at 30–40 cm from the base the second year). Therefore, the wastewater that was pumped was partially settled in relation to the effluent coming directly from the car wash facility. Table 21.4 shows pilot influent wastewater quality (average value, maximum and minimum values) for the two years of monitoring.
Table 21.4 Influent wastewater characterization.
| Parameters | Units | n | Average (whole period) | Average (year 1) | Average (year 2) | Max | Min |
| Temperature | °C | 67 | 18.7 | 18.3 | 19.1 | 27.8 | 9.5 |
| pH | 67 | 7.9 | 8.0 | 7.9 | 9.3 | 6.7 | |
| Redox | mV | 67 | 86.2 | 88.4 | 84.0 | 225 | -47 |
| EC | µS/cm | 67 | 548 | 503 | 593 | 1259 | 179 |
| DO | % | 67 | 10.2 | 14.5 | 5.9 | 65.2 | 0.0 |
| DO | mg/L | 67 | 0.9 | 1.2 | 0.6 | 5.9 | 0.0 |
| Turbidity | FNU | 67 | 114 | 85.0 | 144 | 265 | 33.8 |
| COD | mg/L | 66 | 71.6 | 48.8 | 94.4 | 438 | bdl |
| dCOD | mg/L | 66 | 32.4 | 22.3 | 42.5 | 190 | bdl |
| pCOD | mg/L | 66 | 41.3 | 30.8 | 51.9 | 346 | 5.0 |
| BOD5 | mg/L | 66 | 18.8 | 14.0 | 23.6 | 70 | bdl |
| SS | mg/L | 66 | 63.8 | 41.0 | 86.6 | 421 | bdl |
| VSS | mg/L | 31 | 25.6 | 15.4 | 35.9 | 210 | bdl |
| TKN | mg/L | 31 | 3.8 | 4.2 | 3.5 | 34.2 | bdl |
| N-NO3– | mg/L | 31 | 2.1 | 2.5 | 1.8 | 14.8 | bdl |
| N-NH4+ | mg/L | 31 | 0.6 | 0.3 | 1.0 | 3.3 | bdl |
| P-PO43– | mg/L | 31 | 0.7 | 0.4 | 1.0 | 6.5 | bdl |
| S-SO42– | mg/L | 15 | 48.7 | 51.4 | 46.0 | 157 | 31.8 |
| Cl– | mg/L | 15 | 51.5 | 58.0 | 45.1 | 250 | 20.1 |
| Ca2+ | mg/L | 15 | 59.6 | 54.3 | 64.9 | 79.2 | 50.6 |
| Mg2+ | mg/L | 15 | 9.8 | 8.8 | 10.8 | 12.5 | 8.5 |
| Alkalinity | mg/L CaCO3 | 32 | 174 | 160 | 187 | 239 | 58.1 |
| Anionic surfactants | mg/L | 32 | bdl | bdl | bdl | 0.9 | bdl |
| Cationic surfactants | mg/L | 32 | bdl | bdl | bdl | 0.4 | bdl |
| Non-ionic surfactants | mg/L | 32 | 0.4 | bdl | 0.4 | 1.4 | bdl |
| Hydrocarbons, oil and fats | mg/L | 6 | 0.3 | 0.2 | 0.4 | 0.6 | bdl |
| E. coli | CFU/100 mL | 64 | 2382 | 1262 | 3503 | 59000 | 0 |
| Legionella spp. | CFU/L | 8 | 0 | 0.0 | 0.0 | 0 | 0 |
| Nematode eggs | Eggs/10L | 2 | 0 | 0.0 | 0.0 | 0 | 0 |
Max = maximum, Min = minimum, SD = standard deviation, bdl = below detection limit.
As Table 21.4 shows, the car wash effluent showed great differences throughout the year of the study. All parameters, especially SS, showed significant variations, due to variable dirt levels contributed by each vehicle and type of vehicle (cars, trucks), and, more importantly, to the height the pump was placed in the ST and the time of sampling. The average percentage of VSS in reference to SS in the influent to the pilots was about 41%, which implies a significant amount of mineral solids (mineral solids adhered to car wheels and tires). When the pump was placed near the bottom of the ST (year 2), the average SS was much higher. Four additional wastewater characterization campaigns were made in samples taken directly before the ST. These samples presented about 10% of VSS in reference to SS (SS values about 977 mg/L and VSS of 112 mg/L). Therefore, non-organic SS were about 90% (basically sand and fines) and settling of these particles was relatively quick.
The BOD5/COD ratio was close to 0.3, which is a medium biodegradability index, lower than urban wastewater (usually above 0.4) [12]. These values are different from urban wastewater or other types of industrial wastewater (e.g., agrofood industry), which have a higher percentage of organic material and are more biodegradable. This type of wastewater will, therefore, be more difficult to degrade biologically than urban or industrial wastewater with higher BOD5 contents. In addition to biodegradability, other mechanisms such as filtration and sedimentation will be important to treat this water. Long-term studies would be necessary to analyze the accumulation of these inorganic particles at the filtering matrix. Table 21.5 shows usual car wash and urban wastewater values for certain parameters [5].
Table 21.5 Urban and car wash wastewater characteristics (adapted from [5]).
| COD (mg/L) | Surfactants (mg/L) | Total phosphorus (mg/L) | Total nitrogen (mg/L) | |
| Urban wastewater | 430 | 4 | 7 | 40 |
| Car wash wastewater | 191 | 21 | 1 | 9 |
| Bus wash wastewater | 307 | 6.3 | 8.5 | 5 |
| Truck wash wastewater | 600 | 21 | 8.5 | 30 |
Analytical results from the literature [2, 5, 13, 14] are very similar to those obtained in the water sampling characterization at the inlet of the ST of this project [15]. However, if data from the water arriving to the pilots is compared to literature data, the values are lower in the pilot's influent, especially for organic matter and solids. This is probably because in the mentioned studies, samples were taken before any pretreatment, without settling. It must be also pointed out that the values included in the literature [2] vary greatly, which shows the importance of obtaining and analyzing a large number of samples to be able to draw reliable conclusions.
Regarding nutrients, concentration in nitrogen and phosphate forms in the influent was low and similar to that described in the literature. With respect to the concentration of the three types of surfactants analyzed, it was lower than expected (only non-ionic surfactants and in low concentrations were found: maximum 1.4 mg/L), which may be due to its rapid biodegradability, high dilution and an optimized detergent dosing. Other wastewater characterizations were additionally carried out in parallel in several car washing facilities in the same project [16], which presented surfactant concentrations slightly larger: 2.6 mg/L of non-ionic surfactants (these values are from a car wash facility in Girona managed by the same company as the Montfullà facility). The average of 15 sampling campaigns conducted in another car wash facility in the Basque Country (within the same project) gave a concentration of 0.25 mg/L for non-ionic surfactants and bdl for anionic surfactants.
The hydrocarbons, oils and fats contents were low (average 0.3 mg/L and maximum 0.6 mg/L). Again, these results are different from those of the literature (oils and fats values close to 5 mg/L), and from the data obtained from initial characterization at the inlet of the ST (hydrocarbons average of 2.1 mg/L and oils and fats average of 13.9 mg/L). These results can be explained because these components are less dense and float, so they move to the second ST instead of being applied to the tertiary treatment systems. Therefore, it can be estimated that a significant part of these components is not injected by the pump into the pilots. In fact, the initial water characterization results [15] showed values before the ST of 1–4 mg/L of hydrocarbons and 12–15 mg/L of fats, and at the outlet of the third ST (before the hydrocarbon separator) values of 12–14 mg/L of fats and 1–2 mg/L of hydrocarbons. Therefore, only about 10% of the fats and oils from the initial effluent were sent to the pilots.
In terms of microbiological parameters, pH, conductivity and most soluble substances (chlorides, sulfates, calcium and magnesium) results are in accordance with literature data [2, 5, 13].
21.3.2 Effluent Quality for Recycling
The basic purpose of the CW prototypes is to generate treated wastewater of sufficient quality to be recycled at car wash facilities (in the most appropriate wash stages). The main purpose is to recycle the wastewater treated by the pilots for the same purpose in the same facility to save water. However, there is no mandatory regulation for recycling in these facilities in Spain. There are some recommendations on quality from companies (for internal use) that water should have tap or recycled water to be used in car washing equipment. Since there is no legal regulation setting the specific limit for most of the recycling parameters, this study has taken as one of the quality targets the values included in Royal Decree 1620/2007 "establishing the legal regime for reusing treated water." In fact, Annex IA of this RD shows the quality criteria for reusing water according to different uses. This annex indicates the quality required for 1. Urban use/Quality 1.2/Services/ d) Industrial vehicle washing. Table 21.6 shows the quality criteria for urban wastewater reuse, quality 1.2 Services (including industrial vehicle washing). These values allow comparison of the water quality obtained in the study with the decree values and ensure that the water to be recycled does not pose a health risk.
Table 21.6 Quality required according to RD 1620/2007 for urban use quality 1.2. Services.
| Maximum acceptable value | |||||
| Water use | Intestinal nematodes | E. coli | SS | Turbidity | Other criteria |
1.2. Quality Services
| 1 egg/10L | 200 CFU/100mL | 20 mg/L | 10 FNU | Legionella spp. 100 CFU/L (if there is risk of aerosolization) |
21.3.3 Performance of the Constructed Wetland Pilots
21.3.3.1 Horizontal Flow Constructed Wetland
Table 21.7 shows the overall water quality results for the HFCW effluent (for all applied HLs).
Table 21.7 HFCW effluent quality.
| Parameters | Units | n | Average | Max | Min | dl | %<dl |
| Temperature | °C | 67 | 17.6 | 28.1 | 6.1 | –5 | 0 |
| pH | 67 | 7.2 | 7.9 | 6.4 | 0 | 0 | |
| Redox | mV | 67 | –7.8 | 170 | –90.4 | ±2,000 | 0 |
| EC | µS/cm | 67 | 564 | 1,035 | 306 | 0 | 0 |
| DO | % | 67 | 12.8 | 85.9 | 0.3 | – | 0 |
| DO | mg/L | 67 | 1.1 | 6.7 | 0 | 0 | 0 |
| Turbidity | FNU | 67 | 2.9 | 13.7 | 0.1 | 0 | 1.3 |
| COD | mg/L | 66 | 16.9 | 58 | bdl | 10 | 31.7 |
| dCOD | mg/L | 66 | 10 | 40 | bdl | 10 | 68.3 |
| pCOD | mg/L | 66 | 7.75 | 34 | 0 | – | – |
| BOD5 | mg/L | 66 | 5.1 | 15 | bdl | 5 | 52.1 |
| SS | mg/L | 66 | 3.9 | 29 | bdl | 3 | 67.3 |
| VSS | mg/L | 31 | bdl | 9 | bdl | 3 | 90.2 |
| TKN | mg/L | 31 | bdl | 8.1 | bdl | 3 | 87.1 |
| N-NO3– | mg/L | 31 | 1.1 | 7.7 | bdl | 0.5 | 56.2 |
| N-NH4+ | mg/L | 31 | bdl | 0.3 | bdl | 0.1 | 40.6 |
| P-PO43– | mg/L | 31 | bdl | 0.7 | bdl | 0.1 | 80.4 |
| S-SO42– | mg/L | 15 | 40.3 | 73.8 | 28.4 | 5 | 0 |
| Cl– | mg/L | 15 | 44.2 | 82.6 | 22.2 | 10 | 0 |
| Ca2+ | mg/L | 15 | 57.9 | 71 | 42.6 | 2 | 0 |
| Mg2+ | mg/L | 15 | 10 | 11.8 | 7.8 | 2 | 0 |
| Alkalinity | mg/L CaCO3 | 32 | 193 | 321 | 83.6 | 5 | 0 |
| Anionic surfactants | mg/L | 32 | bdl | 0 | bdl | 0.1 | 100 |
| Cationic surfactants | mg/L | 32 | bdl | 0 | bdl | 0.2 | 100 |
| Non-ionic surfactants | mg/L | 32 | bdl | 0 | bdl | 0.5 | 100 |
| Hydrocarbons oil and fats | mg/L | 6 | bdl | 0.1 | bdl | 0.05 | 66.7 |
| E. coli | CFU/100 mL | 64 | 131 | 3000 | 0 | – | – |
| Legionella spp. | CFU/L | 8 | 0 | 0 | 0 | – | – |
Max = maximum; Min = minimum; SD = standard deviation; dl = detection limit, %< dl = percentage below detection limit.
Regarding the organic matter parameters, very high performances were also obtained (especially in terms of BOD5), offering an effluent with very low concentrations for these parameters. The nutrients were eliminated or transformed in a distinct way depending on the parameter: the few nitrates entering the HFCW were almost entirely eliminated by plant absorption mechanisms and/or via denitrification and volatilization [17]. Phosphates were completely removed. In fact, concentrations of these nutrients were very low in the inlet; therefore, they were almost completely absorbed by plants. This can be observed from the uneven plant growth (see Figure 21.6).

Figure 21.6Phragmites australis in the pilot HFCW.
As seen in Figure 21.6, the plants in the area closest to the inlet have considerably greater growth than those in the outlet area, with a gradual descent. This may be explained by the fact that the few nutrients found in the inlet wastewater were absorbed by the plants at the beginning of the wetland, therefore are gradually depleted as the water circuit progresses. TKN and ammonia removal were almost 100%, but it is important to once again point out the low inlet concentrations. The soluble ions, such as the calcium, magnesium, sulfate and alkalinity did not vary substantially. The EC was slightly higher in the HFCW outlet especially in summer months when evapotranspiration was higher. A hydraulic monitoring of the inlet and outlet flow during the same day was carried out in order to verify any water loss caused by evapotranspiration. A certain amount of water was lost between the inlet and the outlet: from 8% to 21.8%. These losses may be due to evapotranspiration of water in the HFCWs due to the long HRTs. With data from the two years of study, it may be concluded that the yearly average flow loss has been approximately 15%. These water losses are to be expected based on the climate of the site and the plant growth [18].
The anionic and cationic surfactants were bdl in the inlet and outlet of the HFCWs. For the non-ionic detergents, they were always found to be bdl in HFCWs outlet. Removal of non-ionic surfactants from municipal wastewater using HFCW was studied by Sima and Holcova [19]. Non-ionic surfactants were removed with a high efficiency reaching almost 100% elimination. The study found that non-ionic surfactants were degraded both under aerobic and anaerobic conditions. However, because of the low concentrations of surfactants in our study, it was not possible to go in depth in the study of degradation/removal of surfactants in HFCWs. The low concentration of detergents in the HFCW inlet was due to the low doses applied and the high biodegradability of the detergents employed in the facility.
Hydrocarbons, oils and fats were almost entirely eliminated in the HFCW, with only one sample having a value over the detection limit, 0.1 mg/L. However, it must be noted that the influent concentrations were very low and that almost all oils and fats applied accumulated in the HFCW inlet area and clogged it. Polyaromatic hydrocarbons can be eliminated in CWs by various mechanisms [20, 21] not detailed here. Regarding values of dissolved oxygen and redox potential in the HFCW effluent, it was observed that the concentration of oxygen decreased gradually in the HFCW and that the redox potential had slightly negative values at the outlet (–7), indicating that the HFCW also presented anoxic/anaerobic areas.
Finally, regarding microbiological parameters, the average elimination of E. coli was 1.4 Ulog, a value that is quite characteristic of these systems (between 1–2 Ulog) [22–24].
Table 21.8 Comparison of HFCW pilot effluent quality with the limits established in RD 1620/2007.
| Nematodes | E. coli | SS | Turbidity | Legionella spp. | |
| Eggs/L | CFU/100mL | mg/L | FNU | CFU/L | |
| RD Value | 1 | 200 | 20 | 10 | 100 |
| % > RD | 0 | 12 | 0 | 4 | 0 |
In Table 21.8, the HFCW pilot effluent values are compared with those established by RD 1620/2007. The RD 1620/2007 is very strict with respect to self-management plans of the facilities. These self-management plans include a determined number of samples per time unit for the parameters indicated for each use. In this study there has not been strict compliance with this number of samples; therefore the calculations were made taking into account the number of analyses in our study. In Annex I.C of RD 1620/2007, it is established that 90% of the samples may not exceed the established values. Furthermore, it is indicated that the results' deviation may not exceed a certain maximum established thresholds (Maximum Allowable Value): 1 Ulog in the case of E. coli and Legionella spp.; 50% for SS and 100% for turbidity and intestinal nematodes.
In the HFCW effluent, for turbidity, only 4% of the samples presented higher values than those recommended, with these values being lower than 20 FNU, thus complying with the criteria for this parameter. For E. coli, 12% of the samples had values which exceeded 200 CFU/100mL, with the maximum deviation allowed being 10% of the samples. These results indicate that for greater safety, a final chlorination or other disinfection step is recommended after the HFCW. A final chlorination would allow residual chlorine which will act as a disinfectant in the pipes; thereby preventing E. coli recontamination or growths. It would also serve to help controlling Legionella spp.
After one year of operation, deposits were formed in different parts of the pilot system (valves, and HFCW inlet area). These deposits accumulated slowly in the HFCW inlet zone (Figure 21.7), clogging the system after one year of operation (water flooding in the inlet). After sampling, the deposits were removed, and the inlet gravel was cleaned.

Figure 21.7 Material settling in the inlet (HFCW).
These “biosolid” accumulations (black color) were characterized (Tables 21.9 and 21.10). The results of the accumulated material characterization show VS percentages lower than the percentages found in sludge, and algae or swine slurry deposits [25]. As an example, the percentage of VS in swine slurry or algae deposits ranged from 40–60. The percentage of VS of the deposits in the car washing pilots was only 17. The percentage of total carbon is also low (9.9% TOC). Therefore, the percentage of organic matter was not high. DM (dry matter) values were low (17.1%) representing a material with high water content. The percentage of oils and fats is of 0.081%. As discussed before, most oils and fats were not pumped to the pilots (floated and passed on to the second ST). The high concentration of metals (particularly copper and zinc) is also remarkable. Metal monitoring will be carried out in the second stage of the project. There are numerous experiences with CWs (e.g., [26]) demonstrating their ability to eliminate them by using macrophytes (phytoremediation).
Table 21.9 Deposit characterization.
| Parameter | Value |
| DM | 17.1% |
| TOC | 9.9% |
| VS | 17.9% DM |
| Oils and fats | 0.08% DM |
| pH | 5.9 |
Table 21.10 Deposit characterization (metals).
| Metal | Value (mg/Kg DM) |
| Antimony | 41 |
| Arsenic | <10 |
| Cadmium | <2.0 |
| Copper | 3,623 |
| Tin | 68 |
| Mercury | <0.20 |
| Nickel | 57 |
| Lead | 114 |
| Selenium | <10 |
| Thallium | <4 |
| Tellurium | 4 |
| Zinc | 1,642 |
The HFCW clogging occurred with low organic and SS surface loading rates values. SS surface loading rates were on average of 2.9 g SS/m2/d with a maximum 8.3 g SS/m2/d. COD loading rates were on average of 3.5 g COD/m2/d with a maximum 10.1 g COD/m2/d. HFCWs having a probability of clogging is well known; however, these technology usually receive much higher SS and organic loadings than the studied pilot without clogging problems. The fact that the inlet distribution of the modular HFCW has only one pipe makes this system more sensitive to clogging in the distribution area. However, similar HFCWs (with the same inlet design) treating domestic wastewater did not have any clogging problems with higher organic and SS surface loading rates [27]. This means that fat and oil content (even at low concentrations) quickly clog HFCWs inlet areas. As a result, it is recommended that fats and oils be removed before application to HFCWs.
21.3.3.2 Vertical Flow Constructed Wetland
Table 21.11 shows the results of the outlet water quality in the VFCW for all the applied HLs.
Table 21.11 VFCW effluent quality.
| Parameters | Units | n | Average | Max | Min | dl | %<dl |
| Temperature | °C | 75 | 18.7 | 28.3 | 8.4 | –5 | 0 |
| pH | 75 | 7.35 | 8 | 6.8 | 0 | 0 | |
| Redox | mV | 75 | 115.5 | 236 | –57 | ±2,000 | 0 |
| EC | μS/cm | 75 | 604 | 1,051 | –10.4 | 0 | 0 |
| DO | % | 75 | 43.3 | 784 | 8.7 | – | 0 |
| DO | mg/L | 75 | 3.9 | 78.7 | 0.7 | 0 | 0 |
| Turbidity | FNU | 75 | 10.4 | 21.6 | 0 | 0 | 0 |
| COD | mg/L | 71 | 11.8 | 68 | bdl | 10 | 48.4 |
| dCOD | mg/L | 71 | bdl | 32 | bdl | 10 | 81.7 |
| pCOD | mg/L | 71 | 4.3 | 58 | 0 | – | – |
| BOD5 | mg/L | 71 | bdl | 11 | bdl | 5 | 81.7 |
| SS | mg/L | 71 | 7.5 | 59 | bdl | 3 | 46.5 |
| VSS | mg/L | 35 | bdl | 6 | bdl | 3 | 89 |
| TKN | mg/L | 35 | bdl | 16.2 | bdl | 3 | 84.8 |
| N-NO3– | mg/L | 34 | 5.1 | 31.2 | bdl | 0.5 | 11.8 |
| N-NH4+ | mg/L | 34 | bdl | 0.8 | bdl | 0.1 | 48.8 |
| P-PO43– | mg/L | 33 | bdl | 1.6 | bdl | 0.1 | 78.3 |
| S-SO42– | mg/L | 17 | 45.3 | 100.7 | 27 | 5 | 0 |
| Cl– | mg/L | 17 | 45.9 | 103.9 | 21.4 | 10 | 0 |
| Ca2+ | mg/L | 17 | 63.2 | 95.5 | 49.5 | 2 | 0 |
| Mg2+ | mg/L | 17 | 9.75 | 16.3 | 7.6 | 2 | 0 |
| Alkalinity | mg/L CaCO3 | 34 | 180.1 | 291.1 | 128.1 | 5 | 0 |
| Anionic surfactants | mg/L | 34 | bdl | 0 | bdl | 0.1 | 100 |
| Cationic surfactants | mg/L | 34 | bdl | 0 | bdl | 0.2 | 100 |
| Non-ionic surfactants | mg/L | 34 | bdl | 0 | bdl | 0.5 | 100 |
| Hydrocarbons, oil and fats | mg/L | 10 | bdl | 0 | bdl | 0.1 | 100 |
| E. coli | CFU/100 mL | 71 | 19 | 600 | 0 | – | – |
| Legionella spp. | CFU/L | 8 | 120 | 1200 | 0 | – | – |
Max = maximum; Min = minimum; SD = standard deviation; dl = detection limit; %< bdl = percentage below detection limit.
The VFCW performed very efficiently, offering a very good effluent quality in terms of physico-chemical and microbiological parameters. The efficiency was high, particularly with regards to the COD and BOD5. In terms of SS and turbidity, the outlet qualities were good, although variable, and the average turbidity was 10 FNU. The most important SS elimination mechanism in VFCW is filtration [28]. Table 21.12 shows the percentage removal for the SS, turbidity and the organic matter parameters for the first and second year of operation.
Table 21.12 VFCW % removal for the first and second year of operation (SS, VSS, Turbidity and organic matter parameters).
| % Removal (average) | ||
| Parameter | Year 1 | Year 2 |
| Turbidity | 80.9 | 96.1 |
| SS | 71.5 | 96.1 |
| VSS | 86.3 | 100 |
| COD | 78.5 | 86.0 |
| dCOD | 75.7 | 100 |
| pCOD | 76.3 | 93.1 |
| BOD5 | 80.3 | 100 |
The SS removal was about 80% (71% the first year of operation and 96% the second year). Regarding organic matter parameters, the results (% removals) were also quite high, between 75 and 100.
The VFCW was designed to create a “biosolid” surface layer, as the French VFCW model. This layer of organic solids can reduce the infiltration velocities and increase filtration, leading to a larger retention of particulate substances. In the case of this pilot plant, in the VFCW, the water received from the car washing facility had few organic solids, thus the layer forming on the surface was quite thin in the first year of operation. This leads to a faster infiltration and lower filtration. Across the same batch, the VFCW effluent turbidity was observed to vary depending on the specific time of sampling after application during the first year (Table 21.13). Part of the water exits after a few minutes that presents higher turbidity and SS concentration.
Table 21.13 Turbidity changes based on time of sampling (HL = 36 cm/day, 4 batches/day, first year of operation).
| Sampling time | Turbidity (FNU) |
| Prior to batch (small outflow) | 2.6 |
| Immediately following batch (very high outflow) | 24.9 |
| 30 minutes after batch (average outflow) | 7.3 |
During the two years of operation, there were no signs of filter clogging, even with HLs of 36 cm/day. Nitrates were higher in the outlet of the VFCW as compared to the inlet, due to the fact that the system is aerobic and oxidizes the ammonia into nitrates [29]. The low TKN, ammonia and phosphate loads entering the VFCW were completely eliminated. Unlike the HFCW, the plants developed similarly across the VFCW filter (given that the distribution of water on the surface is similar across the points of the filter). Therefore, the plants may absorb nutrients in a similar way across the entire bed (see Figure 21.8).

Figure 21.8Phragmites in the pilot VFCW.
The soluble ions, such as the calcium, magnesium, sulfate cations or alkalinity did not vary considerably during the treatment. Salinity also showed no significant variations. The anionic and cationic surfactants were bdl in the VFCW influents and effluents. As for the non-ionic surfactants, elimination reached 100% (it should be noted that on a very few occasions the influent values were greater than the detection limit values). Non-ionic surfactants can be degraded both under aerobic and anaerobic conditions in CWs [19]. Therefore, these surfactants could be removed and/or transformed in VFCWs. Because of the low concentrations of surfactants on VFCW influent and effluent, it was not possible to go deeper into the study of degradation/removal of surfactants in VFCWs.
Hydrocarbons, oils and fats were removed in the pilot. Once again, it should be noted that the inlet concentrations are very low. Polycyclic aromatic hydrocarbons can be eliminated in VFCWs [20]. However, it was not possible to go into detail in the study of the removal of these compounds in the pilots due to their low concentrations. Unlike the HFCW where the formation of oily looking deposits was observed in the inlet area, no major accumulations in the VFCW filter which may lead to clogging have been observed.
When observing the outlet values and results of dissolved oxygen elimination and redox potential, it was found that the concentration of oxygen increased considerably and the redox potential had slightly greater positive values than in the inlet. These results indicate that the VFCW is an aerobic system that oxygenates the influent.
The “limit” for the performance of the HFCW as well as of the VFCW is the clogging. The media clogging occurs when the conductivity of the filter material is reduced. The increase in biomass and the development of biofilm and microorganisms leads to a strong reduction of the presence of oxygen in the lower layer and a resulting decrease in efficiency yields for all oxidizing processes (nitrification, carbon oxidation, elimination of pathogens). The German guidelines [30] specify that the VFCW must be designed with the following values for their proper operation: maximum organic load of 20 g COD/m2/d with a maximum concentration of 100 mg/L of SS, loading of SS = 5 g/m2/d, CH <8 cm/day in winter and 12 cm/day in summer. However, the French model supports higher values. In the first stage of the French VFCWs, the design and the special operating conditions allow an organic load of 100 g COD/m2/d [31].
There was no clogging in the VFCWs. As indicated before, part of influent solids were retained on the filter surface and created a thin layer, as is common in these systems. Moreover, distribution of the VFCW water makes it less likely to clog, as the water is distributed evenly all over the surface of the filter. It should be noted that the high efficiency of the VFCW treating car wash effluent and the oxygenation capacity even with the high loads of the second year of operation (the average loads applied the first year were around 15 g COD/m2/d and during the second year of about 35 g COD/m2/d). This indicates that the loads of 35 g COD/m2/d are not limiting for this VFCW design with this type of influent [16, 32].
For the microbiological parameters, there was a high E. coli elimination, with an average of 2.3 Ulog. These values are slightly greater than those normally observed in the VFCW which tend to range between 1 and 2 Ulog [33]. However, in the studied VFCW the filtration media was deeper (90 cm) and the granulometry of the top sand layer was finer. Removals greater than 2 Ulogs for E. coli or fecal coliforms has been observed in nfiltration-percolation systems with 150 cm of similar sand granulometry [34, 35]. Legionella spp. was always absent in the inlet, and presented one positive in the outlet of the VFCW, with only one value of 1200 CFU/L. When comparing with the RD 1620/2007, this value represents 3 Ulog, and therefore it is within the range of the maximum acceptable threshold as indicated in Annex 1C of the RD. Despite this, the feeding system was disinfected with chlorine and the sampling was repeated after 15 days, with negative results at the outlet of the VFCW and at several points of the car wash facility. Table 21.14 compares the effluent values of the VFCW pilot with those from the RD 1620/2007.
Table 21.14 Comparison of the VFCW outlet quality with that of RD 1620/2007.
| Nematodes | E. coli | SS | Turbidity | Legionella spp. | |
| Eggs/L | CFU/100mL | mg/L | FNU | CFU/L | |
| RD Value | 1 | 200 | 20 | 10 | 100 |
| % > RD | 0 | 3 | 7 | 32 | 10 |
For turbidity, 32% of the samples had higher values than indicated in the RD, mainly in the first year of operation. Although the values are very close to 10 (the average is 15), they do not comply with the regulations with regard to this parameter. The SS complies with the regulations (less than 10% of the values exceed the limits). The follow-up of the VFCW performances for a longer time period would be necessary. The organic layer would increase with time, thereby increasing filtration and providing higher percentage removal of suspended solids and turbidity. For E. coli, the results are almost always lower than the value of 200 CFU/100mL established by RD 1620/2007. As for Legionella spp., the facility also fails to comply with the thresholds; in one of the five samples there was a value of 1,200 CFU/L. These results indicate that it would be useful to add a final disinfection treatment (such as chlorination) as indicated before. This chlorination would also provide residual chlorine which would serve to disinfect the pipes thereby preventing pathogen recontamination.
21.3.3.3 Comparison of Performances
Table 21.15 shows the average removal percentages (physico-chemical parameters) for the two SSFCW pilots.
Table 21.15 Comparison of performance of the pilots for physicochemical parameters (% removal).
| Parameter | HFCW | VFCW |
| COD | 73.3 | 78.5 |
| dCOD | 72.2 | 75.7 |
| pCOD | 70.8 | 76.3 |
| BOD5 | 81.3 | 80.3 |
| Turbidity | 96.7 | 80.9 |
| SS | 88.5 | 71.5 |
| VSS | 88.8 | 86.3 |
| TKN | 100a | 100a |
| N-NO3– | 80.1 | –56.9b |
| N-NH4+ | 100 | 100 |
| P-PO43– | 89.3 | 87.5 |
| Anionic surfactants | c | c |
| Cationic surfactants | c | c |
| Non-ionic surfactants | 100a | 100a |
| Hydrocarbons, oils and fats | 75.2 | 100a |
aThe average outlet values were bdl.
bnitrification
cthe average inlet and outlet values were bdl.
The two SSFCW pilots presented very high removal percentage for turbidity and for all of the organic matter and SS parameters. Even when considering that the HLs applied to the VFCW are greater than those of the HFCW, the VFCW performance is slightly greater than that of the HFCW. This may be due to the fact that the oxidation of the organic matter occurs more efficiently in the VFCW, through the application of batches at high flow rates. The vertical flow and operation method favors filter oxidation. The aerobic functioning of the system via batches permits an efficient oxidation of the dissolved organic matter.
HFCW presented average SS and turbidity percentage removal slightly higher than the VFCW. However, if we compare the percentage removal of the second year of operation, the reductions are similar for both pilots (97.9% and 96.1% for turbidity at HFCW and VFCW, respectively; 100% and 96.1% of SS removal at HFCW and VFCW, respectively). The VFCW was designed to form a layer of coarse solids on the surface. Again, it is indicated that this layer of organic solids reduces infiltration rates and increases filtration, which results in a large retention of particulate matter. In the second year of operation this layer of almost 1 cm was formed, allowing a better and slower filtration, and more homogeneous yields. Additionally, the colonization of Phragmites roots throughout the filter in the second year and a higher biomass inside the filter (due to the application of higher organic loads) has also favored greater efficiency.
The VFCW nitrified the effluents, while the HFCW, on the other hand, presented anaerobic conditions and therefore did not produce nitrates. The three pilots eliminated TKN and ammonia almost entirely (values quite always bdl). The same occurred with phosphates. Regarding calcium, magnesium and sulfate ions, there were no major variations in any of the three pilots. No further variations were found for alkalinity, with a slight increase being found in the effluent from all three pilot plants.
The (non-ionic) surfactants from the influent of the pilot plants were completely eliminated (100%) by the two prototypes, but the concentrations of these surfactants in the influent were quite low. The same results were found for oils, fats and hydrocarbons: they were eliminated very efficiently in the two pilot plants; however, their influent concentrations were quite low.
Regarding the microbiological parameters (Table 21.16), the VFCW showed the greatest removal.
Table 21.16 Comparison of performances of the pilot plants for the microbiological parameters (Ulog).
| Parameter | HFCW | VFCW |
| E. coli | 1.2 | 2.3 |
| Legionella spp. | Absent | Absent in the inlet and 1 positive in the outlet |
The VFCW presented an average reduction of 2.3 Ulog for E. coli. However, for HFCW it was 1.2 Ulog. HFCW presented lower Ulog removals even with lower HLs. The removal mechanisms for E. coli seem to be more effective in aerobic systems with finer particle media (sand) and high depths of the filtering media such as in the VFCW.
21.4 Design and Operation Recommendations
21.4.1 Horizontal Flow Constructed Wetland
The HFCW (with the design and operation studied) was not proved to be the better of the two CW technologies for the treatment of this type of water, for the following reasons:
- Greater sensitivity to clogging especially the inlet area.
- Lower elimination of E. coli, and very sensitive removal with high hydraulic loads.
- The feeding of the HFCW must be continuous for better operation. If they cannot be fed by gravity, in car wash facilities producing low wastewater volumes, there is a difficulty in operation and maintenance of the pumps which affects wastewater with a high concentration of solids.
- The maximum tested HL that reaches the quality limits for recycling in the car washing facility was approximately 10 cm/d (much lower than the HL for the VFCW: 36 cm/d).
- Irregular growth of Phragmites australis (high growth near the entrance zone and very low in the areas near the outlet) is due to the low concentration of nutrients in this type of wastewater, and the way of feeding the HFCW. Nutrients are used by plants in the first stages of the wetland.
- Higher evapotranspiration (approximately 20% of the water volume is lost) results in less availability of treated water for recycling and higher EC.
However, the HFCW is simpler to operate and presents fewer operation costs. If a HFCW must be implemented for treating carwash effluent, it is necessary to:
- Remove oil and fats.
- Remove inorganic solids.
- Design a different inlet area to that of the studied pilot (much larger) with a coarser water distribution system per channel throughout this section. Thus, the water circuit design of the pilot would have to be designed in a completely different way.
Moreover, a final disinfection step (e.g., chlorination) is required to ensure free chlorine (0.5–2 mg chlorine/L) at the water recycled storage tank before being used in the carwash machinery.
From the study of water consumption per vehicle of the Montfullà car washing facility and the performance of the pilots, the area (m2) of HFCWs needed to reach the quality values for recycling has been determined. The consumption data considered have been: general vehicles (cars + industrial): 350 L/unit wash; cars: 250 L/car; industrial vehicles (trucks, buses): 450 L/vehicle. The HFCW area needed is [36]:
- General vehicles ≈ 2.5 m2/vehicle
- Cars ≈ 1.8 m2/car
- Industrial vehicles ≈ 3.2 m2/vehicle.
21.4.2 Vertical Flow Constructed Wetland
This technology with the design and operation studied, has proved to be the best option for the treatment of car wash effluent. The only limiting factor is the variability in turbidity values, during the first year of operation. This variability decreases in a "natural" way with the operation time. The variability of turbidity quality could also be reduced by further fractionating the daily application of water. Less variability was observed with eight batches per day compared to four batches. Thus, a minimum of eight batches per day is recommended (with a maximum of 15 so as not to saturate the medium and thus entering into anaerobic conditions). Another option to obtain a more constant quality would be to operate the VFCW more closely than is done with an infiltration percolation system, with the application of a lower instantaneous flow for a longer time. Even so, this possibility should be studied at pilot level, with an adequate water distribution designed to ensure a good surface distribution; aerobic conditions would also have to be ensured.
Although no clogging problems have been described for this technology, it is advised that the recommendations for HFCW be followed:
- Implement an efficient pretreatment for the removal of oils and grease and inorganic solids, which would substantially extend the life of the filter and avoid possible problems of clogging.
- A final disinfection step for the recycled water before being used in the car wash machinery.
As with HFCW, the area (m2) of VFCW needed to reach quality values for recycling was determined [36]:
- General vehicles ≈ 1 m2/vehicle
- Cars ≈ 0.7 m2/car
- Industrial vehicles ≈ 1.3 m2/vehicle.
21.5 Conclusions
The main outcome of the study is the viability of the application of subsurface flow constructed wetlands to treat the effluents from car wash facilities once their design and operation have been optimized. The results show that car wash effluents have high concentrations of inorganic suspended solids, very variable concentrations of E. coli and organic matter, low concentrations of nutrients, and the presence of hydrocarbons, fats and oils. The studied car wash facility effluent contains non-ionic surfactants, but at lower concentrations than expected due to the high biodegradability of the used detergents and the low dosing of products.
The two types of constructed wetland performed very efficiently with respect to turbidity, organic matter and suspended solids. Nutrient concentrations were quite low in the influent, thus Phragmites australis growth in the CW pilot plants was much slower than for other types of wastewater (especially in the HFCWs in the areas farthest from the residual water inlet). The VFCW nitrified the effluents. The HFCW presented more anaerobic conditions. The nutrient concentrations were very low, usually bdl. No major variations were found in any of the pilot plants for the parameters calcium, magnesium, sulfates and alkalinity.
Surfactants present in the inlet of the pilot plants (non-ionic detergents) were fully removed in the pilots, but it should be noted that the concentrations of these detergents were quite low in the influent. The same occurred with the oils, fats and hydrocarbons: they were efficiently eliminated by the two pilot plants, but their influent concentrations were very low, since the majority of these components pass through a second decanter and did not reach the pilot plants.
In general, E. coli was removed to acceptable limits for recycling, with concentrations lower than the limits established in the legislation for reclaimed water reuse in Spain. The removal of E. coli was much greater in the VFCW than in the HFCW. Legionella spp. was always absent in the inlet and outlet of the pilot plants except once in the effluent of VFCW. A final disinfection (i.e., chlorination) in the storage tank is recommended to minimize the microbiological risk, and in order to ensure the presence of (residual) disinfectant in the recycling pipes.
The oil and fats content of the car wash effluents as well as the inorganic suspended solids made pretreatment necessary in order to avoid media clogging. This is especially important for the performance of the HFCW. The VFCW worked without any clogging problems throughout the study for all of the applied loads, even without resting periods.
The study revealed the capability of SSFCWs, mainly the VFCW, for the treatment of car wash wastewater previously settled and for which oils and fats were previously eliminated. They may produce a very high quality effluent that may be recycled within the system (in processes requiring less exigent water quality and that have greater water consumption: prewash with hand-held lances and first wash step with brush arches). SSFCWs, mainly VFCW, have shown resilience to load and hydraulic fluctuations, to chemical pollutants and to variable environmental conditions; they are simple to operate and are maintained with minimum energy requirements and with an added aesthetical value.
More detailed studies should be carried on the effect of certain potentially corrosive pollutants (metals, salts) on the machinery used in the facilities.
References
- 1 Al-Odwani A, Ahmed M, Bou-Hamad S. Car wash water reclamation in Kuwait. Desalination. 2007; 206(1–3):17–28.
- 2 Zaneti R, Etchepare R, Rubio J. Car wash wastewater reclamation. Full-scale application and upcoming features. Resour Conserv Recycl. 2011; 55:953–959.
- 3 L.E.Q.U.I.A. (Laboratori d'Enginyeria Química i Ambiental). Conveni de col.laboració científica entre la Universitat de Girona i la Fundació Ramon Noguera. Informe final. Internal report. Universitat de Girona, Spain, 2008.
- 4 Janik A, Kupiec H. Trends in Modern Car Washing. Pol J Env Stud. 2007; 16(6):927–931.
- 5 Zaneti R, Etchepare R, Rubio J. More environmentally friendly vehicle washes: water reclamation. J Clean Prod. 2012; 37:115–124.
- 6 Paxéus N. Vehicle Washing as a Source of organic Pollutants in Municipal Wastewater. Water Sci Technol. 1996; 33(6):1–8.
- 7 Hamada T, Miyazaki Y. Reuse of carwash water with a cellulose acetate ultrafiltration membrane aided by flocculation and activated carbon treatments. Desalination. 2004; 169(3):257–267.
- 8 Brown C. Water effluent and solid waste characteristics in the professional car wash industry. Report for the International Carwash Association (ICA), Chicago, USA, 2002.
- 9 Panizza M, Cerisola G. Applicability of electrochemical methods to carwash wastewaters for reuse. Part 1: Anodic oxidation with diamond and lead dioxide anodes. J Electroanal Chem. 2010; 638(1):28–32.
- 10 Kiran SA, Arthanareeswaran G, Thuyavan YL, Ismail AF. Influence of bentonite in polymer membranes for effective treatment of car wash effluent to protect the ecosystem. Ecotox Environ Safe. 2015; 121:186–192.
- 11 MinAqua. Good practices guide for car wash installations. Grup Fundació Ramon Noguera, 2016. Available at http://minaqua.org/wp8c/wp-content/uploads/2016/12/ Good-practices-guide-for-car-wash-installations-ENG-bxa.pdf.
- 12 Tchobanoglous F, Burton L, Stensel HD. Wastewater Engineering: Treatment and Reuse. 4th ed. Metcalf & Eddy Inc., McGraw-Hill: New York, USA, 2003.
- 13 Bhatti Z, Mahmood Q, Raja I, Malik A, Khan M, Wu D. Chemical oxidation of carwash industry wastewater as an effort to decrease water pollution. Phys Chem Earth. 2011; 36(9–11):465–469.
- 14 Zaneti R, Etchepare R, Rubio J. Car wash wastewater treatment and water reuse – a case study. Water Sci Technol. 2013; 67(1):82–88.
- 15 MinAqua. Informe de resultados de la caracterización inicial de las aguas residuales. Grup Fundació Ramon Noguera, 2014. www.minaqua.org/wp5/wpcontent/ uploads/2012/12/A6_Informe entregable_vf.pdf.
- 16 MinAqua. Informe de resultados del monitoreo de la eficiencia de los pilotos I (Pilotos Montfullà, primer año de funcionamiento). Grup Fundació Ramon Noguera, 2015.
- 17 Vymazal J, Kröpfelová L. Removal of organics in constructed wetlands with horizontal sub-surface flow: A review of the field experience. Sci Total Environ. 2009; 407(13):3911–3922.
- 18 Milani M, Toscano A. Evapotranspiration from pilot-scale constructed wetlands planted with Phragmites australis in a Mediterranean environment. J Environ Sci Health. 2013; 48(5):568–580.
- 19 Sima J, Holcova V. Removal of Nonionic Surfactants from Wastewater Using a Constructed Wetland. Chem Biodivers. 2011; 8(10):1819–1832.
- 20 Vymazal J. Constructed wetlands for treatment of industrial wastewaters: A review. Ecol Eng. 2014; 73:724–751.
- 21 Xu L, Liuanbin R, Zhao Y, Doherty L, Hu L, Hao X. A review of incorporation of constructed wetland with other treatment processes. Chem Eng J. 2015; 279(1):220–230.
- 22 Huertas E. Regeneració i reutilització d'aigües residuals. Tecnologia, control i risc. PhD thesis, Universitat de Barcelona, Spain, 2009.
- 23 Torrens A, Folch M, Sasa J, Lucero M, Huertas E, Molle P, Boutin C, Salgot M. Removal of bacterial and viral indicators in horizontal and vertical subsurface flow constructed wetlands 12th IWA International Conference on Wetland Systems for Water Pollution Control, 3–8 October 2010, San Servolo, Venice, Italy.
- 24 Sasa J. Influencia de los periodos de llenado y vaciado en la eliminación de nutrients y desinfección en zonas humedas construidas de flujo subsuperficial horizontal. PhD Thesis, Universitat de Barcelona, Spain, 2014.
- 25 Torrens A. Subsurface flow constructed wetlands for the treatment of wastewater from different sources. Design and Operation. PhD thesis, Universitat de Barcelona, Spain, 2015. Available online at: http://www.tesisenred.net/bitstream/handle/10803/380738/ATA_THESIS.pdf?sequence=1&isAllowed=y
- 26 Gillespie WB, Bradley HW, Rodgers JH, Cano M, Dorn PB. Transfers and transformations of zinc in constructed wetlands: mitigation of a refinery effluent. Ecol Eng. 2000; 14(3):279–292.
- 27 Torrens A, Folch M, Bayona C, Salgot M. Upgrading quality of wastewater by means of decentralized natural treatment systems Sustainable management of environmental issues related to water stress in Mediterranean islands. Final Conference and Stakeholders event. Mediwat Project. Palermo, Italy, 2013, pp. 136–144.
- 28 Torrens A, Molle P, Boutin C, Salgot M. Impact of design and operation variables on the performance of vertical-flow constructed wetlands and intermittent sand filters treating pond effluent. Water Res. 2009; 43:1851–1858.
- 29 Molle P, Liénard A, Grasmick A, Iwema A. Effect of reeds and feeding operations on hydraulic behaviour of vertical flow constructed wetlands under hydraulic overloads. Water Res. 2006; 40(3):606–612.
- 30 ATV-A 262. Arbeitsblatt ATV-A 262. Grundsätze für Bemessung, Bau und Betrieb von Pflanzenbeeten für kommunales Abwasser bei Ausbaugrössen bis 1000 Einwohnerwerte. Gesellschaft zur Forderung der Abwassertechnik d.V., Germany, 1998.
- 31 Bresciani R, Masi F. Manuale pratico di fitodepurazione. Terra Nuova eds. Città di Castello, Italy, 2013.
- 32 MinAqua. Informe de resultados del monitoreo de la eficiencia de los pilotos II (Pilotos Montfullà, segundo año de funcionamiento), 2016.
- 33 Torrens A, Molle P, Boutin C, Salgot M. Removal of bacterial and viral indicators in vertical flow constructed wetlands and intermittent sand filters. Desalination. 2009; 246:169–178.
- 34 Folch M. Tratamiento terciario de aguas residuales por infiltración-percolación. PhD thesis, Universitat de Barcelona, Spain, 1999.
- 35 Brissaud F, Salgot M, Folch M, Auset M, Huertas E, Torrens A. Wastewater infiltration percolation for water reuse and receiving body protection: thirteen years' experience in Spain. Water Sci Technol. 2007; 55(7):227–223.
- 36 MinAqua. Descripción de los procedimientos de escalado. Demonstration project for water in car wash premises using innovative detergents and soft treatment systems, 2016. http://www.minaqua.org/wp14/wp-content/uploads/2012/12/B8.3_Descripci%C3%B3n-procedimientos-escalado_vf.pdf.