
2
PLANNING AND CONTROL OF SALES
INTRODUCTION
Primary responsibility for the planning and control of sales, of course, rests with the chief sales or marketing executive of the company or the business segment. However, the chief accounting officer, with the knowledge of costs and cost behavior as well as the familiarity with sales accounting and analysis, is in a position to use these skills to assist the various marketing executives. Some of the areas where the controller might be helpful include:
- Selection and application of mathematical/statistical methods to develop or verify sales level trends and relationships
- Analysis of internal sales data to reveal trends and relationships
- Analysis and assembling of the proposed sales plan/budget
- Development and application of sales standards for use by the marketing executive, if applicable
- Application of the relevant costs as a factor in setting product sales prices
While the controller has a supporting role to the chief sales executive with respect to sales planning and control, there are also some basic independent responsibilities, as a member of the financial staff, to see that adequate procedures are followed and that the sales planning and control is sound from a financial or economic viewpoint.
These subjects and others are discussed in this chapter. First, however, to provide background for the controller or for other readers, a brief review is made of the sales management function and some of its concerns.
SALES MANAGEMENT CONCERNS
The tasks of any management function are many, varied and complex. Sales management is certainly confronted with a broad range of problems. It is a dynamic area, with changing conditions, constantly resulting in new and different problems. The controller can be an important influence on the resolution of these problems and decisions. An extensive and objective analysis of sales and distribution costs can assist sales executives in making prudent decisions consistent with the short- and long-range goals of the company.
One problem area that has a significant impact on the planning process of the company is sales forecasting. The accuracy of the sales forecast is essential to good planning. The controller can work with sales management to realistically evaluate the degree to which the actual sales will relate to sales budget or forecast. There are many mathematical techniques available to establish standard deviations or variations that can be expected.
Significant progress has been made in developing more sophisticated management tools for sales executives. With the utilization of personal computers, management can have available summarized information on sales activity allowing it to make effective decisions in a timely manner. The controller should be an active participant in the development of these information systems and reports.
Although there are many types of problems encountered in the sales management function, there may be some that are found in most companies. The following is representative of some of the fundamental questions that are constantly raised:
- Product. What product is to be sold and in what quantity? Is it to be the highest quality in its field or lower? Is the product to be a specialty or a staple?
- Pricing. At what price is the article to be sold? Shall the company follow a policy of meeting any and all price competition? What are the terms of sale to be granted?
- Distribution. To whom shall the product be sold; that is, shall the firm sell directly to the ultimate consumer or through others, such as wholesalers? What channels of distribution should be used?
- Method of sale. How shall the goods be sold? Is it to be by personal solicitation, advertising, or direct mail? What sales promotion means shall be used?
- Organization. How shall salespersons be selected, and how shall they be trained? What is to be the basic organizational setup? Are there to be branch offices? Will sales supervisors handle all lines of product, or will each specialize? Into what departments shall the sales organization be divided? How many salespersons should be employed?
- Planning and control. How are sales territories to be set up? Shall sales standards be used as measuring sticks of performance? How will salespersons be compensated—salary, commission, bonus? What controls will be employed?
Questions relating to these six categories are found in every company, regardless of size. The answers to many depend, in large part, on the facts available within each organization.
CONTROLLER'S ASSISTIVE ROLE IN SALES MANAGEMENT PROBLEMS
As stated earlier, the final solution to sales management concerns must, of course, rest largely with the chief sales executive. However, an intelligent executive will always seek any assistance available. The controller can help by bringing to bear a scientific, analytical approach, using judgment as well as imagination. It should be realized that the solution in one firm may not be the solution in another and that the answers to today's problems may not be the answer tomorrow. The controller is of value primarily in getting the facts. In presenting the facts, though, it is necessary to merchandise or sell the product; the controller's approach must be one that invites reception.
The degree of assistance the controller can render in solving the previously mentioned sales problems is indicated in the following outline:
- Problems of product. The initial selection of the product or consideration of changes in the line, sizes, and colors should generally be based on the collective judgment of the marketing considerations by the sales manager, of production problems by the manufacturing executive, and of cost considerations by the controller. Costs are not the only factor in the decision, but they are an important factor. The chief accounting official should be able to indicate the probable margin on the product, as well as the margins on alternative choices. The controller should also be able to indicate the probable effect of volume on the margin or the effect of changes in quality, composition, and manufacturing processes on the cost to make or sell.
In the continuous reviews of sales trends, the controller may be able to identify unfavorable trends that might call for redirection of the sales effort or a change in product.
- Problems of price. In many companies, pricing procedures are not reviewed on a periodic or methodical basis. The pricing procedure may not be responsive to increased costs. Although cost is not the only determining factor, it must be considered in maximizing the return on investment. The controller must be able to provide all the available information. Total costs, marginal or differential costs, out-of-pocket costs, or cost differences must be considered in developing the price structure. This is true for competitive bids or establishing price lists for the usual type of sale.
In an analysis of sales volume and related prices, it may be revealed that unfavorable variances often have resulted from salespersons or sales managers having too much authority in setting a selling price. As production costs change, the information should be communicated to the sales executives for consideration of appropriate price changes. Also, assistance should be provided in setting volume price breaks for different sizes of orders.
- Problems of Distribution. The controller contributes the cost analysis necessary, as well as a review of statistics for unfavorable trends in distribution. Being able to provide indications of the selling cost through the various channels of distribution, the controller should be on the alert for major changes in sales trends through particular channels or margins thereon. Frequently, there are chances to show ingenuity in analysis regarding types and sizes of accounts and orders to be sought. Questions of policy may relate to:
- (a) The minimum order to be accepted
- (b) Restriction of the sales effort on large volume accounts that purchase only low-margin products or are unprofitable because of special laboratory service
- (c) Desirability of servicing particular types of accounts through jobbers, telephone, mail order, and so forth
- (d) Discontinuance of aggressive sales effort on accounts where annual sales volume is too low
- (e) Best location for branch warehouses
- Problems relating to the method of sale. Many factors will determine the method of sale, and the sales management must make this determination in view of the long-term goals and objectives. The controller can assist by providing information on historical costs and preparing alternative cost estimates for various methods. For example, analyses could be made related to the distribution of samples and the impact on costs and sales trends. Cost data related to advertising programs are useful in making decisions for future media communications. Special cost structures can be developed for market-test situations to determine the cost effectiveness. In the long run, of course, the best method should result in achieving the greatest sales volume with the best return on investment.
- Problems of organization. Because the sales management function is dynamic, organizational changes are necessary to satisfy the new requirements. In making these changes, information related to potential sales by product or territory may assist in reassigning or hiring new salespersons. Also, comparative cost data on different organizational structures are useful in determining the change.
- Problems of planning and control. So numerous are the applications where the controller can be of assistance in planning and controlling the sales effort that only a few can be indicated. The controller is able to aid the sales executive in solving some of the previously mentioned problems through special studies, yet in the planning and control fields many of the controller's functions are repetitive. The accounting official may contribute in the following ways:
- (a) Sales budgets and quotas. Detailed records and knowledge about the distribution of sales by territory, product, and customer, coupled with the knowledge of the sales manager on product changes and trends, provide basic information necessary in an intelligent setting of sales budgets, quotas, and standards. The controller also may provide services in connection with forecasting and market studies.
- (b) Distribution expense budgets and standards. A history of past expenses as recorded in the accounting department provides much needed data in setting budgets and standards for the measurement and control of selling effort.
- (c) Monthly or periodic income and expense statements:
- (i) By territories
- (ii) By commodities
- (iii) By methods of sale
- (iv) By customers
- (v) By salespersons
- (vi) By organization or operating divisions
These and other analytical statements can provide a vast amount of useful information. The disclosure of the contribution to the net profit of each territory or some other factor analyzed, over and above the direct expense, may reveal spots of weakness.
- (d) Special analyses to reveal conditions needing correction or as an audit of performance:
- (i) Sales incentive plans. The probable cost of various plans as applied to the business and degree to which they are mutually profitable for the company and salesperson. A determination about whether they direct salespeople's efforts toward the most profitable products.
- (ii) Branch office and warehouse expense. Periodic reviews of expense, in relationship to sales, growth, and earnings of the activity.
- (iii) Customer development expense. Analysis of entertainment expense or other business development expense by customer, salesman, or territory, with emphasis on necessity and possible alternatives—all with reference to the related margin or profit.
- (iv) Salespersons' compensation and expenses. Review and analysis of sales-persons' salaries, bonuses, and expenses related to budgets, salary structure, and industry.
CONTROLLER'S INDEPENDENT ROLE IN THE PLANNING AND CONTROL OF SALES
As previously stated, the primary responsibility for the development of the sales plan and its subsequent implementation is that of the chief sales executive. But, as just commented on in the preceding section, the controller can be of substantial assistance to the sales executive in supplying analytical and historical data for use in planning and control decisions. However, it should not be assumed that the controller will provide only the data the sales executive wants and that the controllership role is by and large a passive one as to sales activity. Given the analytical background of controllers and their knowledge of the financial data concerning the company, they have a series of independent functions to perform in furtherance of a sound business plan and prudent control procedures. Some of their conclusions might not be in agreement with the initial thinking of the sales executive; and some of the procedures they develop might appear redundant to some salespersons. Yet to one sensitive to the need for financially sound policies and procedures, and the desirability of proper checks and balances, the role of the controller is indispensable. For most companies, the responsibility of the controller and staff extends to the following outline of functions in the development of a sound annual sales plan (as well as the entire annual business plan) and the related implementation:
- The planning phase
- (a) Development, and revision when required, of a practical set of systems and procedures for arriving at a suitable sales plan (and the entire financial aspects of the annual plan). This would include:
- (i) Outlining the steps in the planning procedure
- (ii) Assigning responsibility for each specific procedure to specific executive positions (with the concurrence of executive management)
- (iii) Providing the format in which the sales plan (quantified data) must be presented
- (iv) Examining the economic justification for certain decisions
- (v) Providing the schedule when the data are to be submitted
- (b) Ensuring that the cognizant sales executives have the necessary statistical and historical internal sales data required to develop a sound sales plan
- (c) Supplying the relevant analyses of past sales performance, including the significant trends and relationships, for the appropriate executives sales management.
- (d) Providing for an in-depth financial analysis and evaluation of the tentative sales plan, when completed by the marketing executives. The analysis should bring to the attention of the appropriate executive any inconsistencies, questionable assumptions, reasonableness tests, or other matters that warrant discussion. These could include adequacy of margins, comparisons with competitive prices, questions about market growth, economic comparisons of different product sales mixes, etc.
- (e) When the iteration is complete, preparing the consolidated sales plan with related supplemental adjustments for such matters as returns, allowances, and other sales deductions.
- (f) Incorporating the sales plan into the total business plan for the period involved, including comparative profit data.
- (a) Development, and revision when required, of a practical set of systems and procedures for arriving at a suitable sales plan (and the entire financial aspects of the annual plan). This would include:
- The control phase
- (a) Develop and revise (when necessary) appropriate financial control systems for the use of the cognizant executive.
- (b) Provide the useful and timely comparisons of budget and actual sales performance for the sales executive, by appropriate segment, and in an understandable form (by product, by territory, by salesperson, etc.).
- (c) Provide useful supplemental analytical data such as sales trends, gross margin trends, and relationships, market share information, sales effectiveness, and other control type information. These data can be furnished on a regular basis or when an observed unfavorable condition seems to be arising.
These are some of the basic functions performed by many controllers. In each situation, accounting executives will find ways in which their analytical capability and business acumen may be put to use.
CONTROL OF SALES
Sales must be controlled to achieve the best or expected return on investment. The optimum net income is realized only when a proper relationship exists among these four factors: (1) investment in working capital and facilities, (2) volume of sales, (3) operating expenses, and (4) gross margins. The accounting control of sales, therefore, relates to the reports analyzing sales activity that bring to light undesirable trends and relationships or departures from goals, budgets, or standards in the manner best calculated to secure corrective action.
SALES ANALYSIS
Getting at the Facts
The stress sometimes placed on sales volume can be misleading. If a business were to ignore the profit factor, it could probably secure any desired volume. Through the cutting of prices or through the spending of huge amounts on direct selling expense or sales promotion or advertising, volume itself could be secured. Yet what good would result? It is obvious that the implied factor is profitable sales volume.
If business is to achieve profitable sales, it must know where the areas of greatest profit are. This means both sales analysis and cost analysis. There is little doubt that the analysis of sales has reached different peaks of achievement in different firms and industries. Many large companies devote a great deal of time to this phase of marketing control and have well-developed programs. A large number of medium-sized or small firms have little or none. It is also probably true that the sales executive in consumer goods lines has many more facts than the industrial marketing executive.
The evidence is unmistakably clear in any business that overall or average figures are not sufficient. Such general information is of little value in making key marketing decisions and directing sales efforts. The data must be specific and related directly to the problem on which a resolution must be achieved.
Types of Sales Analyses Needed
What is needed, then, is detailed analysis to guide sales effort. Some required analysis relates solely to past sales performance as such. Other studies involve the determination of trends by comparison with previous periods. Still other reviews show the relationship to budget or standard, to gross profit, selling expense, or net profit. Analyses may be expressed in physical units, or dollar volume, or both.
The types of analyses frequently used are:
- Product—type of product sold, colors, sizes, price lines, style, quality (reclaimed material, odd lot, first quality)
- Territory —area used for sales direction—states, cities, counties, other marketing areas
- Channel of distribution—wholesalers, retailers, brokers, agents
- Method of sale—direct mail, house call, ad or coupon, delivered vs. nondelivered
- Customer—domestic vs. foreign, industrial vs. ultimate consumer, private vs. governmental, tabulated according to volume of purchases
- Size of order—average size of individual purchase
- Terms of sale—cash, cash on delivery (C.O.D.), regular charge account, installment, lay-away
- Organization—branches, departments
- Salesperson—either individual or groups
These analyses may be developed, not merely with regard to sales but through gross profit to profit after direct selling expense or ultimately to the net profit of the segment being measured.
Other analyses relating to unrealized sales may also be useful, for example:
- Orders received
- Unfilled orders
- Cancellations
- Lost sales
These studies may be used as an integral part of sales planning or to eliminate reasons for ineffective effort. Analysis of orders may be important where production is made to order. For example, all sales of a given size or type may be summarized to necessitate only one production run in the period.
Many subanalyses can be prepared. Thus, management may want to know not merely the overall sales by product but the product sales in each territory.
The controller may find that the sales manager can use certain of these analyses monthly or periodically—for example, sales by territory, by product lines, or by salesperson. Other analyses may be made only as a special investigation, when it is expected the tabulation will reveal out-of-line conditions. In any event, it is the controller's responsibility to design and install procedures and records in such a fashion that the maximum information is made available with the minimum of time and effort, both clerical and analytical. It is axiomatic that in many situations the company getting the information most quickly is in a better competitive position.
This information will answer the typical questions of an analytical sales executive: What was sold? Where was it sold? Who sold it? What was the profit?
Deductions from Sales
In any analysis of sales the importance of sales deductions should not be overlooked. Although reviews may relate to net sales, the clue to substandard profits may lie in the deductions—high freight cost, special allowances, or discounts. These factors may reveal why unit prices appear low.
Useful analyses and reports on sales deductions can be prepared. For example, an informative summary may be compiled to indicate the general types and amounts of sales deductions, namely, returns, freight allowances, price adjustments, or customer sales policy adjustments. It may be helpful, also, to prepare an analysis of deductions by responsibility—the manufacturing division for defective product, the traffic department for erroneous freight allowances, the sales division for allowances to retain customer goodwill.
Typical Conditions Found by Sales Analysis
In many businesses, a large proportion of the sales volume is done in a small share of the product line. Likewise, a relatively small proportion of customers will provide the bulk of the volume. Such conditions reflect the fact that only a very small part of the selling effort is responsible for most of the business. This information should prove useful to the sales executive. It might permit the concentration of sales effort and the consequent reduction in selling expense. Again, it might mean a change in territorial assignments of sales staff. Where product analysis reveals unsatisfactory conditions, a simplification of the product line may be indicated. Although the line may not be limited to only volume items, many sales managers are beginning to realize that not all sizes, all colors, and all varieties need be carried. Smart executives will let their competitors have the odd sizes or odd colors and concentrate on the more profitable articles. After all, the economies of production also must be considered in developing the product line.
Illustrative Use of Sales Analysis: Control Application
Some examples will help in illustrating certain benefits to be gained from sales analysis. Assume a case where the sales executive has just been advised by the accountant that sales for the month then ended total $125,000. Assume further that this is $15,000 lower than the preceding month and that the aggregate volume failed by $25,000 to meet the commitment to the chief executive. What can the sales manager do with merely the information that sales were $125,000? The answer, of course, is not very much. It is the position of a hunter who has a shotgun but needs a high-powered rifle. This sales manager's controller has done a poor job.
Now assume that an analysis of sales by territories is made available. The results might be as shown in Exhibit 2.1. This analysis gives the sales executive some useful information. Instead of prodding the managers of all territories, the sales manager can concentrate on the poor performers—B, D, and C, probably in just that order.
If more than one salesperson is assigned to a territory, a further analysis of the substandard territories could prove useful. Although territory B, for example, was badly under budget, it could well be that some of the salespersons did a good job. The picture might appear as in Exhibit 2.2.
It is evident that something went wrong in the areas covered by Smith, Jones, and Black. Where did they fall down? A subanalysis of the sales by Smith might reveal the data in Exhibit 2.3.
Now we are beginning to get at the root of the trouble! Smith has done much better than expected on hard resins and glue, getting what sales management feels is the maximum share of hard resin sales in the territory. While there is still an unrealized share of the potential sales, Smith exceeded the budget. However, Smith has performed very poorly on molding-compound. A review of Smith's call reports indicates that important users of molding compound have not been called. For example, Smith is completely overlooking the molders of electrical fixtures, yet this is where the greatest potential lies. The sales, as an analysis by customers shows, have been only to molders of bottle caps and the like. Now the sales manager has the facts and can take corrective action, and the controller can feel that the analysis has been useful.

EXHIBIT 2.1 ANALYSIS OF SALES BY TERRITORIES
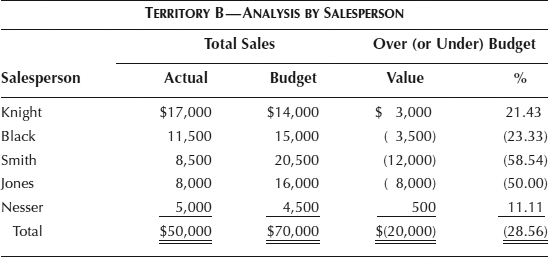
EXHIBIT 2.2 ANALYSIS OF SALES BY SALESPERSON
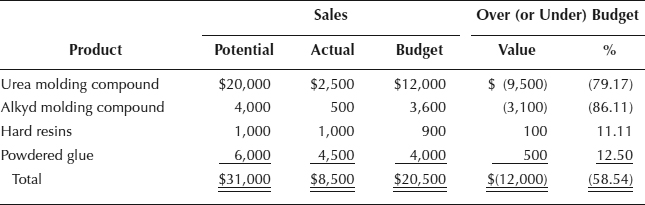
EXHIBIT 2.3 SUBANALYSIS OF SALESPERSON BY PRODUCT
Other Uses of Sales Analysis
In many businesses, particularly small concerns, budget applications are neither well developed nor applied. Budget information by product or by salesperson is not available. In some instances, the cost of maintaining an elaborate budget system is not cost effective. Sales analyses may be made that are useful but not related to a budget. An analysis by customer by commodity class, indicating sales this month, sales same month last year, sales year to date, and sales last year to date will provide some comparative data as well as trends. If the sales executive has detailed knowledge of each territory and general level of activity by customer, the report can be of use in directing the sales effort. Observations can be made about which customers are growing or declining in sales volume. With knowledge of the margin by commodity class, it can be determined if growth is in the profitable lines or on the low margin products; this may indicate that prices should be reviewed.
There are many simple analyses that can be made to guide the sales effort. The controller should continuously work with sales executives to develop those reports that are most useful, like special or one-time reports. The information developed should be interpreted and the important trends or measures should be highlighted.
Other uses of sales analyses that may be considered are:
- For sales planning and setting of quotas. Past experience is a factor.
- For inventory control. To properly plan inventories, a business should be familiar with past sales and probable future trends in terms of seasonal fluctuations and type of product.
- For the setting of certain sales standards. Here, also, past experience is a factor.
- For the better distribution of sales effort in territories. It may well prove that the business is concentrating its effort in too restrictive an area. Consideration of potential sales, competitive conditions, and cost factors may dictate a wider coverage. Again, analysis might reveal that the territory is not being fully covered.
- For better direction of sales effort on products. A study of sales and the potentials may reveal the restriction of sales effort to certain products to the neglect of other and more profitable ones. Also, a comparison of sales by product with previous periods will reveal trends. If the trends are away from the more profitable lines, corrective action may be necessary.
- For better direction of sales effort in terms of customers. Analysis by customers should reveal trends about the types of merchandise purchased by each customer. Also, comparison with the sales of a similar period for the previous year will reveal facts on whether the company is making headway in securing the maximum amount of profitable business from the customer. Analysis by customer account, coupled with other information and discussions with the sales manager, will show certain accounts that cannot possibly provide a profitable volume, even if developed. This, too, may permit greater utilization of sales effort elsewhere.
Sales and Gross Profit Analysis
Sales efforts, as previously stated, should be directed and focused on profitable volume. To accomplish this, sales executives must be provided with all the facts related to profit. Therefore, analysis of sales must include a detailed analysis of contribution margin and/or gross profit. For example, a sales report by a salesperson should indicate the comparative gross profit by periods as well as sales. Although high gross profit does not necessarily signify a high net profit, since the selling costs may be excessive, it is an indicator. It certainly serves as a guide, however, in determining areas for concentration of the sales effort.
One other aspect of gross profit deserves comment. Variations in gross profit may result from changes in the selling price, product sales mixture, returns, or volume (largely controlled by the sales executive) or from changes in manufacturing efficiency (controlled by the production executive). These facts should be recognized when reviewing changes in gross profit. The causes should be isolated. If a standard cost system is in operation, this process is simplified somewhat. In this case, the best measure of sales performance will be standard gross profit. When the standard eliminates the manufacturing efficiency factor, then the sales department is generally responsible for the result, as well as the volume variance.
Limitations of Sales Analysis
Sales analysis is only one management tool used by the sales executive. Such analysis, how-ever, is no substitute for the professional leadership needed to properly direct and manage the sales function. It is obvious that analysis of the actual sales volume must be used in conjunction with other factors like sales potential, plans, budgets, standards, historical performance, industry comparisons, manufacturing costs, and operating expenses. Most important, the sales executive must use the data to make effective decisions.
Although sales volume analyses can be used extensively in measuring or studying sales performance, those using the data must recognize that high volume does not mean high profits. Profits will certainly vary, and a business does not earn the same rate of profit on all products. An analysis of sales volume alone will not provide sufficient information to maximize the return on investment on any given product. Many other factors must be considered. Even with some limitations, the analysis of sales is an integral part of any well-managed sales function.
SALES PLANNING: BASIS OF ALL BUSINESS PLANS
Sales analysis is a useful function. As mentioned in the prior section, it may be applied to better direct and control sales effort, and for other related sales control activities. Yet, one of the other principal applications is to sales planning; that is, in helping to determine a proper sales level (by product or territory or salesperson, etc.) for the next year or two of the annual business plan. The application to sales planning is also used in selecting the more profitable sales potential areas for the strategic, or long-range, plan.
It will bear mentioning that the sales plan is the foundation for the entire system of plans including: the production plan, the marketing plan, the research and development plan, the administrative expense plan, the facilities plan, the working capital plan, and the financing plan. Thus, the sales plan is so pervasive and fundamental that it is in the interest of the company to develop the best possible plan, using all fairly available information (both internal and external).
A reasonable amount of time will be spent in developing the short-term sales plan or budget for the next year in considerable detail. But the chief sales executive has to keep in perspective the relationship of the immediate short-term or tactical plan to the strategic longer-term plan. The flow of products and services in these two plans may be as illustrated in Exhibit 2.4. As a practical matter, the sales manager often will view the marketing task as threefold:
- Sales of existing products and/or services to existing customers
- Sales of existing products/services to new customer
- Sales of new products to existing, as well as new customers
Sales often may be estimated by these segments.
These facets of the near- and long-term sales plans, as well as the increase in sales from acquisitions (newly acquired companies or products), are shown in Exhibit 2.4. All these sales targets may be necessary to avoid the natural decline in sales over a period of time and to reach the long-term corporate sales objective.
STEPS IN DEVELOPING THE NEAR-TERM SALES PLAN/BUDGET
Each company has its own way of developing the sales plan or budget, and providing such information to those executives, who, in turn, use it for developing their segment of the total business plan.
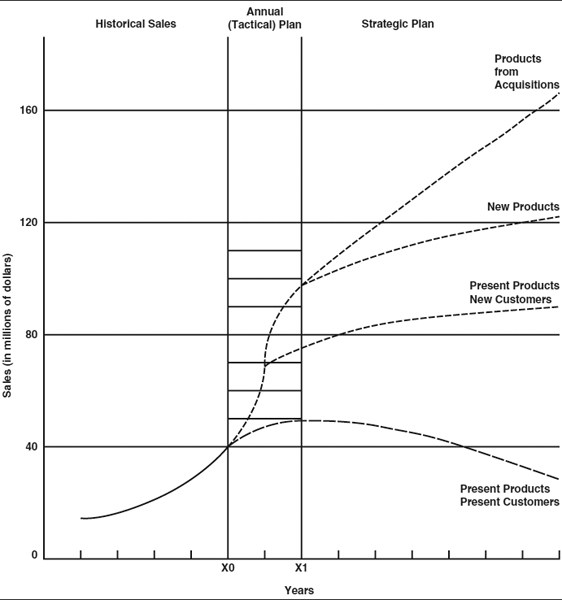
EXHIBIT 2.4 STRATEGIC AND TACTICAL SALES PLAN
The planning steps outlined next are somewhat typical when industry estimates of future sales levels are available, or when some useful external data may be secure, and when the involved executives are accustomed to being provided with relevant sales and gross profit analyses.
- The chief sales executive who is responsible for preparing the sales plan, also called the sales budget, and meeting it, is given some or all of the following data:
- (a) Computer sheets or other worksheets in proper format for providing the sales estimate, by month, and by product or salesperson, for the planning year
- (b) Sales performance for the last year (estimated for the balance of current year) or two by salesperson, and perhaps subanalyzed by territory or customer—in monetary or physical units
- (c) Industry data on expected next-year total sales
- (d) Any other analyses based on external information, developed by the market research department or economist or perhaps the controller, giving a clue as to expected sales (correlation techniques, etc.; U.S. government statistics) or business conditions for the coming plan year
- (e) Any other data the sales manager or salespersons reasonably request as helpful in developing sales estimates
- (f) Analyses, if available, giving the estimated sales impact of planned sales promotions, and reasons for the cause or precise location of below-plan performance in the sales area (current year)
- (g) Any guidance, or expected sales levels that the CEO or other influential executives (e.g., manufacturing executives as to new production capacity) may wish to provide
- The sales executive provides an estimate of sales for the planning year in appropriate detail (by product, salesperson, or territory). While the sales executive may prepare such an estimate unaided, it is preferable to ask each salesperson (through appropriate organization channels) to make an estimate of sales for that person's assigned area or product, in appropriate detail, by month or other time period, for the coming year. The chief sales executive, directly or acting through territorial or product sales managers, will provide guidance to the sales staff on such subjects as:
- Percent sales increase expected
- Estimated impact of planned promotional programs
- Competitive actions and the like
Assuming each salesperson prepares their own estimate (by customer, product, etc.), as the plan is forwarded up the organization structure to the chief sales executive, it may be modified by the intervening sales executives—each giving reasons for the changes.
- Finally, at the top executive level, the estimates are consolidated (probably by the controller's staff) and company totals determined.
The summarized sales plan, following the territorial organization structure is illustrated in Exhibit 2.5. Supporting territorial budgets for each territory sales manager, by salesperson, would be available from the database. Other analyses, such as by product, could be prepared.
- Each proposed sales level is discussed by executive management as to acceptability, reasonableness, etc.
- When the sales budget is tentatively approved (an iterative process) then other functional executives who need the data are provided with it so they can develop their segments of the annual plan (the marketing plan, production plan, research and development plan). Several iterations can take place (adjusting for capacity, competitive actions, probable lack of raw material, etc.) until an operating plan is agreed upon.
EXHIBIT 2.5 SALES PLAN BY TERRITORY
- The operating budget and capital budget, together with the related financial statements, are consolidated and tested for financial acceptability, and so on. Through iteration a final plan is arrived at.
- When the board of directors approves the plan, each segment becomes a commitment for the plan period by the relevant or responsible executive.

CONTROL PHASE
In the context of the budgeting process (a two-pronged device consisting of the planning phase and the control phase) the steps discussed in Section Section “Steps in Developing the Near-Term Sales Plan/Budget” complete the planning phase when the sales plan is approved by the board of directors. Then, the task consists of, among other things, monitoring actual sales results and directing the sales effort so that the plan is achieved. This is generally identified as the control phase. The implementing steps are essentially as:
- Actual performance is compared with plan (or quota), for each salesperson involved in the sales effort, for the appropriate time period, which may be the day (cumulative), week, or month.
- The data are analyzed, much as described earlier, to determine the cause of the subperformance.
- Corrective action, if needed, is taken by the sales executive to get sales “on plan.” This might include special sales promotion, etc., especially if the cause of under-plan sales is a general condition, that is, not one induced by the lack of effort of a salesperson.
- Aside from analysis of actual and planned sales, a review of some selected statistical performance measures may provide clues on how sales could be improved (e.g., conversion rate of prospects to customers). See the sections on standards and benchmarking.
METHODS OF DETERMINING THE SALES LEVEL
The development of a sound sales plan, together with the program for directing the sales effort, ultimately must rest largely on the judgment of the cognizant sales executive. The means used to arrive at a decision obviously may influence its quality. Ordinarily, weight must be given to both external and internal factors. External factors (including such elements as general economic conditions, industry trends, total market potential, and competitive actions or reactions) are beyond the control of the individual company, but nevertheless may largely prescribe the sales potential. Internal factors relate to conditions within the entity and are composed of matters such as production capacity, product quality, sales experience, history, special advertising and sales promotion programs, pricing policy, and sales method changes.
In this section, some of the more commonly used methods of estimating sales levels, to help the sales executive reach decisions or judgments, are discussed. What system will be used may depend on several related attributes:
- Time. The time span available, the frequency of the data
- Resources needed or available. Manpower, computers, financial sophistication, cost
- Data input. What is needed, consistency, availability, variability
- Output. Reliability, extent of detail, capability of detecting trend changes, capability of revealing direction changes that have taken place
For the knowledge of the controller, the more or less proven techniques of forecasting sales demand may be categorized in these three groups:
- Mathematical/statistical methods
- Time series analysis
- Correlation
- Judgmental methods (nonstatistical)
- Estimates of salespersons
- Customer surveys
- Executive opinion composites
- Other methods
- Share of market
- End-use analysis
- Product line analysis
- Market simulation
- Combinations of methods
Mathematical/Statistical Methods
The various mathematical/statistical methods usually require the services of a person or per-sons skilled in the techniques (statisticians, economists, and perhaps accountants). Basically, a statistical technique is applied to a series of relevant numbers to arrive at a forecast of sales for the industry or company. Then, this forecast is modified by the expected impact of sales efforts, promotional campaigns, and so forth, to arrive at a sales plan for the company. Two types of mathematical applications are addressed here.
Time Series Analysis. With the use of a model already programmed in the computer, or by the application of the well-known least squares method, an existing series of values is converted into a trend, and extrapolated for a future time period. Basically, the existing series of values is isolated into its statistical components:
- Secular or long-term trend
- Cyclical movements
- Seasonal patterns
- The remaining random fluctuations
The long-term trend is projected to estimate the future sales for the planning periods.
Correlation Analysis. As the name implies, a series is located with which the company sales, or sales of a particular product line, seem to correlate or move sympathetically. Presumably, the data are readily and timely available, are reliable, and are those that lead the company sales. The annual product sales are plotted against the index and, based on the leading factor, calculated for the planning period. Some illustrative correlation bases could be the U.S. Department of Commerce composite index of leading indicators (discussed later) or Series No. 20, contracts and orders for plant and equipment, also issued by the U.S. Department of Commerce, or the Federal Reserve Index of Industrial Production.
Other statistical methods, such as the Box-Jenkins computer-based iterative procedure, or use of moving averages, can be employed.
Judgmental Methods
Another popular method is the gathering of opinions or estimates from several groups. Some common variations of this method are discussed.
Estimates of Salespersons. In using the estimates of salespeople, one method involves securing the estimates of the sales staff itself. Each salesperson is provided with a record of his or her sales, by month, for the past year or two. With this data and that person's knowledge of the sales territory and customer, an estimate by product and/or customer is obtained from the person who will be responsible for securing the sale.
A variation of this procedure is to have the sales manager to whom the salesperson reports and the salesperson jointly arrive at a sales estimate.
Another procedure involving the sales department personnel is to secure the opinions of the various sales managers—the product sales managers, division sales managers, or territory sales managers, together with the general sales manager. Through discussions and cross-checking, and considering the impact of sales programs, many believe a reliable estimate can be secured. Of course, the extent of knowledge of the sales manager level must be considered. Hopefully, they are close enough to the firing line to know the sales conditions, products, and customers.
The use of only sales department personnel has both advantages and disadvantages:
- Advantages
- The knowledge of the persons closest to the sales picture is used.
- Those who must meet plan have a voice in setting it.
- Disadvantages
- The level may be biased in that sales personnel often tend to provide optimistic estimates when the business level is high, and too low estimates when the level is poor.
- The participants may not give proper weight to broad economic trends that the sales force or managers either do not recognize or fail to properly evaluate.
- If compensation levels depend on meeting the sales plan, a deliberate effort might be made to keep the estimate on the low side so that enhanced remuneration is more likely.
Care must be taken (by the CEO, other top executives, or the controller) in weighing the sales personnel opinions.
Customer Surveys. The practice of asking customers for their estimate of purchases for the coming year often is used when there is no other source of reliable and specific data to make a sales estimate. It may be employed when there is a good relationship between the salesperson and the customer, and when the customers tend to be very large and limited in number. An example is the glass companies who make the windshields and glass windows used by automobile manufacturers.
The disadvantages include the facts that:
- The user may be ill-informed or uncooperative in such sensitive matters.
- It is time consuming if many customers must be contacted.
The possible advantages are:
- It may be the only suitable manner of preparing a sales plan.
- It gives the questioner an opportunity to delve into the thinking of the customers about the business outlook.
- It is an opportunity to secure information directly from those who will be using the product.
Executive Opinion Composites. Another commonly used and convenient method of estimating future sales volume is by securing opinions from a group of top and middle management executives who have reason to be familiar with the industry and company sales picture. The method involves simply securing the estimates from a group of executives, perhaps weighting them, and then combining the opinions. Thus, the CEO and sales, production, research, and financial executives may be contacted, and weightings given to their opinions, depending on their knowledge of the market and perhaps on the accuracy of their past estimates. Each executive may determine his expectation based on his own methods; and the groups may meet to discuss the levels and the basis for the opinion.
While this method may provide a broader base than from sales personnel only, and be more convenient, if the executives don't really know the market, then the opinion may be one big guess, based on few facts.
Other Methods
There are numerous other methods for developing sales forecasts or plans, some of which may be used alone or in combination with other procedures. A few brief comments follow.
Share of Market. For some types of products the total market is well known. In addition to the industry total unit volume and/or dollar volume, the rate of growth has been calculated, and often the estimated sales for the next year or two have been determined—perhaps by the industry association. In any event, the planner knows what share of the market the company has secured in the past. This market share, say 27 percent, adjusted for the estimated impact of special sales promotions, or guessed competitive activity is applied to the projected total market to arrive at the company segment of, for example, 29 percent of the estimated industry sales for the coming year.
End-Use Analysis. This technique depends on having a sound estimate of the total end-use market for which products the company's articles serve as component parts or elements. Again, to use the automotive industry as an example, if the expected unit sales of automobiles are known or have been estimated, then the supplier company can estimate its probable sales for the planning period for its product, the new car business. This market, plus the estimated replacement business, or other business, can be combined to arrive at sales expectations. This method bears a close relationship, in some cases, to the customer survey procedure.
Product Line Analysis. Quite often major products are sold through different channels of distribution or methods of sales than other products, and the sales and sales effort may be managed by product line. Under these circumstances, a company's internal sales (and gross profit) analyses by product, subanalyzed by territory, and so on (as discussed earlier in Section “Relationship of Entity Goals to Performance Standards” ) may be the starting point of determining the sales estimate, supplemented by some of the other techniques to arrive at the sales plan.
Market Simulation. This technique ordinarily involves the use of a computer, and the construction of a mathematical model of the market. Modifying input for the different factors that influence the market permits the calculation of various sales estimates. This is another helpful tool, often developed by the market research organization, that can assist in arriving at a realistic sales plan.
It should be understood that, whatever estimating technique is used:
- Even a good forecast reduces only some of the risk that confronts sales management.
- It is often helpful to compare the results of several forecasting methods.
- Some of the simplest methods work best, because they are more easily understood; the heart of good forecasting probably often is intelligently based intuition on the part of sales management.
USEFUL SOURCES OF FORECASTING INFORMATION
Business executives long have been intrigued by the promise of a practical indicator of business trends that could be useful in their business forecasting. Some have found broad economic measures helpful, such as gross national product (GNP), new car sales in a given territory, etc. But for many, no practical guide has been located either for the business as a whole or for major lines. Many of the broad indicators have suffered from late availability, significant revisions, inaccuracies in compilation, and components out of touch with the market, to name a few. These executives, therefore, have encouraged their staffs to develop in-house models, perhaps based on some readily available indicators. Sometimes these models have been built from data furnished by commercial banks, or in other instances developed from a factor, such as regional car sales, that an executive has noticed appears to correlate quite closely with the company's sales experience on certain products.
Given the conflicting or indecisive signals put out by some indicators and the inability to find a suitable one, sometimes the intuition of the chief executive or chief sales executive is one of the best guides.
The controller should be aware of external sources of sales forecasting data just in case the present sales estimating techniques could stand some testing or improvement.
Some Specific Sources
There are numerous sources, ranging from the federal government to selected financial ser-vices, such as Standard & Poor's (S&P) and Moody's, that supply information which may be useful in sales forecasting. Market planners, market research analysts, and many financial executives often are familiar with them. Of course, libraries may provide assistance on this subject. The secret is to find an index or economic data useful in a particular business. A partial outline of some sources follows:
- U.S. government Department of Commerce
- (a) Bureau of Economic Analysis (BEA)
Includes cyclical indicators and economic measures published in the Survey of Current Business
- (b) Department of Labor Bureau of Labor Statistics
- (c) Department of Agriculture
- (d) Bureau of Mines
- (e) U.S. Government Printing Office
- (a) Bureau of Economic Analysis (BEA)
- Commercial banks1
- Other sources
- (a) Trade associations
- (b) State governments
- (c) Federal Reserve Board
- (d) Universities (economics departments and schools of business, etc.)
- (e) Financial services providing economic data for pay
- (f) Numerous business magazines, such as:
- (i) Survey of Current Business
- (ii) Business Week, with its weekly “Business Week Leading Index”
- (iii) Fortune magazine (its “Forecast”)
- (g) Libraries
Validity of Economic Indicators
While the wealth of economic data provided by Washington is useful, the data need careful interpretation by those who know what to look for.
FORECASTING THE BUSINESS CYCLE2
Nature of the Business Cycle
A business cycle is a recurring series of expansions and contractions, involving and driven by a vast number of economic variables, that manifests itself as changes in the level of income, production, and employment. As will be described in the next section, these swings can have a profound impact on a company. A business cycle tends to be long-term in nature, and is very difficult to predict in terms of length or intensity. It is driven by so many variables, most of which interact with each other, that it is excruciatingly difficult to determine the exact causes of previous cycles and the timing of the next one based on those variables.
Though the exact causes of the business cycle are difficult to discern, there are essentially two types of variables that cause business cycle changes to occur. The first is an exogenous variable. This is a variable that impacts the economic system, though it is not an integral component of the system. For example, a bad rainy season will impact the crop yields in the farming community, which in turn reduces the amount of purchases by farmers for the next season's crop, which in turn impacts the activity of the suppliers of those purchases, and so on. Another exogenous variable is a war, which can wreak enough destruction to entirely shatter an economy. These types of variables can, to some extent, be called “acts of God.” The other type of variable is the endogenous variable. This is a variable that impacts an economic system from within. For example, overcapacity in the resin-production industry causes suppliers to reduce their resin prices to plastic molding companies, which in turn can now reduce the prices of their products, which creates an increase in sales, and contributes to an increase in the level of economic activity. Other examples of this type include the demand for products, and pricing changes.
The typical company operates within a single sector of the economy, where a single major shock, either of the endogenous or exogenous variety, can cause immediate and massive changes, since individual sectors are much smaller than the national economy, and so can be severely impacted by smaller events. For example, an increase in the price of aviation jet fuel will cause the airlines to increase their prices, which reduces the number of seats filled, which drives down airline profits and forces them to postpone orders for new jets, which in turn harms the airline manufacturing companies and their supporting groups of suppliers—all due to an increase in the price of jet fuel, which is just a single variable.
Consequently, a controller may not be overwhelmingly concerned with the operations of the entire national or international economy, since the typical economic contraction corresponds to a drop in GNP of only a few percentage points. However, industry-specific changes within that larger economy can be truly catastrophic, and it is within this smaller economic environment that a company operates and must make management changes. This leads us to the next section, which covers the specific problems a company faces as a result of changes in the business cycle.
Impact of the Business Cycle on the Corporation
What happens to a company when the business cycle changes to a new phase, either upward or downward? We will begin with the impact of an economic contraction.
When management realizes that sales have declined, it must contract the business. One of the first steps taken is to reduce inventories, so that the company is not stuck with a large investment of products that will be at risk of becoming obsolete before they can be sold. One way to reduce inventories is to sell them off at reduced prices, but this cuts into gross margins and also fills the distribution pipeline, so that no additional sales can be made until the pipeline clears. The more common approach is to reduce the production staff and all related overhead staff with a layoff, the extent of which will be driven by management's perception of the depth of the upcoming cyclical decline. Management will also likely curtail capital expenditures and increase controls over incidental expenses. Further, the controller will be called on to tighten credit to customers and heighten collection activities to ensure that accounts receivable do not include any bad debts, and that collections are made as soon as possible. If there are excess funds available, management will likely use them to pay down debt, so that fixed costs are reduced to the bare minimum in anticipation of poor sales conditions at the bottom of the economic cycle.
Also during business downturns, there will be a few adventurous companies that will buck the industry trend and expand. They do this because they anticipate a short downturn in the economy, and they want to pick up new business, either by undercutting competitors or (more commonly) by waiting until financially weaker companies begin to fail, and then buying them. They may also take advantage of lower real estate and equipment costs during these periods to add to their capacity with inexpensive new production facilities. This strategy is possible only if a company has substantial cash reserves or available debt, and has an aggressive management team that is willing to take chances.
When the economy begins to turn in an upward direction, management must make several contrary decisions. The first one is to ramp up existing production capacity, which may have been shuttered, and now requires refurbishment before production can begin. Then management must determine the extent to which it wants to rebuild its inventory levels to anticipate renewed sales. This is a critical decision, for overproduction in a weakly rebounding economy will create more inventory than is needed, whereas producing too little in the midst of a strong economic rebound will result in sales being lost to more aggressive competitors. If the rebound is sudden, the company must spend more money on staff overtime and rush equipment deliveries to bring production back up to speed as soon as possible. Credit policies likely will be loosened in order to bring in new business, and management must decide on how much new capital equipment to purchase, and the most appropriate time for when to acquire it.
All of the changes noted here, for either an increase or decrease in the business cycle, call for changes in a company's operations that will certainly have some impact on profits, but even more so on the level of working capital and fixed assets. For example, waiting too long to cut back production will result in an excess investment in inventory, as well as any new capital projects that were not curtailed in time. The reverse problem arises during an economic upswing, when reacting too slowly will result in a cash inflow from the sale of all inventory, followed by the loss of additional profits because all of the inventory has been sold, and there is none left to sell. Thus proper management of working capital and fixed assets lies at the heart of management's decisions regarding how to deal with changes in the business cycle.
Elements of Business Cycle Forecasting
In this section, we will review who does forecasting, what information they forecast, and the methods they use for doing so.
Forecasting is conducted not only by various branches of the federal government, such as the Department of Commerce and the Federal Reserve Board, but also by a number of universities and private institutions. The governments and schools do so as a public service, but the private groups do so for an entirely different reason—they create tailored forecasts that churn out estimates on very specific items, such as stock prices or exchange rates, that are requested by top-paying clients. These forecasts commonly cover a series of quarterly periods, which, due to the short time frames involved, are much more difficult to predict with any degree of reliability than the annual forecasts that were more common in the last few decades. The governments and universities focus on such macro issues as the Gross National Product or the rate of inflation. The trade group to which most of these organizations belong is the National Association of Business Economists.
There are four primary methods used to arrive at forecasts. Since each one is based on different information and may arrive at somewhat different results, it is common for forecasters to blend the results of two or more methods to arrive at their estimates of future conditions. The methods are:
- Anticipation surveys. These are surveys of key people in the business community. The purpose of these surveys is to collect information about the intentions of the survey participants to engage in capital purchases, acquisitions, changes in headcount, or any other steps that may impact the economy, and then aggregate this information to arrive at general estimates of trends.
- Time series models. These are trend lines that are based on historical information. For a forecast, one finds the trend line that fits a similar set of previous conditions, and fits it to the current conditions to arrive at a trend line of future expectations. These can be relatively accurate in the short run, but do not generate good results very far into the future.
- Econometric models. These are highly complex and iterative models that simulate the real economy, and are frequently composed of hundreds of variables that interact with each other. These can yield good results over periods longer than those predicted by time series models. However, changes in the results of the models are difficult to explain, given the complexity of the underlying formulas.
- Cyclical indicators. These are the leading, coincident, and lagging indicators that foretell changes in the economy. This method is a good way to confirm the existence of business cycle changes that have been predicted by other forecasting methods. A leading indicator is something that changes in advance of an alteration in a business cycle, such as the number of new business formations, new capital expenditure requests, construction contracts, the length of the average work week, layoff rate, unemployment insurance claims, profit margins, new orders, investments in residential structures, capacity utilization, and new bond or equity issues. These can change anywhere from a few months to over a year in advance of a related change in the phase of the business cycle. A lagging indicator is something that changes after an alteration in the business cycle has occurred, and is used by forecasters to confirm the business cycle change that was indicated by leading indicators. Examples of lagging indicators are investments in non-residential structures, unit labor costs, and the amount of consumer credit outstanding.
The exact forecasting method used depends on the person doing the forecasting, and is largely influenced by judgment. The reason why judgment is such a necessary factor in forecasting is that all of the forecasting methods, with the exception of anticipation surveys, are based on the interpretation of historical economic data, which may no longer impact the economy in the same manner as it did when the various models were constructed. Thus, having an in-depth knowledge of the current economic situation, and using their information to adjust the results of quantitatively derived forecasts is the key difference between a quantitative analyst who does nothing but tweak the numbers, and a great forecaster who consistently outperforms the outcomes predicted by the various models.
In addition to judgment, forecasters will use numeric weighting schemes, where they give greater value to the results of certain forecasting models or specific variables, depending on their experience of past forecasting results, or their guesses regarding changes in the economy for the period being predicted. Some forecasters will even combine and average out the predictions of groups of other forecasters, on the grounds that this will create a consensus opinion that has a better chance of being accurate. However, there may be a wide dispersion in the various forecasts being predicted, which makes it difficult to arrive at a time period for forecasted changes in the business cycle based on this approach.
Once the forecasters make their predictions, they also compare their forecasts to the actual results as that information arrives. They will then spend a great deal of time modifying their forecasting methods to make their next set of forecasts more closely match the future results. This is an ongoing process that never ends, because the underlying variables that drive business cycles are constantly altering the degrees of force with which they impact the economy. Also, old variables may eventually have so little impact on business cycles that they are dropped entirely from the forecasting systems, while new variables must be researched and inserted into the models. Thus, the after-the-fact review of forecasting models and their component parts is a major forecasting task.
When reviewing the effectiveness of the variables that comprise a forecast, there are several factors to consider. One is that a small pool of variables may result in an incorrect forecast, because each of them may be adversely impacted by exogenous variables that yield results not truly representing their impact on the business cycle as a whole. However, by using a large number of variables in a forecasting model, one can tolerate a minority of variables that yield incorrect results, while still arriving at an overall forecast that is made accurate by the sheer volume of variables included in the model. Another item to review is the number of months by which leading indicators presage a change in the business cycle. Though there may be historical justification for using a certain number of months in a forecasting model, these periods can change, sometimes to the extent of having a leading indicator turn into a lagging indicator. Also, the selection process for variables needs to be very in-depth before they are added to a forecasting model. For example, a new variable should be thoroughly researched to determine the extent of its linkage to a business cycle, how well it predicts business cycle behavior, how consistently it does so, and also how frequently information about the variable is reported (so that it can be included in the forecast in a timely manner). Only if all these questions receive favorable answers should a new variable be included in a forecasting model.
Having briefly described who creates forecasts, what information they issue, and how they arrive at these forecasts, we now turn to the role of the controller in creating forecasts that are tailored for the use of company management.
Business Cycle Forecasting at the Corporate Level
What can a controller do in his or her role as a financial analyst to provide business cycle predictions to the management team? There are several possible routes to take.
The main factor a controller must decide on is balancing the time needed for forecasting against the perceived value of the information. For example, if a company has a stable sales base that rarely varies, irrespective of what stage the business cycle is currently in, then there is no reason to track cycles very carefully. Also, if the accounting function is understaffed, the needs of day-to-day activities will probably supersede any demands for forecasting. However, if a controller can prove that the deleterious effects of not tracking business cycle conditions will lead to company losses that significantly exceed the cost of having extra staff on hand to perform the analysis, then this second factor disappears.
Let us assume that there is some time available for forecasting work, and that business cycles have a sufficient impact on company conditions to be worthy of review. If so, here are some possible actions to take to obtain, analyze, and report on business cycle forecasts. They are listed in ascending order of difficulty:
- Report on published forecasts. There are forecasts published by nearly every major business magazine for the economy at large, which can be easily extracted, reformatted into an internal report, and presented to management, perhaps as part of the monthly financial statements. Several key advantages are that the information is fairly accurate for the entire economy, it is prepared by professional forecasters, and it is essentially free. The problem is that each company operates in a smaller industry within the national economy, and as such is subject to mini-business cycles that may not move in lockstep with that of the national economy. For this reason, the reported information may be only generally relevant to a company's specific situation.
- Subscribe to a forecasting service. A company can pay a significant fee, probably in the five-to six-figure range, to a forecasting service for more specific reports that relate to the industry in which it operates. This is a good approach for those organizations that do not have the resources to gather, summarize, and interpret economic data by themselves. However, some industries are too small to be serviced by a specialized forecasting service, or the fee charged is considered too high in comparison to the value of the information received.
- Develop an in-house forecasting model. In cases where a company either wants to run its own forecasting model, or there are no forecasting services available that can provide the information, and it is deemed relevant, it is time to try some in-house forecasting. This effort can range from a minimalist approach to a comprehensive one, with each level of effort yielding better results. The first step is to go through the steps noted in the preceding section to find the right kinds of data to accumulate, followed by implementing a data-gathering method that yields reliable data in a timely manner. Then, one must work with management to determine what resulting information is desired (usually a sales estimate). Then the controller must arrive at a methodology for translating the underlying data into a forecast. Then the controller should develop a standard reporting format that imparts the results to management. This report should include the underlying assumptions and data used to arrive at the forecast, so that any changes in the assumptions are clearly laid out. Finally, there should be a methodology for comparing the results against actual data, and adjusting the forecasting methodology based on that information. Though this approach is a time-consuming one, it can yield the best results if a carefully developed forecasting system is used.
For example, let us assume that a controller of a sport rack company has elected to use the last of the above options for creating forecasting information. Sport racks is a very small niche market that creates and sells racks for skis, snowboards, bicycles, and kayaks that can be attached to the tops of most kinds of automobiles. The controller wants to derive a forecasting system that will give management an estimate of the amount by which projected sales can be expected to vary. She decides to subdivide the market into four categories, one each for skis, snowboards, bicycles, and kayaks. Based on a historical analysis, she finds that 25 percent of ski purchasers, 35 percent of snowboard purchasers, 75 percent of bicycle purchasers, and 30 percent of kayak purchasers will purchase a car-top rack system to hold their new equipment. The typical delay in these purchases from the time when they bought their sports equipment to the time they bought sport racks was six months. The controller finds that she can obtain new sports equipment sales data from industry trade groups every three months. Given the lag time before users purchase car-top racks, this means that she can accumulate the underlying data that predict sport rack sales and disseminate them to management with three months to go before the resulting sport rack sales will occur. Thus, she concludes that these are usable data.
The next task is to determine the company's share of the sport rack market, which is readily obtainable from the industry trade group for sport racks, though this information is at least one year old. Given the stability of sales within the industry, she feels that this information is still accurate. She then prepares the report shown in Exhibit 2.6. It shows total sports equipment sales for the last quarter, uses historical percentages to arrive at the amount of resulting sport rack sales, and then factors in the company's market share percentage to determine the forecasted sales of each type of sport rack. By comparing this information to the previously forecasted sales information, the report reveals that the company should significantly ramp up its production of snowboard sport racks as soon as possible.
The example used was for an extremely limited niche market, but it does point out that a modest amount of forecasting work can yield excellent results that are much more company-specific than would be the case if a company relied solely on the forecasts of experts who were concerned only with general national trends. For most companies, there will be a number of additional underlying indicators that should be factored into the forecasting model; however, the work associated with tracking these added data must be compared to the benefit of more accurate results, so that a controller arrives at a reasonable cost-benefit compromise.
SALES STANDARDS
Definition of Sales Standards
A standard has been defined as a scientifically developed measure of performance. It was further noted that standards can be adapted to the measurement of sales performance in somewhat the same way they have been used to judge performance in the factory. The primary requirements in developing tools for the sales executive are threefold:
- Sales standards are the result of careful investigation and analysis of past performance, taking into consideration expected future conditions. Sales standards represent the opinion of those best qualified to judge what constitutes satisfactory performance. Judgment about detailed operations must rest largely with the sales executives. Opinions about expected general business conditions and market potentials should represent the combined judgment of the executive staff, including the chief executive, the sales manager, and the controller.
EXHIBIT 2.6 INDUSTRY-SPECIFIC FORECASTING MODEL
- Sales standards must be fair and reasonable measures of performance. Nothing will be so destructive of morale as a sales quota, or any other standard, set much too high. Experience shows that such standards will be ignored. The standards must be attainable by the caliber of salesman the company expects to be representative of its selling staff.
- Sales standards will need review and revision from time to time. As sales conditions change frequently, so the measuring stick must change.

Purpose of Sales Standards
Sales managers are sometimes of the opinion that sales standards are not welcome. Some sales executives feel that sales standards are an attempt to substitute impersonal statistics for sales leadership. There is no substitute for dynamic and farsighted sales executives; there is no intent that sales standards in any way replace personal guidance. But sales standards do provide management with an important tool of sales control, a basis for fairly rewarding merit, and a stimulating device under many circumstances, but not all. As a tool of control they reveal weaknesses in performance that, if properly analyzed in terms of causes, open the way for correction and strengthening. As a basis for rewarding merit they result in a fairer and more accurate relationship between compensation and performance. As a stimulating device they provide each salesperson and executive with a goal of accomplishment and with assurance of fair reward.
Nature of Sales Standards
The sales standards may be expressed in terms of effort, results, or the relation of effort to result. For example, a salesperson may be required to make three calls a day or fifteen calls per week. Making this number of calls meets this particular standard of effort. As a result of these calls, the expectations may be to secure ten orders for every fifteen calls or a certain dollar volume per call. Doing this meets this particular relationship standard. Securing a certain dollar volume from a given territory, regardless of the number of calls made or the orders and sales per call, meets another particular standard of results.
Again, the standards may involve a relationship between selling cost and sales results. For example, in a retail furniture store, the standard may require that one prospective customer be attracted to the store for every $2 expended in advertising or that $1 of sales be secured for every $0.07 expended for advertising. If these goals are achieved, those responsible for the advertising expenditures are meeting the standards of advertising results.
Illustrations of Sales Standards
Although the applicability of sales standards to various industries and types of trading concerns may differ, suggestive standards the controller may consider discussing with the sales manager are:
- Standards of effort
- Number of calls to be made per period
- Number of calls to be made on prospective customers
- Number of dealers and agencies to be established
- Number of units of sales promotional effort to be used (e.g., demonstrations or pieces of direct mail sent)
- Standards of results
- Percentage of prospects to whom sales are to be made
- Number of customers to whom new articles are to be introduced or sold
- Number of new customers to be secured
- Amount of dollar volume to be secured
- Number of physical units to be sold
- Amount of gross profit to be secured
- Amount of profit to be secured (here profit is frequently considered as the excess of gross profit over the expenses that are subject to the control of the salesperson or executive to whom the standard is to apply)
- Amounts to be sold to individual customers (especially larger customers)
- Dollar or physical volume of individual products or product classes to be sold
- Percentage of gross profit to be returned (where there is a varied line or where the salesperson has price latitude)
- Average size of order to be secured
- Relation of sales deductions to gross sales
- Standards expressing relationship of effort and result
- Number of orders to be received per call made
- Number of new customers to be secured per call made on prospects
- Number of inquiries or orders to be received per unit or per dollar of sales promotional effort expended
- Relation of individual direct selling expense items to volume or gross profit
- Relation of sales administration or supervision costs to volume or gross profit
Developing Sales Standards: Benchmarking
Now that sales standards have been defined, their purpose and nature explained, and illustrations provided, the question arises as to how sales standards are and should be developed.
To be effective, the standards must be accepted by those who use them as fair and reasonable, not the product of the whim of some overzealous bean counter. Benchmarking is used by a company to measure its products, services, and business practices against the toughest competitor, or those companies best in its class, or other comparisons. Brief commentary on this process and results are presented in the “Benchmarking” section of Chapter 1.
Revision of Sales Standards
Some standards of sales performance can be set with a high degree of exactness. The number of calls a salesperson should make, the percentage of prospects to whom sales should be made, and the physical units that should be sold to each customer are illustrative of performances that frequently lend themselves to accurate measurements. On the other hand, there are many factors in sales performance that are so governed by conditions beyond the control of the salespeople that the standards must be promptly revised to meet important changes in such conditions. Where a salesperson is given some latitude in price setting, the gross profit percentage may vary with competitive conditions beyond the salesperson's control. Strikes, droughts, and floods may suddenly affect the sales possibilities in a particular territory. If the sales standards are to be effective measures of sales performance, they must be promptly revised as conditions change. Careless measurement of performance soon leads to discouragement, resentment, and disinterest in the task.
Use of Sales Standards
As stated previously, the purposes of sales standards are to control sales operations, to reward merit, and to stimulate sales effort. The standards in themselves are of limited value, except as they are made effective in the accomplishment of such purposes. To make the standards effective requires the following be done:
- The variations between actual and standard performance be promptly determined
- The causes of such variations be investigated and explained
- The responsibility for the variations be definitely fixed
- The individuals held responsible be given full opportunity to present their explanations
- Prompt action be taken to correct any weaknesses revealed
- The method of compensation shall provide a fair and accurate reward for performance
Sales Quotas as Standards
The most widely used sales standard is the sales quota. As usually constituted, the sales quota is the dollar amount of physical volume of sales assigned to a particular salesperson, department, branch, territory, or other division as a measure of satisfactory performance. The quota may, however, involve other considerations, such as gross profit, new customers, collections, or traveling expense, thereby representing something of a composite or collective standard of performance.
The quota does not differ in its purpose and use from other sales standards as discussed earlier. The applicability of the quota to various types of concerns depends largely on the extent to which sales and other results are actually affected by the direct efforts of the salespeople involved and the extent to which such results are affected by other factors, such as expenditures for advertising, special sales promotion, styles, and acceptability of products. Where the former is the dominant factor, sales quotas constitute a valuable type of sales standard.
Basis of Sales Quotas
Generally speaking, sales quotas are of value only to the extent that they are based on known facts relative to sales possibilities. They must not be based on the greed of the company or fanciful ideas of what might be done but on actual facts relating to past sales, sales in allied industries, population, buying power, or territorial conditions. The sales representative should be thoroughly informed about the method of arriving at the quota and convinced that the amount of sales assigned is entirely justified according to the existing conditions. Then, and only then, will the salesperson exert full effort in meeting the quota.
The quota should not be thought of primarily as a basis for contests. The salesperson should consider the quota as representing a careful measurement of the task rather than a temporary target at which to shoot.
Actual experience with sales quotas, as with all standards, will reveal that sales representatives react to them somewhat differently, particularly at first. Some are stimulated to their highest efficiency, whereas others are discouraged. Some sales executives place considerable emphasis on this human element in setting their quotas. In general, however, good salespeople will, in the long run, respond favorably to intelligently devised quotas, particularly when compensation is fairly adjusted to performance.
The objection sometimes raised, that efforts are lessened after quotas are reached, is seldom valid if performance is properly rewarded. The chief difficulty arises when quotas are exceeded as a result of some fortuitous circumstance in which the sales representative has had no part or for which the share of the credit is uncertain. The solution here usually rests with extreme fairness in handling individual cases and with the development of confidence in the knowledge and integrity of sales executives.
The method of establishing sales quotas is still unsatisfactory in many concerns. The matter is frequently given insufficient study, and the results are ineffective. There has, however, been a vast improvement in such methods in recent years, and alert controllers have made a substantial contribution to this improvement.
Past performance is greatly influenced by conditions beyond the control of the individual salesperson. Hence a quota set when business is poor is likely to result in undue reward to the salesperson. Conversely, one set when business is good is likely to prove too high to serve as an effective incentive, or even provide fair compensation.
Method of Expressing Quotas
Insofar as practicable, quotas should be broken down into their detailed elements. This helps to show the sales representative where, how, and to whom the goods should be sold. To illustrate, a certain company gives each of its sales representatives the following details relative to the sales quota:
- The proportion of the quota assigned to each product line
- The part of the quota that represents an expected increase in business from new customers
- The part of the quota that represents an expected increase in business among old customers
- The part of the quota to be secured in cities of various sizes
- The part of the quota assigned to particular kinds of outlets or classes of customers
- The part of the quota to be secured from special or exceptional sources
- The distribution of the quota by months
Although such a plan entails considerable work, it tends to balance the sales effort and to assist the sales representative in directing work most effectively.
It should be realized that such details require the necessary detailed analysis of past performance by the controller's staff. Furthermore, such detail is indicative of a well-developed program. Many firms, particularly the small and medium sized, will express quotas in general terms only—so many dollars of sales or so many overall units. Where quotas are relatively new, the controller should proceed cautiously and develop the details gradually so that the sales executives can be guided step by step. Only when the data are available and the sales staff realizes the advantages of detailed planning can the quota type of standard serve most usefully.
It frequently happens that the quota cannot be fairly expressed directly in money or physical volume. For example, a sale of $100 of class A goods may deserve more credit than a like amount of class B goods, or a sale to a new customer may deserve more credit than a similar sale to an old customer. In such cases, the quota may be expressed in points that give effect to a weighting for different types of sales performance. Thus a sale of $100 class A goods may be counted as 10 points, whereas $100 of class B goods would be counted as only 5 points. The “point” system may likewise be extended to include other types of service, such as calls on new prospects, demonstrations, or collections.
The final requirement for effective standards is an adequate method of compensation as a reward for good performance.
SALES REPORTS
Effecting Sales Control
Fundamentally, control is the prompt follow-up of unfavorable trends or conditions before they develop into large losses. In the small business, the owner or manager can exercise current control of sales through a review of orders received and so forth. In the larger businesses, however, such personal contact must be supplemented by reports that indicate current conditions and trends as well as current performance.
It is the function of the controller, of course, to furnish the sales executives with the sales facts. However, it is one thing to furnish the information; it is quite another thing to see that it is understood and acted on. To assure the necessary understanding, the controller must adapt the report to the reader. Information for the needs of the chief executive will be different from that for the sales manager, and reports for subordinate sales executives will differ even more. The extent of the information required and the form of presentation will depend on the capabilities of the individual, the type of organization, the responsibilities of the vender, and the philosophy of sales management.
Nature of Sales Reports
Sales executives have many management styles and backgrounds. Some sales managers can effectively use vast amounts of statistical data, whereas others prefer summarizations. Accordingly, the controller should offer to develop reports to meet the requirement. The use of charts, graphs, and summaries will greatly enhance the communication of the sales data to sales management. In many instances, a narrative report citing the significant issues or problems is the most effective tool. Depending on the seriousness of the problem, or where major actions are being recommended, a meeting may be in order. It is up to the controller to ensure that the information provided is understood and can be properly used.
Content of Sales Reports
The matters that may be included in a sales report cover a broad front. Such reports might contain:
- Actual sales performance, with month- or year-to-date figures
- Budgeted sales for both the period and year to date
- Comparison of actual sales by firm with industry figures, including percentages of total
- Analysis of variances between budgeted and actual sales and reasons for differences
- Sale–cost relationships, such as cost per order received
- Sales standards—comparison of actual and quota sales by salesperson
- Unit sales price data
- Gross profit data
These data often may be expressed in physical units or in dollars. Aside from actual or standard sales performance, some may relate to orders, cancellations, returns or allowances, or lost sales.
Illustrative Features in Sales Reports
As stated previously, the content of sales reports must be varied to suit the needs and personality of the user. Reports to the chief executive and top sales executive, for example, should present the overall view in summary fashion. A simple comparison of actual and planned sales by major product line or territory, as shown in Exhibit 2.7, summarizes the sales in a brief but informative manner. Summary information is also presented comparing the company performance against industry by months (or years) in Exhibit 2.8. A graphic comparison of actual with planned sales as illustrated in Exhibit 2.9 is also useful.
Sales executives also find trend reports on product lines to be of value. A percentage bar chart, illustrated in Exhibit 2.10, would be particularly significant if the profit by product group is greatly different. Trends in sales volume are easily shown by vertical bar charts similar to that pictured in Exhibit 2.10. Sales managers typically need information on the probable future course of sales. For this purpose, timely reports summarizing the orders-on-hand picture are helpful. Such a report, which may be desired daily, weekly, or monthly, is illustrated in Exhibit 2.11.
The graphs and reports presented thus far have been rather simple in nature. Whereas reports always should be understood, in many cases, particularly in larger companies, they must be more analytical or detailed in nature. Moreover, for control purposes and adopting the concept of “responsibility reporting,” the performance of each segment of the sales organization should be made known to the supervisor responsible. It follows, therefore, that reporting must be available for each division, district, area, branch, or salesperson. A typical branch report is illustrated in Exhibit 2.12 and is very brief. However, as reports relate to increasingly lower levels of management, such information can become massive in extent. Therefore, although data may be periodically prepared on each segment of the organization, it has been found practical to apply the “exceptional principle” in a great many cases. This method eliminates data where performance was satisfactory and details only that which did not reach acceptable levels. An example is Exhibit 2.13, indicating only those salespersons who were 5 percent or more under budget. Another report prepared on only out-of-line performance is that shown in Exhibit 2.14. Only customers on which a loss was realized are listed. It is to be noted that two profit or loss computations are made:
- Actual out-of-pocket losses, using the direct costing concept
- Gross loss, wherein all fixed and allocated charges are considered
Frequency of Reports
The frequency of any report will depend on the individual requirements of each executive or staff member and may be daily, weekly, monthly, or quarterly. For example, the top executive and general sales manager may want a daily report on sales, orders received, and orders on hand; a weekly report may suffice; or a report may be wanted daily during a critical period and less frequently thereafter.
In those cases where sales data are collected by use of data input devices from remote locations and stored in the computer, reports and data can be provided on a visual display unit on a real-time basis.
PRODUCT PRICING: POLICY AND PROCEDURE
Prices in a Competitive Economy
From the economic viewpoint, prices are the regulator of our economy in that they determine the distribution of goods and services. Over the long run, when prices in a given industry are insufficient to provide an adequate return, capital and labor tend to shift to more attractive fields. In the individual business, also, skill in setting prices has a tremendous impact on the profitability of the operation and therefore on its economic life.

EXHIBIT 2.7 COMPARISON OF ACTUAL TO PLANNED SALES
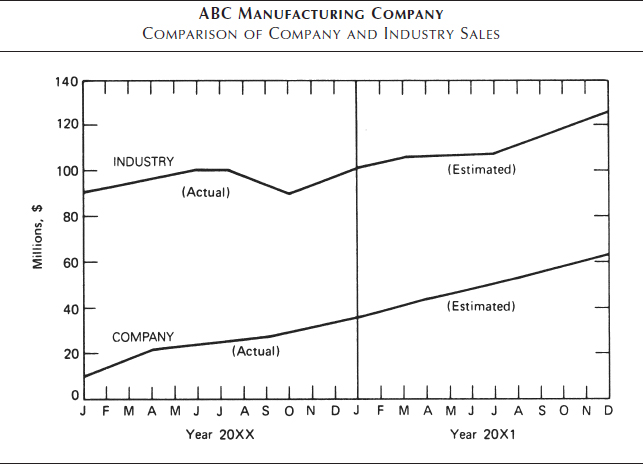
EXHIBIT 2.8 GRAPHIC COMPARISON OF COMPANY VS. INDUSTRY SALES
Product pricing is a difficult area in which to make decisions because of the many forces at play. It is so complex a subject that it is not ordinarily a one-man job or one-activity job. Rather the combined talents of marketer, accountant, engineer, and economist may be needed. It might be said that pricing is one-third computation and two-thirds judgment. From the accounting viewpoint, however, the one-third computation is an essential aid to the judgment factor. Factors that influence prices include market conditions, costs of manufacturing and distribution, plant capacity, competitive activity, capital investments, financial liquidity, government pressures, and a multitude of others. It is therefore understandable that there exists a diversity of approaches to the problem. But this situation presents an equally valid reason to attempt to set out some guiding principles.
Prices and the Controller
The accountant's contribution to the accounting control of sales is in most cases largely after the fact. That is, comparisons of actual performance are made with budget, forecast, or standard; or sales data are analyzed to reveal unfavorable trends and relationships. In the field of product pricing, however, the controller may be able to exert “preventive” accounting control before the occurrence by bringing facts to bear on the problem before unwise decisions are made. This activity is closely related to profit planning as well as control. The influence of prices on company profits is obvious, and the finest controls on costs and expenses will not succeed in producing a profit if selling prices are incorrectly set. If the controller is charged with a responsibility for protecting the assets of the company, or of exercising the control function on costs and expenses or capital expenditures, then an important role should also be played in price determination.
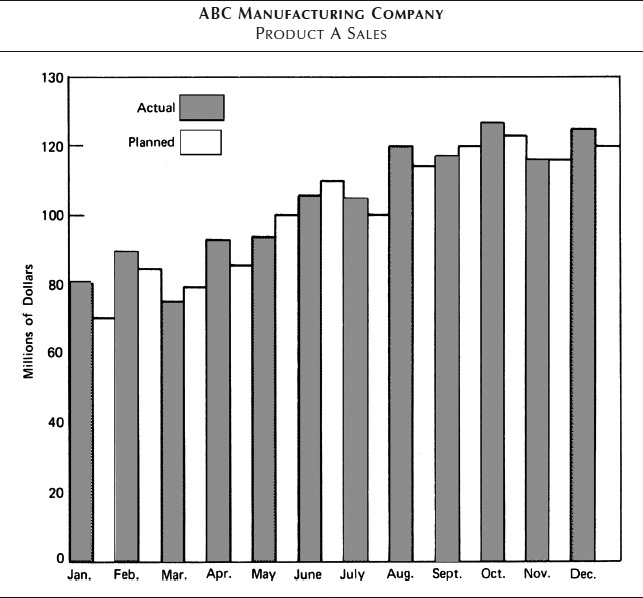
EXHIBIT 2.9 ACTUAL AND PLANNED SALES; SALES TREND
And just what should the function be in price determination and related accounting control? It is hoped that it will not be merely as a source of information, providing data only when requested, and even then in the form and of the content specified. In many companies, it is questionable whether the pricing officials are fully aware of the kinds of facts required. Therefore, the controller should be expected to show some initiative and supply intelligent information from the legitimate sphere of activity. More specifically, the chief accounting official ordinarily can be of assistance by performing the following functions:
- Help establish a pricing policy that will be consistent with the corporate objectives—for example, earning the desired return on investment.
- Provide unit cost analysis, in proper form, as one factor in price setting.
- Project the effect on earnings of proposed price changes and alternatives.
- To the extent necessary or practicable, gather pertinent information on competitive price activity (this may be the function of the market research group or economics department in some companies).
- Analyze the historical data on prices and volumes to substantiate probable trends as they may influence proposed price changes.
EXHIBIT 2.10 PERCENTAGE OF SALES BY PRODUCT LINES
EXHIBIT 2.11 REPORT ON SALES ORDER ACTIVITY
- Determine for management, on a regular basis (such as the monthly operations report) the influence on profit of changes in price, product mix, sales volume, etc.; in other words, focus attention on the price problem where such action may bring about intelligent direction.
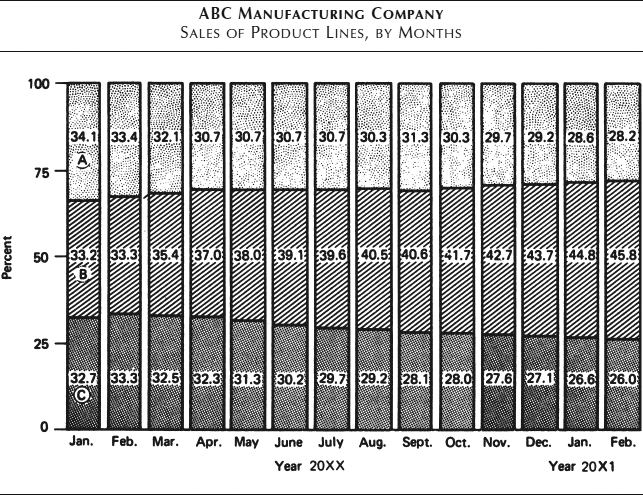

Some of these procedures are reviewed in the sections that follow.

EXHIBIT 2.12 COMPARISON OF BUDGETED AND ACTUAL SALES BY BRANCH
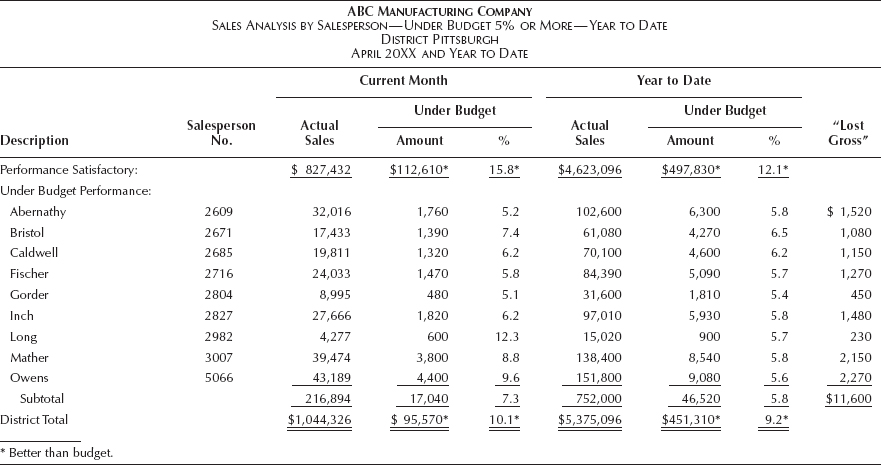
EXHIBIT 2.13 EXCEPTION REPORTING—SALESPERSON PERFORMANCE
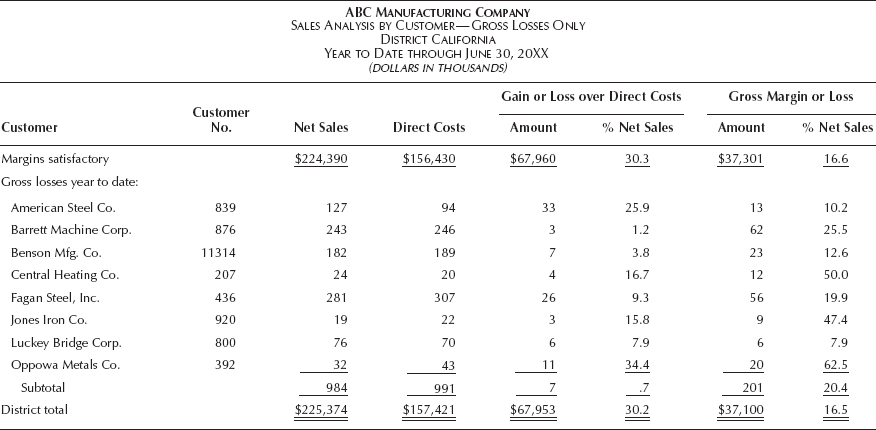
EXHIBIT 2.14 SALES ANALYSIS BY CUSTOMERS—EXCEPTION BASIS
Cost Basis for Pricing
There is a great tendency to either underrate or overrate costs as a factor in setting prices. Frequently, the statement is heard that “prices are based on competition.” Less often, the statement is made that “prices are based on costs.” There are certainly circumstances where these comments apply. Rarely, however, can costs be ignored entirely.
Over any extended period, no business can consistently sell all or most products at less than cost, cost that results from production and distribution functions and the related service activities. It is further recognized as a highly desirable condition that a profit be made on every product, in every territory, with every customer. Although this may not always be practicable, the closer such conditions are approached, the more certain or assured is the net profit. Hence, it is apparent that adequate cost information is absolutely indispensable.
In summary, costs may be viewed as the point of departure or starting place in product pricing. And the role to be played by the cost factor depends on the circumstances. If the product is built to customer order, and is not a stock item, costs will be more important. Further, if competition is weak or if the company is a price leader, cost information will play a larger part than if the opposite situations exist. Also, elasticity of demand influences the weighting of costs in that an inelastic demand probably will cause costs to be a greater factor and costs at various volume levels must be studied to maximize earnings.
The question then arises, “What kinds of costs are required?” For different purposes, different types of costs may be desirable. One type of cost may be suitable for a short-range decision and quite another type for longer-term purposes. Moreover, for pricing, the usual historical cost approach may not meet the requirement. In summary, then, the controller is expected to be aware of the several costing methods and the limitations of each and to select that concept most suited to the purpose at hand.
Before reviewing several alternative costing techniques, some general observations are desirable. First, prices relate to the future. Therefore, costs to be used in determining prices must be prospective. Recognition should be given to cost levels expected to prevail in the period under review. Probable raw material and labor costs should be considered. Prospective changes in process ought to be reflected in the cost estimates.
Inflation must be considered, and the best available information should be obtained to recognize what future rates of inflation can be expected. In this forecasting or projecting, the modern scientific tools should be utilized to the extent practicable, such as statistical sampling, sound economic principles, simulation methods, decision analysis techniques, price level analysis. Consideration should also be given to replacement cost of the productive capacity or capital assets. Prices must provide for the future replacement of these productive assets at the projected costs.
Finally, it should be obvious that all costs related to a product should be considered and not merely the cost to manufacture. It defeats the purpose if manufacturing costs are carefully calculated but selling or other expenses are applied as an overall percent without regard to the direct expense and effort specifically applicable to the product.
Although many costing methods or variations are in use, there are three basic approaches that warrant discussion:
- Total cost method
- Marginal or direct cost method
- Return on assets method
As a prelude to reviewing costing methods, it seems desirable first to review an example of the influence of costs on profit at differing volume levels. Further, the role of competitive conditions and demand in relation to costs needs to be understood.
Elasticity of Demand
In exercising judgment on prices, elasticity of demand should be given proper weighting in any cost–profit–volume calculations. Normally, the pricing executives will have some general knowledge of the extent to which demand will react to changes in price. However, to provide supplemental assurance, perhaps controlled experimentation will be helpful in gauging this factor. If demand is relatively inelastic, and competitive conditions permit, then it may be possible to pass cost increases on to the customers. Under such circumstances, the controller can show the effect of cost changes on profits and the desirability of effecting price changes. If demand is highly elastic, and the market is somewhat noncompetitive, unit costs can be employed to determine the optimum price with which to produce the optimum profit.
Under such circumstances, it is desirable to determine the sales price that will produce the greatest net profit over a long period of time. Too high a profit over a short term might invite competition or governmental regulation.
Where conditions approach monopoly, it is perhaps of interest to review a typical procedure in setting selling prices. Basically, an estimate is secured from the sales manager about the probable number of units that can be sold at various price levels. Then the unit cost and total cost at the corresponding production level are calculated. That volume at which the greatest total profit is secured can then be determined.
Exhibit 2.15 illustrates the application of this procedure. Here, it is suggested that the unit selling price may be set at $12, $10, $8, $6, $4, or $2. Estimates are then made about the number of units that can be sold at each price. These are indicated by the sales line. Thus it is estimated that 1,600 units can be sold at a price of $10 per unit, whereas 4,000 units can be sold at a price of $4. Likewise, the cost line shows the estimated total unit cost (including interest on investment) at each volume level. Thus it is estimated that the unit cost will be $5 when volume reaches 2,400 units. The spread between selling price and costs constitutes the unit profit that, multiplied by the number of units, gives the total profit at various price levels. At a price of $10, the profit will be $2 per unit, the volume 1,600 units, and the total profit $3,200. At a price of $8, the total profit will be $7,200. At a price of $6, the total profit will be $6,400. It is apparent here that the greatest profit will be made at a unit price of $8.
Total Cost Method
Now let us consider the three important costing techniques, the first of which is the “total cost” or “full cost” method. Under this concept, the cost of the individual product is determined, and to this figure is added the desired profit margin. Such a margin is usually expressed as a percentage of either cost or the selling price. As an example, the proposed selling price might be calculated as shown in Exhibit 2.16.
In Exhibit 2.16, costs were used as the basis for determination of the markup, as well as the charge for each of the nonmanufacturing expense levels. As an alternative, each cost element could have been calculated in relation to the proposed selling price. Thus the profit margin might have been expressed in the formulas as 20 percent of the selling price, and expenses might have been treated in the same manner.
Such a method has at least two advantages: (1) it is simple in application, and (2) it bases selling prices on all costs expected to be incurred—thus tending to assure full cost recovery, if the product sells and if the costs are generally as estimated. Over the longer run, all costs must be recovered.

EXHIBIT 2.15 METHODS OF SETTING SELLING PRICE IN A CONTROLLED MARKET

EXHIBIT 2.16 TOTAL COST METHOD
From the cost viewpoint, at least four disadvantages exist in using such a method exclusively:
- It fails to distinguish between out-of-pocket costs and total costs. In the short run and with available plant capacity, there will be circumstances when business should be accepted on something less than a total cost basis.
- It does not recognize the inability of all products to return the same rate of profit. Moreover, it fails to distinguish the elements of cost creating the profit, some of which cannot be expected logically to generate the same rate of income. For example, a product that is largely purchased materials may not reasonably return the same percentage of profit on total cost as one constituted mainly of labor and a consequent higher relative share of factory overhead and management talent.
- The method does not recognize the optimum profit potential. The effect of elasticity in demand and the consequent point of greatest return are ignored.
- This method of calculating tends to encourage a constant overhead application percent to the exclusion of volume factor likely to be applicable.
The cost calculations can be modified to overcome the second objection. Then, too, several computations can be made to compensate partially for differing volumes.
Marginal Cost Method
The marginal cost approach to prices gives recognition to the “incremental” or “marginal” costs of the product. These are costs directly associated with the product that would not be incurred if the product were not manufactured or sold. Any selling price received above this floor represents a contribution to fixed expenses and/or profit.
The application of this principle to products A and B described in the full cost method might produce a picture as shown in Exhibit 2.17.
In Exhibit 2.17, incremental costs have been segregated from direct expenses of a fixed nature applicable to the product, and these direct costs have been identified separately from the allocated costs of a fixed nature.
If the product must be sold for the incremental costs or less, then the company would earn no less a profit, or possibly even a higher profit, by not manufacturing and selling such product. Full consideration must be given, of course, to related profit results, namely, sales of other products to the customers, and so on, if the withdrawal of a given product would in fact cause loss of the other business. From the longer-range viewpoint, the minimum price to be charged would be that covering all direct costs, and for the company to continue in business over the longer term, all costs must be recouped.

EXHIBIT 2.17 MARGINAL COST METHOD
It can be appreciated that marginal and direct cost data—before allocated continuing costs—are of value in any one of several situations:
- Where additional sales may be made at reduced prices, over and above direct costs, to another class of customer, namely, private brand business, or under another trade name and so forth.
- Where idle plant capacity can be utilized only at reduced prices and in other than regular sales outlets
- Under circumstances where these added sales at reduced prices do not create problems in the regular marketplace
The use of marginal costs is for short-term decisions only. The great danger is the tendency to secure a larger and larger volume of sales on an incremental basis, with an ultimate deteriorating effect in the market and a large share of business that does not return its full and proper share of all costs. Furthermore, under such conditions there is no return on assets employed from the products priced at not more than total costs.
Return-on-Assets-Employed Method
From the profit viewpoint, the most desirable costing method is that which maximizes the return on total assets employed. This is the approach that has been given more attention in recent years. It is to be noted that under the two costing procedures just reviewed, no consideration has been given, for example, to the capital invested in manufacturing or sales facilities or in working capital. Yet the real test of business efficiency is the rate of return on total assets employed. Growth generally takes place only when the product yields a reasonable return on the funds devoted to it. If the business objective is to maximize return on capital, then, as a starting point at least, the price of each product required to achieve the desired rate of return should be known.
This method of determining markup over total costs for the desired percent return on assets rather than markup for a percent return on costs (or percent of net sales) has considerable merit in the opinion of the authors. Some of the assets employed are fixed in nature, such as plant and equipment. But a share of the investment—primarily current assets—is a variable of volume and prices. For example, accounts receivable will be higher as sales volume and sales prices are higher. Investment in inventory will increase or decrease as volume changes and as manufacturing costs and raw material prices fluctuate. In view of the variables, a formula may be employed to calculate the sales price required to produce a planned return on assets employed:

Cost represents total cost of manufacturing, selling, administrative, research, etc. % return represents that rate desired on assets employed (before income taxes). The fixed assets represent plant and equipment, although some of the current assets might be placed in this category.
The variable assets represent the current assets that are a function of volume and prices.
Applying some assumptions, a unit price on product A may be calculated as:

The proof is computed in this manner:

The foregoing is intended to show the method of determining unit sales prices to provide a target or planned return on investment. Although applied to a single product, the percentages used were those of the product class or group of which product A is one segment.
Applying the Return-on-Assets-Employed Concept
The simple example just cited purposely avoided some of the controversial or problem areas in using the return-on-assets-employed concept. Some brief observations on the subject may prove helpful.
Under this procedure, total assets employed is considered to include all assets used in manufacturing and selling the product (including related services). It is immaterial how the funds were provided—whether by debt or equity. The management of a company should effectively use all assets, whether owner supplied or creditor supplied.
Another question often raised is the basis of valuation of assets. Should replacement value be considered? Should fixed assets be included on a gross or depreciated basis? Essentially, policies of valuation will have no appreciable effect on price determination. Recognition can be provided directly or indirectly in the rate of return objective. Consistency is the important consideration.
In a multiproduct company, a problem to be solved is the allocation of capital employed to the various product lines. On reflection, this need not be a major stumbling block. Just as controllers have been allocating costs to products for years, so also they can allocate assets on a reasonable basis consistent with the facts of the particular business. Some suggested methods of prorating assets to product lines are:
| Item | Possible Bases |
| Cash | In ratio to total product cost |
| Accounts receivable | In ratio to sales, adjusted for significant differences in terms of sale |
| Raw material | In ratio to actual or expected usage |
| Work in process | In ratio to actual or expected usage |
| Finished goods | In ratio to cost of manufacture |
| Fixed assets | In ratio to conversion costs (labor and variable manufacturing overhead) or labor hours—either actual, normal, or standard |
Conversion Costs for Pricing Purposes
Still another economic concept useful in pricing is termed the “conversion cost theory of value.” In essence, this view holds that profits are, or should be, earned commensurate with the effort and risk inherent in converting raw materials into finished products. This approach has merit, particularly in situations where relative material content varies widely by product. For example, if one product is largely an assembly of purchased parts and another requires extensive processing in expensive facilities, application of the same markup to each probably would result in a price too high on the assembly item and too low on the fabricated product. Differences in types of costs may therefore need to be recognized. A combined use of the return-on-assets concept and direct costs may be illustrative.
Assume the following is a typical pricing and profit-planning problem:
- A given product line R is made up of products of varying material content.
- $24,000,000 are the gross assets employed for the line.
- Management desires a 20% return (before taxes) on the assets employed.
- The pertinent profit data are:
- Period (fixed or continuing) expenses are $6,000,000.
- The profit to volume or contribution margin (P/V) ratio is 30%.
- Direct materials and conversion expenses are, on the average, in a 4 to 3 ratio.
- Material turnover is twice a year.
With these premises, it is necessary to calculate the following:
- The sales volume needed to produce the desired rate of return
- The markup to be applied on each of the direct cost factors in the product line
Net sales and aggregate costs by element may be determined in this manner:

Inasmuch as the material turnover is two times per year, the investment is $7,200,000 ($14,400,000 ÷ 2). Twenty percent of this figure is $1,440,000. Consequently, the additive factor is 10% ($1,440,000 ÷ $14,400,000), and the portion of sales revenue needed to provide a 20% return is $15,840,000 ($14,400,000 + $1,440,000).
The additive factor on conversion costs may be determined by the difference method as:

Thus, the conversion markup is 1.867 ($20,160,000 × $10,800,000).
If the direct costs of product R162 in the line are known, the target or “ideal” selling price is then determined in this fashion:

Such proposed prices are only a starting point—they must be considered in relationship to competitive prices.
The setting of product prices is complex and includes the evaluation of many variables. It is the task of the controller to provide for management's judgment all pertinent facts. The various costing methods must be considered and the most appropriate applied in the particular company set of circumstances. In addition to the applicable costs, other factors in setting product prices to be summarized for management's review are:
- Return on invested capital or assets employed
- Assets employed and turnover
- Percentage of plant capacity utilized
- Percentage of product line for each product
- Percentage of market
- Competition pricing and percentage of market
- Margin over direct costs
Recognizing the numerous “what-if” situations in setting prices, the controller should be familiar with the many computer models available for evaluating such business decision as price formulation. The variable inputs can be provided to the system, and when combined with the stored data, the alternatives can be quickly and easily evaluated. From a control viewpoint, a key responsibility for the controller is to participate actively in the costing and pricing function.