
Develop the Process to Cascade the Organization Strategy to the Frontline
If you can’t fly then run, if you can’t run then walk, if you can’t walk then crawl, but whatever you do you have to keep moving forward.
—Martin Luther King, Jr.
In Chapter 10, I shared the first step of the two-step process of cascading the organization strategy. In this chapter, I will talk about the second step of the process for cascading the organization report card to develop performance scorecards for all areas of the organization.
Let’s continue to learn from the example of Hospital Heal. The hospital’s new strategic plan reflected five strategic objectives under each of its four strategic directions. The sheer magnitude of the work required to deploy the strategy with twenty objectives across the organization was daunting. The challenge was to ensure that the frontline team understood how their work impacted these strategic objectives (Figure 12.1).

Hospital Heal developed a unique and innovative approach to engage the frontline staff and cascaded its hospital report card to all areas across the organization. It was done in the following two stages:
1.Preparation for cascading the hospital’s Health Report Card: completed in six weeks
2.Actual development of performance scorecards for all areas across the hospital: completed in three weeks
Activities undertaken during the preparation stage included the following:
![]() Over 300 metrics were brainstormed to support all areas across the hospital, covering mental health, physical health, and corporate services.
Over 300 metrics were brainstormed to support all areas across the hospital, covering mental health, physical health, and corporate services.
![]() Six mandatory metrics were selected that would be used by every scorecard area
Six mandatory metrics were selected that would be used by every scorecard area
![]() A standard approach and educational materials were developed to support cascading of the Health Report Card.
A standard approach and educational materials were developed to support cascading of the Health Report Card.
![]() Twelve individuals were trained to facilitate teams during workshops for developing performance scorecards.
Twelve individuals were trained to facilitate teams during workshops for developing performance scorecards.
![]() Awareness sessions on the Balanced Scorecard philosophy and the approach to develop area-specific performance scorecards during the forthcoming workshops were conducted for all teams across the organization (Figures 12.2 and 12.3).
Awareness sessions on the Balanced Scorecard philosophy and the approach to develop area-specific performance scorecards during the forthcoming workshops were conducted for all teams across the organization (Figures 12.2 and 12.3).
![]() Blog posts and one-page handouts on performance scorecard were created and shared to engage the frontline and their supervisors.
Blog posts and one-page handouts on performance scorecard were created and shared to engage the frontline and their supervisors.
![]() Eighty areas were identified that needed to be represented on a performance scorecard.
Eighty areas were identified that needed to be represented on a performance scorecard.
![]() Working group representatives from each of the eighty areas were selected. The team composition included members at all levels: frontline, supervisors, managers, and directors.
Working group representatives from each of the eighty areas were selected. The team composition included members at all levels: frontline, supervisors, managers, and directors.


Figure 12.3 Facilitators promoting development of scorecards at Hospital Heal.
Activities undertaken to develop performance scorecards included the following:
![]() Eighty working groups were facilitated by twelve individuals (six core team members and six value stream coaches) to develop their respective performance scorecards. Depending upon the size and the complexity of their area, each group required between one and three half-day workshop sessions to complete their respective scorecard.
Eighty working groups were facilitated by twelve individuals (six core team members and six value stream coaches) to develop their respective performance scorecards. Depending upon the size and the complexity of their area, each group required between one and three half-day workshop sessions to complete their respective scorecard.
![]() In addition to the six mandatory metrics provided, each team selected an additional six area-specific metrics. Each scorecard had a minimum of six and a maximum of twelve metrics (Table 12.1).
In addition to the six mandatory metrics provided, each team selected an additional six area-specific metrics. Each scorecard had a minimum of six and a maximum of twelve metrics (Table 12.1).
![]() All eighty performance scorecards were reviewed by their respective director and approved by their respective vice president (Figure 12.4).
All eighty performance scorecards were reviewed by their respective director and approved by their respective vice president (Figure 12.4).
Table 12.1 Template Used at Hospital Heal for Developing Performance Scorecards


Figure 12.4 Breakdown of scorecards by area.
Once the process was tested for two years, a standard work process was developed at Hospital Heal to create their annual report card. This process is shared in Table 12.2.
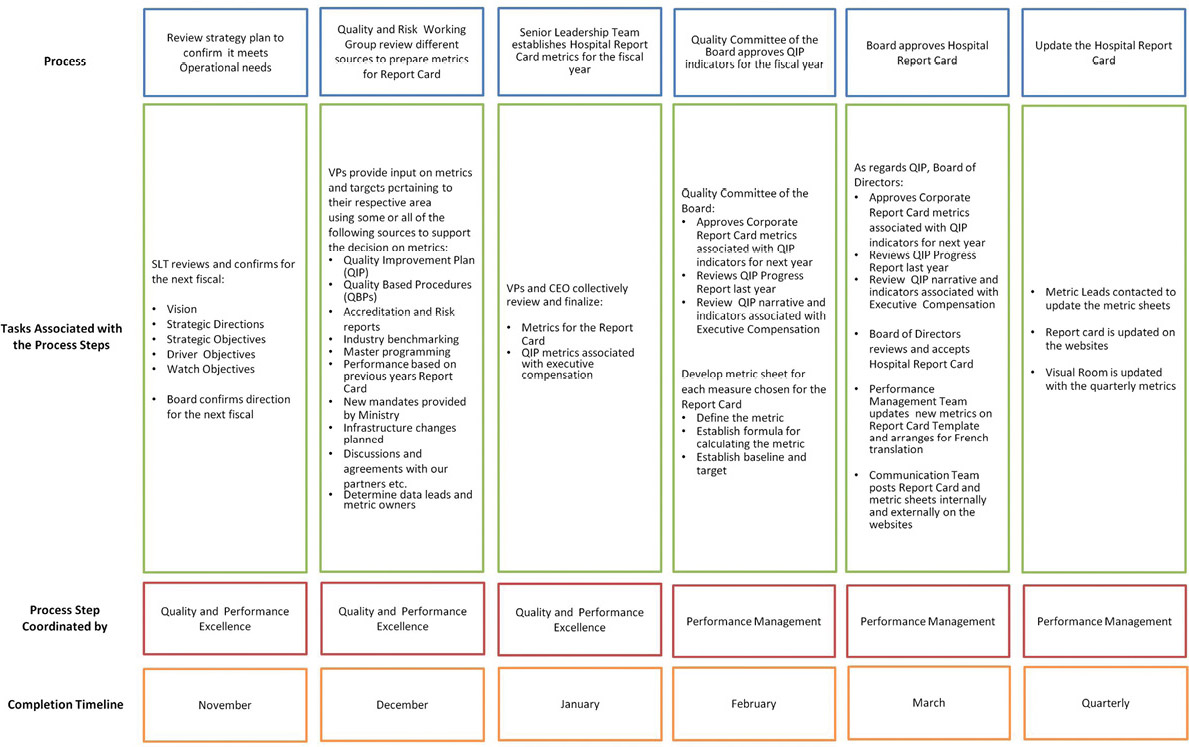
Sensei Gyaan: Select no more than five metrics per scorecard area (three mandatory and two area specific). Upon reflection in the following year at Hospital Heal, the number of mandatory metrics was reduced to five, as hospital management realized that twelve metrics were too many for teams to manage in any given year.