
When working with hierarchical data structures, a tree (tree graph) is probably one of the most natural and common visualizations typically leveraged to demonstrate structural dependencies between different data elements. Tree is an undirected graph in which any two nodes (vertices) are connected by one and only one simple path. In this recipe, we will learn how to implement a tree visualization using tree layout.
Open your local copy of the following file in your web browser:
https://github.com/NickQiZhu/d3-cookbook/blob/master/src/chapter9/tree.html.
Now let's see d3.layout.tree in action:
function tree() {
  var _chart = {};

  var _width = 1600, _height = 800,
    _margins = {top:30, left:120, right:30, bottom:30},
    _svg,
    _nodes,
    _i = 0,
    _tree,
    _diagonal,
    _bodyG;

  _chart.render = function () {
    if (!_svg) {
      _svg = d3.select("body").append("svg")
        .attr("height", _height)
        .attr("width", _width);
    }

    renderBody(_svg);
  };

  function renderBody(svg) {
    if (!_bodyG) {
      _bodyG = svg.append("g")
        .attr("class", "body")
        .attr("transform", function (d) {
          return "translate(" + _margins.left
            + "," + _margins.top + ")";
          });
    }

    _tree = d3.layout.tree()
      .size([
        (_height - _margins.top - _margins.bottom),
        (_width - _margins.left - _margins.right)
      ]);

    _diagonal = d3.svg.diagonal()
      .projection(function (d) {
        return [d.y, d.x];
      });

    _nodes.x0 = (_height-_margins.top-_margins.bottom) / 2;
    _nodes.y0 = 0;

    render(_nodes);
  }

  function render(source) {
    var nodes = _tree.nodes(_nodes);

    renderNodes(nodes, source);

    renderLinks(nodes, source);
  }

  function renderNodes(nodes, source) {
    // will be explained in the 'how it works...' section
    ...
  }

  function renderLinks(nodes, source) {
    // will be explained in the 'how it works...' section
    ...
  }

  // accessors omitted
  ...

  return _chart;
}
This recipe generates the following tree visualization:
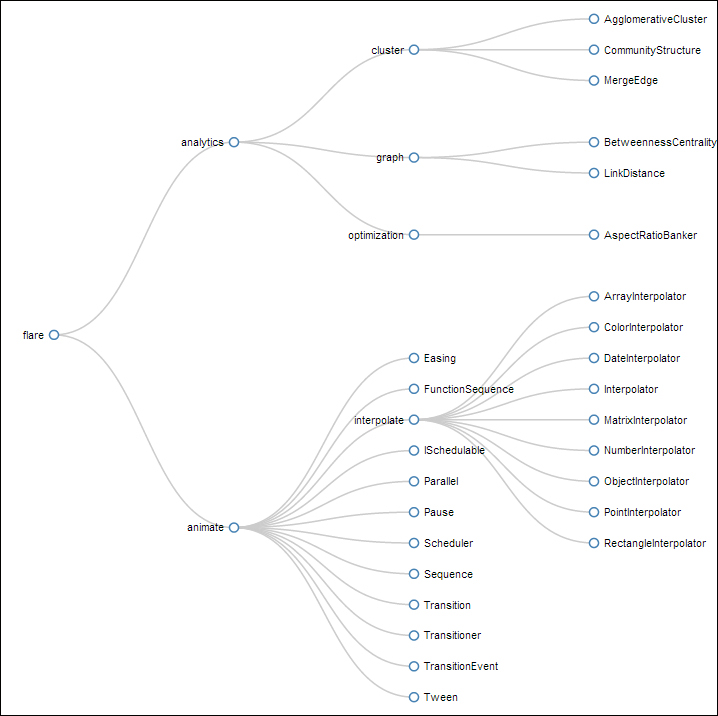
Tree
As we have mentioned before, this recipe is built over the D3 tree layout. d3.layout.tree is specifically designed to convert a hierarchical data structure into a visual layout data suitable for generating tree graph. Our tree layout instance is defined as the following:
_tree = d3.layout.tree()
  .size([
    (_height - _margins.top - _margins.bottom),
    (_width - _margins.left - _margins.right)
  ]);
The only setting we provided here is the size of our visualization, which is the size of our SVG image minus the margins. d3.layout.tree will then take care of the rest and calculate every node's position accordingly. To use the tree layout, you simply invoke its nodes function.
var nodes = _tree.nodes(_nodes);
If you peek into the nodes layout data, it contains node data looking like this:

Tree layout data
One new D3 SVG shape generator we need for this recipe that is worth mentioning is d3.svg.diagonal. The diagonal generator is designed to create svg:path that connects two points. In this recipe, we use diagonal generator with tree layout links function to generate a path connecting every node in the tree.
_diagonal = d3.svg.diagonal()
  .projection(function (d) {
    return [d.y, d.x];
  });
In this case we configure our diagonal generator to project using Cartesian orientation and simply reply on the x and y coordinates calculated by the tree layout for positioning. The actual rendering was performed by the following functions. First let's take a look at the renderNodes function:
function renderNodes(nodes, source) {
  nodes.forEach(function (d) {
    d.y = d.depth * 180;
  });
Here we loop through all the nodes and artificially assign a 180-pixel spacing between them. You probably are wondering why we are using the y coordinate instead of x. The reason is that in this recipe we want to render a horizontal tree instead of a vertical one; therefore we have to reverse the x and y coordinates here.
  var node = _bodyG.selectAll("g.node")
    .data(nodes, function (d) {
      return d.id || (d.id = ++_i);
    });
Now we bind the nodes that were generated by the tree layout as data to generate the tree node element. At this point, we also assign an ID to each node using an index to obtain object constancy.
  var nodeEnter = node.enter().append("svg:g")
    .attr("class", "node")
    .attr("transform", function (d) {
      return "translate(" + source.y0
        + "," + source.x0 + ")";
    });
At this point, we create the nodes and move them to the same point of origin as set in the renderBody function.
  nodeEnter.append("svg:circle")
    .attr("r", 1e-6);

  var nodeUpdate = node.transition()
    .attr("transform", function (d) {
      return "translate(" + d.y + "," + d.x + ")";
    });

  nodeUpdate.select("circle")
    .attr("r", 4.5);
Now we start a transition in the update section to move the nodes to their proper position.
  var nodeExit = node.exit().transition()
    .attr("transform", function (d) {
      return "translate(" + source.y
        + "," + source.x + ")";
      })
    .remove();

  nodeExit.select("circle")
    .attr("r", 1e-6);

  renderLabels(nodeEnter, nodeUpdate, nodeExit);
}
At last, we handle the exit case and remove the nodes after a brief animation of the collapsing effect. The renderLabels function is quite simple so we will not cover it in detail here. Please see the complete online code companion for details.
Now let's take a look at the more interesting renderLinks function.
function renderLinks(nodes, source) {
  var link = _bodyG.selectAll("path.link")
    .data(_tree.links(nodes), function (d) {
      return d.target.id;
    });
First, we generate the data binding using the links function on d3.layout.tree. The links function, which returns an array of link objects containing the {source, target} fields that point to the appropriate tree nodes.
  link.enter().insert("svg:path", "g")
    .attr("class", "link")
    .attr("d", function (d) {
      var o = {x: source.x0, y: source.y0};
      return _diagonal({source: o, target: o});
    });
In the enter section, the svg:path elements were created to visually represent the links between source and target nodes. To generate the d attribute for the path element we rely on the d3.svg.diagonal generator we defined earlier. During creation we temporarily set the links to zero length paths by setting both source and target to the same point of origin. So when later we transition the link to its proper length, it will generate the expanding effect.
  link.transition()
    .attr("d", _diagonal);
Now we transition the links to its proper length and position using the links data generated by the tree layout.
  link.exit().transition()
    .attr("d", function (d) {
      var o = {x: source.x, y: source.y};
      return _diagonal({source: o, target: o});
    })
  .remove();
When we remove the nodes again,we rely on the same trick of setting the link to its parent's position with zero length in order to simulate the collapsing effect.
d3.layout.treeoffers several functions allowing customization. For more details, please check out its API documentation at https://github.com/mbostock/d3/wiki/Tree-Layout.- The
d3.svg.diagonalgenerator is capable of projection using Cartesian orientation, radial and other orientations. For more details, please see its API documentation at https://github.com/mbostock/d3/wiki/SVG-Shapes#wiki-diagonal. - The Animating multiple elements recipe in Chapter 6, Transition with Style, for explanations on object constancy.
- This recipe is inspired by Mike Bostock's tree layout example, which you can find at http://mbostock.github.io/d3/talk/20111018/tree.html.