
An enclosure diagram is an interesting visualization of hierarchical data structures that uses the recursive circle packing algorithm. It uses containment (nesting) to represent hierarchy. Circles are created for each leaf node in a data tree while its size is proportional to a particular quantitative dimension of each data element. In this recipe, we will learn how to implement this kind of visualization using D3 pack layout.
Open your local copy of the following file in your web browser:
https://github.com/NickQiZhu/d3-cookbook/blob/master/src/chapter9/pack.html
In this recipe, let's see how we can implement an enclosure diagram using d3.layout.pack.
function pack() {
  var _chart = {};

  var _width = 1280, _height = 800,
    _svg,
    _r = 720,
    _x = d3.scale.linear().range([0, _r]),
    _y = d3.scale.linear().range([0, _r]),
    _nodes,
    _bodyG;

  _chart.render = function () {
    if (!_svg) {
      _svg = d3.select("body").append("svg")
        .attr("height", _height)
        .attr("width", _width);
    }

    renderBody(_svg);
  };

  function renderBody(svg) {
    if (!_bodyG) {
      _bodyG = svg.append("g")
        .attr("class", "body")
        .attr("transform", function (d) {
          return "translate("
            + (_width - _r) / 2 + ","
            + (_height - _r) / 2
            + ")";
        });
    }

    var pack = d3.layout.pack()
      .size([_r, _r])
      .value(function (d) {
        return d.size;
      });

    var nodes = pack.nodes(_nodes);

    renderCircles(nodes);

    renderLabels(nodes);
  }

  function renderCircles(nodes) {
    // will be explained in the 'how it works...' section
    ...
  }

  function renderLabels(nodes) {
    // omitted
    ...
  }

  // accessors omitted
  ...

  return _chart;
}
This recipe generates the following visualization:
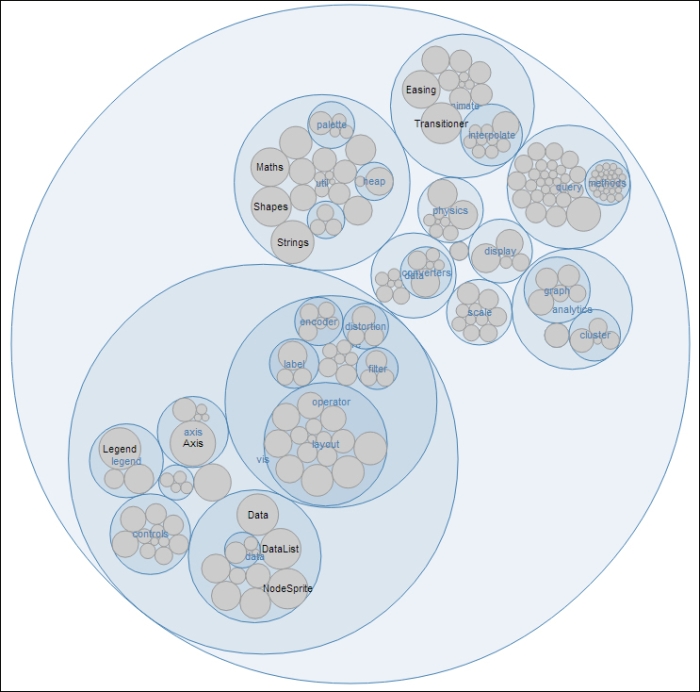
Enclosure diagram
First thing we need to take care of in this recipe is to define our layout; in this case we need to use the d3.layout.pack layout.
var pack = d3.layout.pack()
  .size([_r, _r])
  .value(function (d) {
    return d.size;
  });

var nodes = pack.nodes(_nodes);
Now we set the size of the layout using the outer circle's radius and set the value to use the Flare package size, which in turn will determine each circle's size; hence, effectively making each circle's size proportional to the package size in our data feed. Once layout is created, we feed our data elements through its nodes function generating the layout data with the following structure:

Pack layout data
Circle rendering is done in the renderCircle function:
function renderCircles(nodes) {
  var circles = _bodyG.selectAll("circle")
    .data(nodes);

  circles.enter().append("svg:circle");
Then we simply bind the layout data and create the svg:circle elements for each node.
  circles.transition()
    .attr("class", function (d) {
      return d.children ? "parent" : "child";
    })
    .attr("cx", function (d) {return d.x; })
    .attr("cy", function (d) {return d.y; })
    .attr("r", function (d) {return d.r; });
For update, we set cx, cy, and radius to the value that the pack layout has calculated for us for each circle.
  circles.exit().transition()
    .attr("r", 0)
    .remove();
}
Finally when removing the circle, we reduce the size of the circle down to zero first, before removing them to generate a more smooth transition. Label rendering in this recipe is pretty straight forward with some help from the auto-hiding technique we introduced in this chapter, so we will not cover the function in detail here.
d3.layout.packoffers several functions allowing customization. For more details, please check out its API documentation at https://github.com/mbostock/d3/wiki/Pack-Layout- The Building a treemap recipe for auto label hiding technique.
- This recipe is inspired by Mike Bostock's pack layout example, which you can find at http://mbostock.github.io/d3/talk/20111018/pack.html.