
What if our visualization project is not just about US, but rather concerns the whole world? No worries, D3 comes with various built-in projection modes that work well with the world map that we will explore in this recipe.
Open your local copy of the following file in your web browser hosted on your local HTTP server:
https://github.com/NickQiZhu/d3-cookbook/blob/master/src/chapter12/world.html
In this recipe we will project the world map using various different D3 built-in projection modes. Here is the code sample:
<script type="text/javascript">
    var width = 300, height = 300,
        translate = [width / 2, height / 2];

    var projections = [ // <-A
        {name: 'azimuthalEqualArea', fn:
          d3.geo.azimuthalEqualArea()
                .scale(50)
                .translate(translate)},
        {name: 'conicEquidistant', fn: d3.geo.conicEquidistant()
             .scale(35)
                .translate(translate)},
        {name: 'equirectangular', fn: d3.geo.equirectangular()
             .scale(50)
                .translate(translate)},
        {name: 'mercator', fn: d3.geo.mercator()
             .scale(50)
                .translate(translate)},
        {name: 'orthographic', fn: d3.geo.orthographic()
                   .scale(90)
                      	.translate(translate)},
        {name: 'stereographic', fn: d3.geo.stereographic()
                                .scale(35)
                                .translate(translate)}
    ];

    d3.json("/data/world-50m.json", function (error, world) {//<-B
        projections.forEach(function (projection) {
            var path = d3.geo.path() // <-C
                    .projection(projection.fn);

            var div = d3.select("body")
                    .append("div")
                    .attr("class", "map");

            var svg = div
                    .append("svg")
                    .attr("width", width)
                    .attr("height", height);

            svg.append("path") // <-D
                    .datum(topojson.feature(world,
                       world.objects.land))
                    .attr("class", "land")
                    .attr("d", path);

            svg.append("path") // <-E
                    .datum(topojson.mesh(world,
                       world.objects.countries))
                    .attr("class", "boundary")
                    .attr("d", path);

            div.append("h3").text(projection.name);
        });
    });
</script>
This recipe generates world maps with different projection modes as shown in the following screenshot:
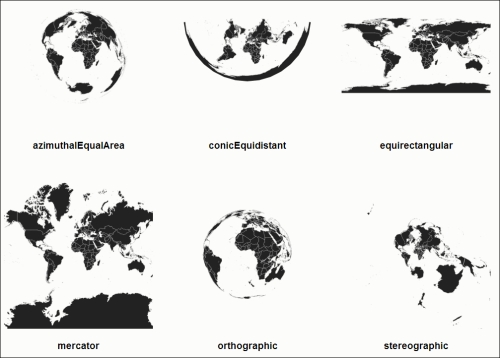
World Map Projection
In this recipe we first define an array containing six different D3 projection modes on line A. A world topology data was loaded on line B. Similar to the previous recipe we have a d3.geo.path generator defined on line C; however, in this recipe we customized the projection mode for geo path generator calling its projection function. The rest of the recipe is almost identical to what we have done in the previous recipe. The topojson.feature function was used to convert topology data into geographic coordinates so d3.geo.path can generate svg:path required for map rendering (line D and E).
- D3 wiki Geo Projection page (https://github.com/mbostock/d3/wiki/Geo-Projections) for more information on different projection modes as well as on how raw custom projection can be implemented