
Fn UI is the user interface project created for Fn. It provides a simple dashboard with easy-to-use time series graphs to monitor how functions are doing in near real time. To start the Fn UI, we create and attach the container to the fn_net, also with the port published to 4000. The Fn UI requires the URL of an Fn Server. But all of them are behind the Fn LB, so we just set FN_API_URL to the Fn LB location.
Please note that they are all connected to each other inside the fn_net network, so the URL appears to be http://fnlb:8081, using the real name and port of fnlb inside the network:
$ docker run --detach
    --network fn_net
    --network-alias fnui
    -p 4000:4000
    -e "FN_API_URL=http://fnlb:8081" fnproject/ui
After setting up the Fn UI instance, browse to localhost:8080 to open the dashboard. We will see all applications listed there, as shown in the following screenshot. An application could be managed, such as creating or deleting, there too. If you do not want the screen to be always auto refreshing, uncheck Auto refresh:

After selecting an application, you can execute a function within the dashboard by clicking the Run Function button, as in the following screenshot. If an error occurs when executing the function and it fails, for example, a notification will pop up as in the following example.
To execute the function, put the Payload in the form of JSON and press the Run button:

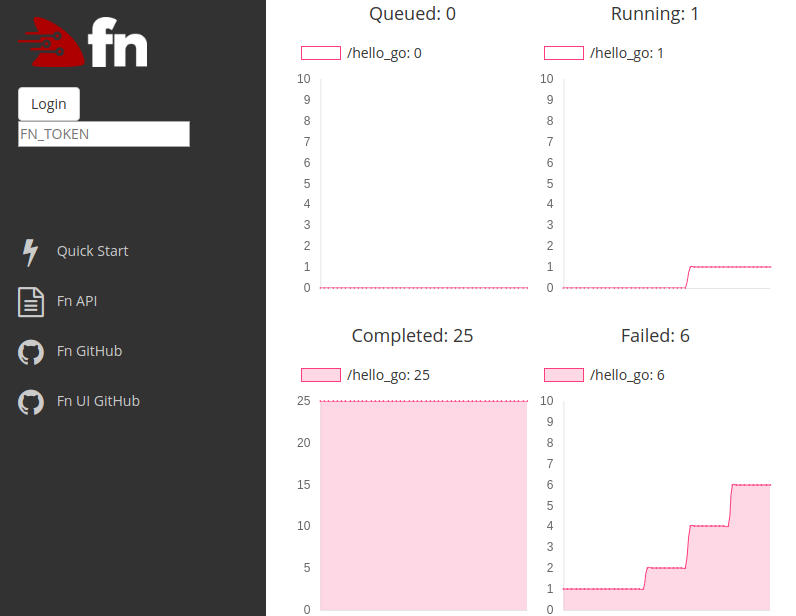
When a function invocation is completed, its name and count will appear in the Completed graph. Here's the curl command to invoke the function. Run it multiple times to see the graph change:
$ curl -X POST -d '{"Name":"chanwit"}' http://localhost:8080/r/demo/hello_go
There is also the Running graph that displays the number of functions still running in parallel. The following screenshot shows these graphs in action:

Let's see what will happen when we run a number of requests with invalid inputs. Here's the command:
$ curl -X POST -d '' http://localhost:8080/r/demo/hello_go
With this, the hello_go function will exit with code 250 and appear in the Failed graph. We run it repeatedly to make the number of failure going up, as seen in the following screenshot:
We now already know how to use the Fn UI to monitor the function invocation. Next, we will use a simple DBMS UI to help browse the logs collected by Fn Servers.