
In computer forensics, the computer is your crime scene. But unlike a human autopsy, computer pathologists often deal with live computers that give signs that something is amiss. This chapter deals with log analysis, which can be considered a branch of forensics (see Chapter 22). Since logs are so important, we have decided to cover them in a standalone chapter.
What are some examples of logfiles? We can classify logfiles by the device that produces them, since the device usually determines the type of information contained in the files. For example, host logfiles (produced by various flavors of Unix and Linux, Windows NT/2000/XP, VMS, etc.) are different from network appliance logs (produced by Cisco, Nortel, and Lucent routers, switches, and other network gear). Similarly, security appliance logs (such as from firewalls, intrusion detection systems, anti-DoS devices, intrusion “prevention” systems, etc.) are very different from both host and network logs. In fact, the security devices manifest an amazing diversity in what they can log and the format in which they do it. Ranging in function from simply recording IP addresses all the way to full network packet traffic capture, security devices usually produce an amazing wealth of interesting information, both relevant and totally irrelevant to the incident at hand. How do we find what is relevant for the crisis du jour? How can we learn about intrusions—past, and even future—from the logs? Is it realistic to expect to surf through gigabytes of logfiles in search of evidence that might not even be there, since the hacker was careful to not leave any traces? This chapter considers all these questions.
Audit trail or log analysis is the art of extracting meaningful information and drawing conclusions about security posture from computer-generated audit records. Log analysis is not a science by a long shot, at least not currently; reliance on individual analysts skills and intuition as well as pure luck play too large a role in this endeavor for log analysis to qualify as a scientific pursuit. This definition of log analysis may sound dry, but the important words are “meaningful conclusions.” Simply looking at logs does not constitute analysis, as it rarely yields anything other than an intense sense of boredom and desperation. In the case of a single-user machine with little activity, almost any previously unseen log record is suspicious, but it’s not so easy in real life.
Let’s consider some general tenets of log analysis. First, even some seemingly straightforward logs (such as an intrusion detection logfile with a successful attack alert) need analysis and correlation with other information sources. Correlation means the manual or automated process of establishing relationships between seemingly unrelated events happening on the network. Events that happen on different machines at different times could have some sort of (often obscure) relationship. Is the target vulnerable to the detected attack? Is this IDS rule a frequent cause of false positives? Is someone on your staff testing a vulnerability scanner on your network? Answers to those and many other similar questions might be needed before activating the response plan upon seeing the IDS alert. Connection attempts, crashed services, and various system failures often require multiple levels of correlation with other information sources in order to extract meaningful data.
This section briefly covers examples of audit logfiles. We discuss Unix logs, and then Windows.
The increasing popularity of commercial and free Unix systems makes Unix log analysis skills a growing priority. Unix and Linux installations produce a flood of messages (via a syslog or “system logger” daemon), mostly in plain text, in the following simple format:
<date / time> <host> <message source> <message>
such as:
Oct  10 23:13:02 ns1 named[767]: sysquery: findns error (NXDOMAIN) on ns2.example.edu?
Oct 10 23:17:14 ns1 PAM_unix[8504]: (system-auth) session opened for user anton by (uid=0)
Oct 10 22:17:33 ns1 named[780]: denied update from [10.11.12.13].62052 for "example.edu"
Oct 10 23:24:40 ns1 sshd[8414]: Accepted password for anton from 10.11.12.13 port
2882 ssh2
This example will be familiar to anyone who has administered a Unix system for at least a day. The format contains the following fields:
- Timestamp
The system time (date and time up to seconds) of the log-receiving machine (in the case of remote log transfer) or the log-producing machine (in the case of local logging).
- Hostname or IP address of the log-producing machine
The hostname may be either the fully qualified domain name (FQDN), such as ns1.example.edu, or just a computer name, such as ns1 in the example above.
- Message source
The source can be system software (sshd or named in the above examples) or a component (such as PAM_unix) that produced the log message.
- Log message
The log message might have different formats, often containing application names, various status parameters, source IP addresses, protocols, and so on. Sometimes the process ID of the process that generated the log record is also recorded in square brackets.
The four log messages above indicate the following, in order :
There is a problem with a secondary DNS server.
A user, anton, has logged in to the machine.
A forbidden DNS access has occurred.
A user, anton, has provided a password to the Secure Shell daemon for remote login from IP address 10.11.12.13.
Unix system logging is handled by a syslog daemon. This daemon first appeared in early BSD systems. Program and OS components can send events to syslogd via a system command, a socket (/dev/log), or a network connection using UDP port 514. Local logging is often implemented via the Unix logging API.
As described in the syslogd manual page, “system logging is provided by a version of syslogd derived from the stock BSD sources. Support for kernel logging is provided by the klogd (on Linux) utility, which allows kernel logging to be conducted in either a standalone fashion or as a client of syslogd.” In standalone mode, klogd dumps kernel messages to a file; in combination mode, it passes messages to a running syslog daemon.
Remote logging requires the syslog daemon to be
configured to listen on UDP port 514 (the standard syslog port)
for message reception. To enable remote reception, you run
syslogd -r in Linux. This
functionality is enabled by default on Solaris and some other Unix
flavors. Messages arrive from the network in plain text with no
timestamp (it is assigned by the receiving machine). The arriving
messages also contain severity and facility values, decoded by the
receiving syslog daemon.
Arriving or locally generated logs are sent to various destinations (such as files, devices, programs, the system console, or other syslog servers) by the syslog daemon using priorities and facilities. Facilities include auth, authpriv, cron, daemon, kern, lpr, mail, mark, news, security (same as auth), syslog, user, uucp and local0 through local7. The syslog manual also provides this list of syslog priorities (in ascending order by importance): debug, info, notice, warning, warn (same as warning), err, error (same as err), crit, alert, emerg, and panic (same as emerg). The priorities error, warn, and panic are present for compatibility with older implementations of syslog.
The syslog configuration file is usually located in /etc/syslog.conf . As shown below, it allows you to configure message sorting into different files and other structures:
*.*                                               @log host
kern.*                                            /dev/console
*.crit                                            anton,other,root
local2.*                                         |/dev/custom_fifo
*.info;mail.none;authpriv.none;cron.none          /var/log/messages
authpriv.*                                        /var/log/secure
mail.*                                            /var/log/maillog
cron.*                                            /var/log/cron
uucp,news.crit                                    /var/log/spooler
local7.*                                          /var/log/boot.log
Messages can be directed to local files (such as
/var/log/messages), sent to devices (such as
a /dev/console), or broadcast to all or
selected logged-in users (anton, other, root) in a manner similar
to the write or wall shell commands. In addition,
messages can be sent to a remote host (see log
host above) and directed to named pipes or FIFOs
(/dev/custom_fifo in the above example)
created with the mknod or
mkfifo commands. Even messages
that just arrived from the network can be forwarded to further
machines, provided the syslog daemon is configured to do so
(syslogd -h in Linux).
Forwarding is disabled by default since it might cause network
congestion and other problems (due to traffic duplication).
Remote logging is a great boon for those wishing to centralize all the audit records in one location. syslog implementations from different Unix flavors interoperate successfully. You can mix and match various Unix boxes in one syslog infrastructure.
Many syslog problems have become apparent over its lifetime. Here is a short list:
The log message format is inconsistent across applications and operating systems. Apart from date and host, the rest of the message is “free form,” which makes analysis difficult if many different messages are present.
Message filtering by priority and facility is not very flexible, thus turning some logfiles into “wastebaskets” of motley message types. There is no way to filter messages by their content, and even adjusting the priority/facility of a log producing program often proves challenging.
UDP-based network transfer is unreliable; if the receiving end of the UDP link (not a connection, since UDP is connectionless) is down, the messages are lost with no chance of recovery.
UDP-based network transfer happens in plain text (unencrypted), with no authentication, little flood protection, and no message-spoofing protection. This can be a security disaster. Usually, it is not a serious problem, since syslog is used on an internal trusted network or even a dedicated management LAN.
When forwarding messages from host to host, only the last “hop” can be seen in the message. Thus, if one machine sends a message to another, which in turn forwards it elsewhere, the arriving message seems to originate at the second machine.
Storing logs in plain-text files makes it difficult to analyze large volumes of log data. Just try to run a complicated
grepcommand on a 5-GB file and you will understand the scope of the problem. While log rotation, archival, and compression all help mitigate the problem, a relational database is highly desirable.Stored logs are vulnerable to modification and deletion, especially when stored locally. It is difficult to check the logfiles for missing pieces and “cooked” data, especially if they are modified by an expert attacker with root access.
Several popular Unix syslog replacements address the above deficiencies. We will look at two well-known replacements: syslog-ng, by BalabIT (http://www.balabit.hu/en/downloads/syslog-ng); and msyslog, by CORE SDI (http://www.corest.com). (A third alternative, Darren Reed’s nsyslog, does not appear to be actively updated anymore.) These programs feature reliable TCP communication with message buffering, more filtering options (in addition to Severity and Facility of standard syslog), non-root secure operation in chroot jail, log database support, better access control and encryption, and even logfile integrity support.
Let’s look at setting up msyslog for a small network. Unlike the above syslog.conf example that sent all the messages to a log host machine over UDP, in this case we will use TCP with buffering and store the logs in the database and a plain=text file. Additionally, we will enable cryptographic protection for the plain-text version of a logfile that allows us to detect changes to stored logs.
On client machines that generate and forward logs, we deploy and configure msyslog. msyslog uses the regular /etc/syslog.conf file with minor changes, as follows:
*.* %tcp -a -h log host -p 514 -m 30 -s 8192
This sends all messages from localhost to the log host via a
TCP port 514 connection, buffering 8,192 messages in case of
connection failure and waiting up to 30 seconds to retry the
connection to the log host. Other lines in
/etc/syslog.conf can be in the usual syslog
form, as described above. Run the daemon via the msyslogd -i linux -i unix command or use the default startup
script provided with the msyslog package.
On the server, we configure msyslog to run as follows:
msyslogd -i linux -i unix -i 'tcp -a -p 514'
This makes the daemon listen for connections on TCP port 514 and allows logging from all machines. Access control rules can be applied to restrict by IP address the hosts that can send logs. We also add crypto protection to more important messages (such as those of priority crit). To enable this, add a line to /etc/syslog.conf as follows:
*.crit %peo -l -k /etc/.var.log.authlog.key %classic /var/log/critical
Next, stop the msyslog daemon, clean or rotate logs, and generate the initial cryptographic key using the enclosed utility:
peochk -g -k /etc/.var.log.authlog.key
Restart the daemon, and log protection is enabled. Upon receiving a new message, msyslog updates the signature. To check the log integrity, run the following:
peochk -f /var/log/messages -k /etc/.var.log.authlog.key
If everything is fine, you’ll see this:
(0) /var/log/critical file is ok
If the logfile was edited, you’ll see:
(1) /var/log/critical corrupted
Additionally, to send all the messages to a database, another line should be added to /etc/syslog.conf as follows:
*.* %mysql -s localhost -u logger -d msyslog -t syslogTB
This line saves a copy of each message in the MySQL database. However, before database collection starts, you should create a schema and grant insert privileges to a “logger” user. This is accomplished via the following command:
echo "CREATE DATABASE msyslog;" | mysql -u root -p
which creates a database instance. Obviously, MySQL must be installed and running on your system for this to work. The next command,
cat syslog-sql.sql | mysql msyslog
defines tables for log storage. syslog-sql.sql is shown below:
CREATE TABLE syslogTB (
  facility char(10),
  priority char(10),
  date date,
  time time,
  host varchar(128),
  message  text,
  seq  int unsigned auto_increment primary key
);
The last step is to grant access privileges for message insertion:
echo "grant INSERT,SELECT on msyslog.* to logger@localhost;" | mysql -u root -p
The above database setup can safely store millions of records. The data can be browsed via a command-line interface (mysql) or one of many GUI database frontends and web frontends (such as PHPMyAdmin, written in PHP).
To conclude, msyslog and syslog-ng interoperate with classic syslog implementations if log transfer is done via UDP. In this case, a mix of new syslog and classic syslog is deployed across the network and a new syslog is deployed on the log-collection server. Many of the advanced features (filtering, integrity checking, database collection) are then available, and only the log network transfer is handled the old-fashioned way.
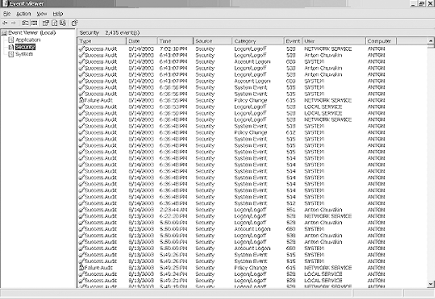
Windows (at least in its more advanced NT/2000/XP versions) also provides extensive system logging. However, it uses a proprietary binary format (*.evt) to record three types of logfiles: system, application, and security.
Figure 18-1 is an example of a Windows security log. The system log contains various records related to the normal (and not-so-normal) operation of the computer. This example shows normal activity on a Windows XP workstation. Double-clicking on an entry drills down to show details (Figure 18-2). To read the Windows event logs, you need to use a viewer or another program that can read the *.evt files. The viewer can also be used to export the files into the comma-separated values for analysis or viewing using a text editor.

A chapter on logging would be incomplete without a section on covert logging. In some situations (such as for honeypots and other scenarios), it is highly desirable to hide the presence of centralized remote logging from visitors to your network. Normally, the syslog configuration files reveal the presence of remote logging and pinpoint the location of logging servers. This enables hackers to attack, possibly take over the log servers, and erase the evidence. In contrast, stealthy logging is difficult for an attacker to detect.
The most basic stealthy logging option is actually not very stealthy. It just provides a backup site for log storage. In addition to the designated log servers (visible to attackers), a sniffer (such as the Snort IDS in sniffer mode, tcpdump, or ngrep) is deployed on a separate machine. For example, if the server with IP address 10.1.1.2 sends logs to a log server at 10.1.1.3, a special machine with no IP address is deployed on the same subnet with a sniffer running. Most sniffers can be configured via the Berkeley Packet Filter (BPF) language to receive only certain traffic. In this case, we will run a command similar to:
ngrep "" src host 10.1.1.2 and dst host 10.1.1.3 and proto UDP and port 514 >
/var/log/stealth-log
This command allows the sniffer (in the case, ngrep, available from http://ngrep.sourceforge.net/) to record only the remote syslog traffic between the two specified hosts and to stream the data into the file /var/log/stealth-log.
Obviously, the tcpdump tool may be used to record all the syslog traffic in binary or ASCII format, but ngrep seems better for this job, since it only shows the relevant part of the syslog packet.
A second stealthy log option sends logfiles to a log host that does not run syslog (or any other networked services). In this case, the host firewall running on the log server simply rejects all incoming UDP port 514 packets. How would that constitute logging, you ask? A sniffer that picks up each UDP packet before it is rejected by the firewall is now deployed on that log server. While none of the host applications see the packet due to its rejection by the firewall, the sniffer (using the above command line) records it into a file.
This might be implemented to avoid a “let’s hack the log server” scenario. In practice, we have used just such a setup on a honeynet decoy network; the messages are sent to a router (which obviously does not care for receiving syslog messages). One can point such a message stream just about anywhere, but using a host with no syslog has the additional benefit of confusing the attacker (and might be considered a configuration error on the part of system administrators).
A third, ultimate stealthy logging option involves sending log data to a nonexistent host and then picking up the data with a sniffer, as outlined above. In this case, one extra setting should be changed on the machine that sends the logfiles: The TCP/IP stack should be tricked into sending packets to a machine that can never respond (since it doesn’t exist). This is accomplished by the following command:
arp -s 10.1.1.4 0A:0B:OC:OD:78:90
This command tricks the IP stack on the log-sending machine into thinking that there is something running on the 10.1.1.4 address. In this case, both the MAC and IP addresses can be bogus, but the IP address should be on the local network. Please note that the MAC address does not have to belong to an actual log server.
The nonexistent server option is preferable if a higher degree of stealth is needed. It might not be applicable for a typical corporate LAN, but it comes handy in various special circumstances.
To conclude, let’s briefly look at other Unix logfiles. In addition to the standard Unix syslogd and klogd logging daemons, there is also the BSD process accounting facility, commonly seen on Linux, Solaris, and BSD variants. Process accounting records the processes running on a Unix system and stores the data in a binary file. Several utilities are provided to examine this data, which looks similar to the following:
lastcomm          S   X root     stdin      3.19 secs Sat Nov  2 22:16
head              S     root     stdin      0.00 secs Sat Nov  2 22:16
egrep                   root     stdin      0.01 secs Sat Nov  2 22:16
grep              S     root     stdin      0.01 secs Sat Nov  2 22:16
bash               F    root     stdin      0.00 secs Sat Nov  2 22:16
bash              SF    root     stdin      0.00 secs Sat Nov  2 22:16
dircolors               root     stdin      0.00 secs Sat Nov  2 22:16
stty                    root     stdin      0.00 secs Sat Nov  2 22:16
bash              SF    root     stdin      0.00 secs Sat Nov  2 22:16
tput                    root     stdin      0.01 secs Sat Nov  2 22:16
bash              SF    root     stdin      0.00 secs Sat Nov  2 22:16
tput                    root     stdin      0.01 secs Sat Nov  2 22:16
su                      anton    stdin      0.04 secs Sat Nov  2 22:16
head                    anton    stdin      0.01 secs Sat Nov  2 22:16
The above record (produced by the lastcomm | head -20 command) shows that
commands including grep, egrep, bash, and even the lastcom command itself were run on the
machine by “root”, and that user “anton” switched to “root” by using
an su command at 10:16 p.m. on
November 2. This binary part of the Unix audit trail completes the
picture provided by the syslog by adding more details on running
processes. Unfortunately, there is no mechanism for the remote
transfer of these audit records.
The Unix logging framework can even be integrated into Windows machines by using solutions such as Kiwi Syslog, available for free at http://www.kiwisyslog.com.
Overall, interpreting Unix messages becomes easy after you have administered a system for a while. The challenge of the analysis is to recreate a complete picture of an intrusion from logs collected by different devices spread across the network, while taking into account the events that occurred over the period of time in question.
In this section, we’ll summarize the above examples and other logs into a somewhat coherent picture of what you might expect to see in a logfile. This summary is in part based on Tina Bird’s post to her log-analysis mailing list (see the “References” section) and the discussion that ensued, which was contributed to by one of this book’s authors.
Some of the events that computers can be set to log are as follows:
System or software startup, shutdown, restart, and abnormal termination (crash)
Various thresholds being exceeded or reaching dangerous levels, such as disk space full, memory exhausted, or processor load too high
Hardware health messages that the system can troubleshoot or at least detect and log
User access to the system, such as remote (telnet, SSH, etc.) and local login and network access (FTP) initiated to and from the system—both failed and successful
User access privilege changes such as the
sucommand—both failed and successfulUser credentials and access right changes, such as account updates, creation, and deletion—both failed and successful
System configuration changes and software updates—both failed and successful
Access to system logs for modification, deletion, and maybe even reading
This intimidating list of events is what might end up in the system logs as available for analysis. Your daunting task is to attempt to answer the question “What happened?” using all of these potentially complex records.
A beginner might start to get squeamish about all this diverse information begging for attention. Maybe, just maybe, you can get away without having to analyze the data? Quite likely the answer is no. A simple law of log analysis is that you don’t log what you don’t plan to look at! Or, as one of Murphy’s Laws puts it, “Only look for those problems that you know how to solve.” In security, that means to only detect what you plan to respond to and only log what you plan to look at. For example, any intrusion detection system (discussed in Chapter 19) is only as good as the analyst watching its output. Thus, if you have no idea what “WEB-CGI webdist.cgi access” means, you have no business running Snort with that signature enabled. Taking appropriate action based on the result will be impossible if you don’t understand what actually happened and what actions are appropriate under the circumstances.
This advice does not negate the argument that logging everything is useful for post-incident forensics and investigation. Indeed, if logs will be used for incident response, rules like “don’t log what you won’t look at” no longer apply. In many cases, logging everything is the best route, since often seemingly insignificant bits allow you to solve the case. We just mean that if logfiles are never looked at (and simply rotated away by the log rotation program), they are not useful.
Consider the case of a home or small office computer system. Here, logs are only useful in the case of major system trouble (such as hardware or operating system failures) or security breaches (which are hopefully easy to prevent, since you only have to watch a single system or a small number of systems). Even under these circumstances, you must look at logs if there is any hope of fixing a problem or preventing its recurrence. Otherwise, your time would be better spent reinstalling your Windows operating system (or better yet, replacing it with Unix). Poring over logs for signs of potential intrusions is not advisable, unless such things excite you or you are preparing for certification in intrusion analysis. Only the minimum amount of logging should be enabled.
Next, let us consider a small- to medium-sized business, which likely has no dedicated security staff. Their security posture is limited to “stay out of trouble.” In this sense, it is similar to a home system, with a few important differences. This environment often includes those people who used to astonish security professionals with comments like, “Why would somebody want to hack us? We have nothing that interests hackers.” Nowadays, most people understand that server disk storage, CPU cycles, and high-speed network connections have a lot of value for malicious hackers. Log analysis for such an organization focuses on detecting and responding to high-severity threats. While it is well known that many low-severity threats (such as someone performing port scans) might be a precursor for a more serious attack (such as an attempted break-in), a small company rarely has the manpower and skills to investigate them.
A large corporate business is regulated by more administrative requirements than a single private citizen. Among these requirements might be responsibility to shareholders, fear of litigation for breach of contract, and professional liability. Thus, the level of security and accountability is higher. Most organizations connected to the Internet now have at least one firewall and some sort of DMZ set up for public servers (web, email, FTP, remote access). Many are deploying intrusion detection systems and Virtual Private Networks (VPNs). All these technologies raise new concerns about what to do with signals coming from them, as companies rarely hire new security staff just to handle those signals. In a large network environment, log analysis is of crucial importance. The logs present one of the few ways of detecting the threats flowing from the hostile Internet.
Overall, the answer to the question “Do I have to do this?” ranges from a petulant “probably not” for a small business, all the way to a solid “Yes, you have to!” for a large company.
The information in logfiles can be extremely rich but unfortunately sometimes the sheer amount of information can complicate analysis. Data rates of several gigabytes of audit information are not uncommon for a large company, especially if network transaction information is being logged. While many methods exist to make this information storable, making it analyzable and applicable for routing monitoring (and not only as a postmortem) is another story. Having logs from multiple machines collected in one place increases the overall volume but simplifies both day-to-day maintenance and incident response, due to higher log accessibility. More effective audit, secure storage, and possibilities for analysis across multiple computing platforms are some of the advantages of centralized logging. In addition, secure and uniform log storage might be helpful if an intruder is prosecuted based on log evidence. In this case, careful documentation of the log-handling procedure might be needed.
While Unix log centralization can easily be achieved with standard syslog, “syslog replacements” do a better job. Log centralization (also called aggregation) serves many important purposes within the enterprise. On the one hand, it is more secure—an intruder would need to hack one more or maybe even several more servers to erase his tracks. On the other hand, it is also more convenient—the administrator simply needs to connect to one machine to look at all logfiles from the entire network. But there are many problems with log aggregation, the most important of which is the incredible amount of log information.
After spending so much effort building a case for audit trail and log analysis, let’s play devil’s advocate and present an argument that strives to negate some of the proposed benefits.
We assume that security incidents are investigated using logfiles. This premise, however, can be questioned. Some sources indicate that every hacker worth his Mountain Dew leaves no traces in system logs and easily bypasses intrusion detection systems. If the activity wasn’t logged, you can’t analyze it. Additionally, logging infrastructure design is known to lead to logfiles being erased—by the very attackers whose presence they track. Again, if you allow the intruder to erase the log, you can’t analyze it.
It often happens (in fact, it happened to one of the authors) that an eager investigator arrives on the scene of a computer incident and promptly activates his response plan: “First step, look at the system logs.” However, much to his chagrin, there aren’t any. The logging either was not enabled or was directed to /dev/null by people who did not want to see “all this stuff” cluttering the drive space. What’s the solution? Well, there isn’t one, actually. If the logs are not preserved until the time it is needed—you can’t analyze it.
Even worse, sometimes there’s a trace of an intrusion in the appropriate system file; for example, an IP address of somebody who connected to an exploited system right about time the incident occurred. But if all you have is an IP address, have you actually proved anything? It is easy to preach about advanced incident response procedures while sitting on a full traffic capture with the intruder’s key-stroke recorded session, but in real life, logs are not always so detailed. If logs are not detailed enough to draw conclusions—all together now—you can’t analyze them.
Log analysis often has to be done in spite of these pitfalls. However, it makes sense to always keep them in mind. If “logging everything” is not an option (due to storage, bandwidth, or application limitations), you might need to analyze what is available and try to reach a meaningful conclusion despite the challenges.
As we’ve mentioned, there are many tools to perform log analysis. However, this chapter would be incomplete without delving into Security Information Management (SIM) solutions.
SIM tools collect, normalize, reduce, analyze, and correlate various logs from across the enterprise. Security events are collected from virtually all devices producing log files, such as firewalls, intrusion detection and prevention systems, and antivirus tools, as well as servers and applications.
First, the log records are converted into a common format (normalization), often using the XML format. Second, they are intelligently reduced in size (aggregation), categorized into various types, and transmitted to a central collection point (usually a relational database) for storage and further analysis. Additionally, the events may be correlated using rule-based and statistical correlation.
Finally, the events are displayed using a real-time graphical console. Tools such as netForensics (http://www.netForensics.com) can process many thousands of incoming security events per second and correlate them in real time, as well as providing long-term trending and analyzing capabilities.
Such tools allow real-time analysis of and response to vast quantities of events. They enable enterprises to gain awareness of what is going on in their IT environments, as well as to become aware of the threats they face.
However, collection of events from millions of devices deployed all over the world might be out of range even for such powerful tools. Still some experts believe that many new attacks might be predicted if devices from diverse locations in the world were logging to a central location. Thus, global log aggregation is needed.
A chapter on log analysis would be incomplete without a word on global log aggregation. Several organizations and companies collect logfiles from everybody willing to share them, and then they analyze the data en mass. SANS’s Dshield.org (http://www.dshield.org), MyNetWatchMan’s Watchman (http://www.mynetwatchman.com), and Symantec’s DeepSight Analyzer (https://analyzer.securityfocus.com) collect various logs from devices ranging in diversity from personal firewalls to enterprise firewalls and intrusion detection systems. These services provide various web interfaces for data analysis and viewing. In addition, if they detect suspicious activities, most of them alert the offender’s ISP on your behalf, possibly causing the attacker to lose his account.
The benefit of such services is for the community, not for individual users. Aggregating vast amounts of log data allows these organizations to detect threats to the Internet early in their course. We saw this in action when the Dshield folks detected the spread of CodeRed in 2001 and the ascent of the MSSQL worm in 2002. A geometrically growing number of port accesses (80 for CodeRed and 1433 for the SQL worm) suggested that an automated attack agent was on the loose. This early-warning system allows security analysts to capture and study the worms and to suggest countermeasures before they get out of hand. We recommend that you consider one of these services (preferably a nonproprietary one) in order to get more familiar with your log data and to contribute to a more secure Internet.
“Advanced Log Processing,” by Anton Chuvakin. (http://online.securityfocus.com/infocus/1613)
“Log Analysis Resource List,” by Tina Bird. (http://www.counterpane.com/log-analysis.html)
“Take Back Your Security Infrastructure,” by Anton Chuvakin. (http://www.infosecnews.com/opinion/2002/08/14_03.htm)
Log-analysis mailing list archives. (http://lists.shmoo.com/pipermail/loganalysis/)
Global log aggregation. (http://www.dshield.org, http://www.mynetwatchman.com)
Tina Bird and Marcus Ranum’s logging site. (http://www.loganalysis.org)