
CHAPTER 21
Business Intelligence for Manufacturing and Supply Chain
Oracle introduced a set of business intelligence products with Release 11 of the E-Business Suite. These are applications that are targeted at senior and middld managers to monitor business process and help in setting organization strategy. These applications are based on a number of business intelligence technologies.
Business Intelligence Technologies
There are a number of job types supported through the business intelligence system. Each job type is supported through a different blend of the business intelligence technologies. The technologies include
![]() Personal Home Page and Portals
Personal Home Page and Portals
![]() Balanced Scorecard
Balanced Scorecard
![]() Activity-based Costing/Activity-based Management
Activity-based Costing/Activity-based Management
![]() Performance Management Viewer
Performance Management Viewer
![]() Performance Management Framework
Performance Management Framework
![]() Discoverer Worksheets and End-user Layer
Discoverer Worksheets and End-user Layer
![]() Business Views and View Generator
Business Views and View Generator
![]() Enterprise Data Warehouse
Enterprise Data Warehouse
How the components fit together is laid out in Figure 21-1.
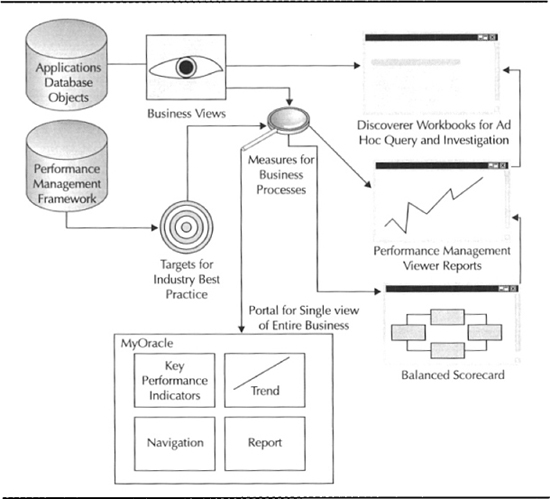
FIGURE 21-1. Business intelligence architecture
The needs of the executive are met with Performance Management Viewer (PMV) and Performance Management Framework (PMF). The PMF allows you to set targets for key business metrics. You can relate metrics into a business strategy that can be rendered as a strategy map or balanced scorecard. A strategy map is a set of metrics linked to show how movement in one metric influences another.
The needs of an analyst are met with Discoverer Workbooks for analysis, drilling into details, and finding patterns and exceptions. The summarized data is built using data warehouse technologies. Analysis is provided by an end-user layer (EUL) that allow users to move up and down levels of summarization and to related information. A business view generator creates views that include columns for key and descriptive flex.
Personal Home Page and Oracle Portal
At press time, most of the intelligence products for the E-Business Suite were delivered as predefined personal home pages. Personal Home Page (PHP) is the Extranet menu system. The PHP is how the self-service applications are exposed. It has the capability to allow those outside the firewall secure access to a Web-based reporting application with rich graphical content.
Recently Oracle Portal has become part of the E-Business Suite technology stack. With this advent, there has been much greater concentration on how the information is delivered. Many smaller reports (portlets) are arranged on a portal page. Content for the portal page is both delivered by Oracle and syndicated by other providers. Portal has the capability to hold a user’s password to many systems. Other systems can delegate the management of authentication to portal completely, obviating the need for many passwords. A portal page can be constructed from portlets from many sources that may all require authentication. Single sign-on (SSO) through Oracle Portal means that the user signs on only once but authenticates to many systems.
Personal Home Page (PHP)
You can personalize the page by clicking the Customize (pencil) icon. These pages and their contents are defined in menus in the normal way. You can define a list of favorites to include links to other applications and Web sites. These home pages can include a number of business intelligence functions.
Performance Measure
Performance Measure is a report of performance against target for a Key Performance Indicator (KPI). KPIs and the PMF are explained later in this chapter.
Trend
The PHP can display graphs that have been constructed from the PMV. PMV is explained later in this chapter.
Ask Oracle
Ask Oracle is a search capability through the library of business intelligence functions. You can “Ask Oracle” a business question, and a list of business intelligence reports and inquiries will be presented to you.
Business Views Catalog
Business views are a layer on top of the Application’s tables. The EUL enables these views to be rendered in discoverer. Relations between these views allow expert users to see how the data relates and construct worksheets for end users. Navigation means that you can query on related business views. This inquiry takes a question about what might be in the application and lists the business views that are relevant. For example, you might be interested in “substitutes,” and the business view catalog might return with the BOM component substitutes from the BOM and engineering business area.
Performance Management Viewer Reports
Business intelligence reports are comparisons of actual values to target values for a performance measure.
Portal
Oracle Portal is the new deployment of business intelligence. PMV and PMF are capable of producing portlets for both tabular and graphical data that can be used in Oracle Portal. SSO capability lets you access data from many data sources within one page. For example, you might choose to have My Stock Quotes from My Yahoo on the same page as a set of KPIs and a trend graph. The page design with Oracle Portal is much closer to what you might expect from a printed executive briefing than an enterprise applications page. You can navigate from the portal to Oracle or other applications without having to log on to those other applications.
Balanced Scorecard
The balanced scorecard, a strategic management concept developed by Robert Kaplan and David Norton, has shown successful results in many private-sector companies, as well as in some government organizations.
The Oracle Balanced Scorecard is an application to help organizations in their process of successfully implementing a business strategy. It organizes business metrics and the relationship between them into a strategy map. You can review the list of metrics as this map or as a scorecard. The scorecard lets you see metrics in the traditional four-quadrant scorecard with quadrants for financial perspective, customer perspective, internal processes, and learning and growth. For example, understanding customer needs might be a learning and growth metric. Having sufficient customer focus group meetings before committing to a design might be an internal process metric. Win/loss ratio might be a customer metric, and sales growth might be a financial metric.
Balanced scorecard lets you work backward from a financial perspective, through the processes and improvements needed to achieve them. It provides simulation capability to allow you to see the improvements that need to be made to achieve the business strategy and drill capability to allow you to navigate to the root cause of an out-of-tolerance metric.
At press time, the integration between balanced scorecard and the PMF was planned. The intelligence products within the E-Business Suite are not shipping preconfigured scorecards.
Activity-based Costing and Management
The E-Business Suite includes an activity-based costing module. This is beyond the activity-based costing that resides within the costing module. It includes the ability to model cost objects other than items, such as customers, services, product lines, and events. The system allocates costs based on activities and activity rates. It also includes a budgeting capability. The system is not a costing system in the same way that Oracle costing is. It is mostly a way to allocate nonfactory costs for finding the “true” costs of servicing an account or selling and supporting a product. Activitybased costing comes with a set of Discoverer Workbooks to analyze returns after the allocation of these costs.
Performance Management Framework (PMF)
The PMF is where you record the targets for the KPIs. The targets can be set at different levels. These targets may form part of the management-by-objective process in your company. The targets can have tolerances surrounding them. When an actual value exceeds one of the tolerances, a corrective action workflow is initiated. As delivered, the corrective action workflows simply notify the owner of the tolerance level for a target and level; you can tailor the workflows to be as complex as you want.
Oracle delivers more than 40 performance measures with the E-Business Suite. To define targets, navigate to the Targets form in the Business Intelligence System (BIS) responsibility. You are presented with a list of targets. Select a target and click the Go button. You are then presented with a list of levels for which the target can be set. Click Go, and record the target value for a given business plan.
Performance Management Viewer (PMV)
The PMV is a reporting tool, dedicated to reporting against targets in the PMF. It is driven by the Web Applications Dictionary. You define views to the dictionary, and you can rename the column names to user-oriented descriptions. You define report regions and report columns in this dictionary. The report column can be a target in PMF. When you define the function for PMV, you simply name the region to be displayed.
Discoverer Worksheets and End User Layer (EUL)
Discoverer is an end-user data-access tool. It provides a way for an “expert user” (not a developer) to create reports from the wealth of information in Oracle Applications. People can use these workbooks with no expertise in the tool or how the data is structured. For example, Oracle provides a number of prebuilt workbooks in the margin analysis and purchasing analysis areas. Discoverer has two editions: Admin and User.
Admin Edition
The Admin edition is where the EUL is created and users are granted access. Discoverer has a security mode for Oracle Applications. It can grant access to a database role or an applications responsibility. The switch in the Discoverer invocations is as follows:
<Drlve>: <Oracle Home >DISCVR31DIS31USR.EXE /APPS_USER
When an application user connects to the database, they can connect with the following:
<User Name>: <Responsibility>/<Password>
Bridges and Gateways
Discoverer comes with gateways to build the EUL from the database data dictionary or the designer repository. It includes bridges to other metadata repositories such as Oracle Warehouse Builder. This allows you to build start points for an EUL that can be tuned to be more understandable by end users.
Business Areas
The primary grouping of the Discoverer content is by business area. Business areas for the EUL delivered by Oracle Applications create a business area per application. The business area needs to be granted to a responsiblity.
Folders
A folder corresponds to either a table or a view. Folders are composed of items. The items can be assigned to an item class. The item class defines the list of valid values for the item.
Hierarchies
The hierarchy definition allows you to define items that you can drill up and drill down on. This allows you to see summary data and drill-to details.
Joins
Joins allow you navigate through different folders in the EUL. You can declare joins in the EUL that are not necessarily foreign keys implemented in the database. Oracle Applications deliver joins in the EUL that correspond to the relationships in the published logical data models in the Business Objects manual.
User Edition
The User Edition is the part of Discoverer that the end users access. Users can open existing workbooks, or they can open folders and set conditions and calculations to create new workbooks. Workbooks can be scheduled to run at periods of low system load. Workbooks can be saved to the database or saved as a file.
Business Views and View Generator
The Discoverer EUL is based on a set of business views. The business views are a set of views that abstract the applications tables to a level that is understandable by end users. For example, the table MTL_SYSTEM_ITEMS might be renamed ITEMS. Foreign keys that might be difficult to resolve without knowledge of the application are resolved in the views. The views can also reflect applications configurations such as key and descriptive flexfield definitions. This will label the column with the title from the key or descriptive flexfield definition. Once your flexfields are configured, you can generate the business views by running the Generate Business Views concurrent request from a BIS super-user responsibility.
Business View Security
The whole business intelligence solution is aimed at cross-enterprise reporting. Those familiar with the multi-organization views will know that these views are restricted to a single operating unit. They are the organization in which the transaction is being performed. When you log into the applications, your transactions are within an operating unit. For example, if an employee places a purchase order, the terms used on the PO are those negotiated within a specific operating unit.
Business views use security profiles. These were originally used within the HR applications. They implement organizational security by specifying a level in the organization hierarchy. HR can support many organization hierarchies. The hierarchy and top organization unit are specified in the security profile. A user logs in with a responsibility. This responsibility is associated with a security profile. The security profile grants access to a point in an organization hierarchy and all organization units under the node specified.
Enterprise Data Warehouse
The E-Business Suite also comes with an enterprise data warehouse (EDW). When a reporting solution needs to collect data from many data sources, the data warehouse can be very valuable. The business intelligence solutions are available on Release 11. The EDW can collect data from Releases 10.7, 11, and 11. i into a data warehouse.
The data warehouse also provides archiving capability. The main components of the data warehouse are facts, such as purchases, and dimensions, such as item. Each dimension can have many hierarchies. Each hierarchy can have many levels. For example, you might want to analyze purchase by item or commodity code. These dimensions ensure information is comparative between data collected in different applications. For example, if you are comparing revenue information from Order Management and Accounts Receivable up and down item hierarchies, these hierarchies are defined once.
Information is collected from the transaction system and loaded into the data warehouse on a net-change basis. Oracle Applications update a Last Update column whenever a row of data is changed. Data with a last-update date earlier than your last collection will not be collected. There are Performance Management targets and reports delivered over the data warehouse. The data warehouse is supplied with its own EUL for analytical and ad-hoc query access. The flow of information into the data warehouse is shown in Figure 21-2.

FIGURE 21-2. Flow of information into the data warehouse
Business Intelligence Applications
The E-Business Suite comes with a number of prebuilt intelligence applications. These applications use the technologies listed previously to answer the business questions for senior and middle management.
Supply Chain Intelligence
Supply Chain Intelligence provides business intelligence for the Order Management and Distribution area. It includes a portal focused on the order management and cash collection activities. It also includes reports and workbooks based on both the transaction system and a datamart dedicated to supply-chain decisions.
Order to Cash Portal
A portal is a collection of portlets arranged on a page. There are many more portlets than are on the default Order to Cash portal. At press time, the Order to Cash portal included portlets for the following:
![]() Order to Cash Performance A list of KPIs covering the order-to-cash process, including revenue, growth, past-due shipments, book to fulfill days, and days sales outstanding (DSO).
Order to Cash Performance A list of KPIs covering the order-to-cash process, including revenue, growth, past-due shipments, book to fulfill days, and days sales outstanding (DSO).
![]() Product Revenue Trend Shows quarter-by-quarter revenue against quarters in the prior year with a projection of the current quarter revenue extrapolated from the current date.
Product Revenue Trend Shows quarter-by-quarter revenue against quarters in the prior year with a projection of the current quarter revenue extrapolated from the current date.
![]() QTD Revenue by Manager Shows the quarter-to-date (QTD) revenue versus prior year, listed by sales manager.
QTD Revenue by Manager Shows the quarter-to-date (QTD) revenue versus prior year, listed by sales manager.
![]() Order to Cash Summary Shows number and value of orders booked, fulfilled, and invoiced, and cash collected for the last week and current quarter against prior year.
Order to Cash Summary Shows number and value of orders booked, fulfilled, and invoiced, and cash collected for the last week and current quarter against prior year.
![]() QTD Revenue by Product Shows the revenue for the current quarter against prior year with rate of growth.
QTD Revenue by Product Shows the revenue for the current quarter against prior year with rate of growth.
![]() Top Orders Summary Shows a listing of the largest orders booked in the period.
Top Orders Summary Shows a listing of the largest orders booked in the period.
![]() Most Returned Items Shows a list of the most returned items, with the value of those returns and the quantity of the item returned.
Most Returned Items Shows a list of the most returned items, with the value of those returns and the quantity of the item returned.
![]() Backorder Summary Shows the number of items and orders backordered and revenue not able to be shipped and invoiced, listed by operating unit.
Backorder Summary Shows the number of items and orders backordered and revenue not able to be shipped and invoiced, listed by operating unit.
![]() Overdue Shipments Summary Shows the number of lines and orders with the revenue affected and the percentage of the QTD revenue that revenue represents.
Overdue Shipments Summary Shows the number of lines and orders with the revenue affected and the percentage of the QTD revenue that revenue represents.
![]() Past Due Receivables Shows an aging analysis of overdue receivables, listed by credit manager.
Past Due Receivables Shows an aging analysis of overdue receivables, listed by credit manager.
![]() Revenue Projection Shows the current QTD revenue versus QTD revenue from the prior year, as of the same day in the quarter. The percentage growth is extrapolated to give the projected full quarter revenue.
Revenue Projection Shows the current QTD revenue versus QTD revenue from the prior year, as of the same day in the quarter. The percentage growth is extrapolated to give the projected full quarter revenue.
![]() Current Year and Prior Year Revenue Shows quarter-by-quarter revenue by the highest levels in the product hierarchy.
Current Year and Prior Year Revenue Shows quarter-by-quarter revenue by the highest levels in the product hierarchy.
Supply Chain Intelligence Reports
Supply Chain Intelligence includes reports over the continuum of the supply chain. These reports are executive-level reports against targets that form both the strategy of the company and the objectives that managers are incented on. An example of a Business Intelligence report is shown in Figure 21-3.

FIGURE 21-3. Sample Business Intelligence report
![]() Sales Order Execution—Bookings The bookings reports include Bookings and Billings; Cancellations and Returns; and a Bookings, Billings, and Shipping analysis workbook.
Sales Order Execution—Bookings The bookings reports include Bookings and Billings; Cancellations and Returns; and a Bookings, Billings, and Shipping analysis workbook.
![]() Sales Order Execution—Backlog The Sales Order Execution Backlog Reports include Billing Backlog, Shipping Backlog, Delinquent Backlog, Unbilled Shipment Backlog, and a Backlog Analysis workbook.
Sales Order Execution—Backlog The Sales Order Execution Backlog Reports include Billing Backlog, Shipping Backlog, Delinquent Backlog, Unbilled Shipment Backlog, and a Backlog Analysis workbook.
![]() Sales Order Execution—Shipping The Sales Order Execution Shipping reports include Order Shipment Volume, One Day Book to Ship, and One Day Pick to Ship. Analysis capability includes workbooks for On-Time Shipment Analysis and Order Fulfillment Analysis and one workbook that covers shipping volume and cycle time analysis.
Sales Order Execution—Shipping The Sales Order Execution Shipping reports include Order Shipment Volume, One Day Book to Ship, and One Day Pick to Ship. Analysis capability includes workbooks for On-Time Shipment Analysis and Order Fulfillment Analysis and one workbook that covers shipping volume and cycle time analysis.
![]() Supply Chain Velocity—Order to Cash The Supply Chain Velocity reports decompose the order-to-ship cycle time into Book to Ship, Book to Fulfill, Book to Pick, and Pick to Ship elements.
Supply Chain Velocity—Order to Cash The Supply Chain Velocity reports decompose the order-to-ship cycle time into Book to Ship, Book to Fulfill, Book to Pick, and Pick to Ship elements.
![]() Supply Chain Velocity—Procure to Pay The Supply Chain Velocity reports decompose the procure-to-pay cycle into Order to Pay, Order to Receive, and Receive to Pay. Analysis capability is provided in the Procurement Cycle Time Analysis workbook.
Supply Chain Velocity—Procure to Pay The Supply Chain Velocity reports decompose the procure-to-pay cycle into Order to Pay, Order to Receive, and Receive to Pay. Analysis capability is provided in the Procurement Cycle Time Analysis workbook.
![]() Supply Chain Inventories The Supply Chain Inventories reports are all data warehouse-based. You can select and view by levels in different hierarchies in the organization and item dimensions. The reports show how often inventory is turning over. This is measured as the ratio between the cost of inventory on hand to the cost of goods sold. You can measure the turnover for years, quarters, and periods. You can report on the quantity and value of on-hand inventory, the value of WIP inventories, the value of expired lots, the value of inventory by type, and the percentage of the total inventory in each type (receiving, WIP, stores, in-transit).
Supply Chain Inventories The Supply Chain Inventories reports are all data warehouse-based. You can select and view by levels in different hierarchies in the organization and item dimensions. The reports show how often inventory is turning over. This is measured as the ratio between the cost of inventory on hand to the cost of goods sold. You can measure the turnover for years, quarters, and periods. You can report on the quantity and value of on-hand inventory, the value of WIP inventories, the value of expired lots, the value of inventory by type, and the percentage of the total inventory in each type (receiving, WIP, stores, in-transit).
Analysis is provided in the Inventory Analysis workbook.
Manufacturing Intelligence
Manufacturing Intelligence is a portal and a set of reports and workbooks that is aimed at the plant or factory manager. The portal gives the plant manager a window on actionable problems and where they stand on key manufacturing and operations metrics. The Manufacturing Intelligence reports cover the mantra time, cost, and quality.
Demand to Build Portal
The Demand to Build portal is a number of portlet reports arranged onto a single page. There are many more portlets than those arranged on this portal page. At press time, the portlets were as follows:
Demand to Build Summary
This is a list of key manufacturing performance indicators with the status of those indicators. The indicators are on-time shipments, product margin, inventory turns, resource efficiency, resource utilization, and scrap value.
Production Performance QTD
The Production Performance QTD graph shows forecasted demand against booked orders, production schedule, and actual production measured in money, week by week.
Customer Satisfaction (Last 7 Days)
Customer satisfaction is measured through the percentage of shipments made on time and the percentage of order lines that customers are returning. On-time shipments are measured as the proportion of order lines planned to ship on a given day that did ship that day.
Production Efficiency (Last 7 Days)
Production efficiency is measured through efficiency (planned resource consumed divided by actual resource consumed), resource utilization (productive time divided by time available), and scrap value (value scrapped divided by value produced).
Largest Production Shortfall QTD (Units)
Production shortfall highlights production quantities that are in the master production schedule but have not been manufactured. It summarizes by product category the units of production scheduled and produced. It shows the value of sales orders that have been promised against the master production schedule but not been produced.
Largest Overproduction QTD (Units)
Largest overproduction highlights production for which there is no master production schedule. It attempts to show product that is subject to holding costs and obsolescence risk because no buyer exists. It shows the production scheduled and produced and the value of that production.
Product Margin
Product margin shows the target and actual margin percentages for the current and four prior quarters by product category.
Manufacturing Cost Variances
Manufacturing cost variances show the target and actual variances for the current and four prior quarters. The manufacturing cost variances are calculated as the total of all the manufacturing variances divided by the expected cost for the items and are aggregated by category.
Inventory Turns
The Inventory Turns portlet shows target and actuals for the current and prior four quarters. Inventory turns are calculated as the value of cost of goods sold in the period divided by the value of inventory at the end of the period.
WIP Days on Hand
The WIP Days on Hand shows target and actuals for the current and prior four quarters. It is the number of days’ worth of production that has sat on the shop floor. It is measured as the value of WIP inventory divided by value of production multiplied by days of production.
Manufacturing Intelligence Reports
Manufacturing intelligence comes with a set of reports built over the data warehouse. These reports are broken down into areas of production management, product quality, variance analysis, critical resources, and performance to plan.
Production Management Reports
For all the production management reports, you can restrict and view by levels in selected hierarchies in the organization and item dimensions and compare with targets from a specified business plan over a given period.
![]() Resources Utilization Compares aggregate available resources with resource applied in comparison to targeted utilization.
Resources Utilization Compares aggregate available resources with resource applied in comparison to targeted utilization.
![]() Material Efficiency Compares the cost of material issued to WIP with the planned cost of material issued for the quantity of assemblies produced. It is what might more traditionally be called material usage variance. If material is backflushed, material efficiency will be merged with inventory count adjustments, as actual usage will be identified only when components are counted.
Material Efficiency Compares the cost of material issued to WIP with the planned cost of material issued for the quantity of assemblies produced. It is what might more traditionally be called material usage variance. If material is backflushed, material efficiency will be merged with inventory count adjustments, as actual usage will be identified only when components are counted.
![]() Resource Efficiency Compares the cost of resources charged to the job with the planned cost of resources for the quantity of assemblies produced. If resources are autocharged, resource efficiencies are not normally generated, although you could have resource efficiency variances if you backflushed resources from an alternate routing.
Resource Efficiency Compares the cost of resources charged to the job with the planned cost of resources for the quantity of assemblies produced. If resources are autocharged, resource efficiencies are not normally generated, although you could have resource efficiency variances if you backflushed resources from an alternate routing.
![]() Production Efficiency Compares the time consumed by time-based resources charging to the job with the aggregate time planned for time-based resources from the manufacturing routings.
Production Efficiency Compares the time consumed by time-based resources charging to the job with the aggregate time planned for time-based resources from the manufacturing routings.
![]() Late Production Completion Compares the number of jobs completed on time with the total number of jobs completed. You can select a production line or report across production lines.
Late Production Completion Compares the number of jobs completed on time with the total number of jobs completed. You can select a production line or report across production lines.
![]() Linearity Index Compares the aggregate quantity output with the quantity planned for one, some, or all production lines.
Linearity Index Compares the aggregate quantity output with the quantity planned for one, some, or all production lines.
Production Management Workbooks
There are workbooks provided for drill and analysis into the areas of production effectiveness analysis, WIP analysis, resource analysis, and continuous improvement analysis.
Product Quality
Manufacturing Intelligence provides quality information from the Oracle Quality product. Reports are available for nonconformity value, quantity, and analysis by defect code. As well as the organization and item dimensions, you can also select and view by the trading partner dimension.
![]() Quality Nonconformity Value Compares the aggregate value of nonconformant material with the total value of material tested.
Quality Nonconformity Value Compares the aggregate value of nonconformant material with the total value of material tested.
![]() Quality Nonconformity Quantity Compares the aggregate quantity of nonconformant material with the total quantity tested.
Quality Nonconformity Quantity Compares the aggregate quantity of nonconformant material with the total quantity tested.
![]() Quality Nonconformity by Defect Code Compares the aggregate quantity of nonconformant material for each defect code.
Quality Nonconformity by Defect Code Compares the aggregate quantity of nonconformant material for each defect code.
Quality Management Workbooks
There are workbooks provided for drill and analysis into the areas of defect analysis and test reports.
Cost Variance Reports
The cost variance reports give you a view of how well you are controlling production activity to standards and the accuracy of those standards.
![]() Manufacturing and Purchase Price Variance Shows the total manufacturing variances and total purchasing variances (Purchase Price Variance and Invoice Price Variance) as both a raw value and a percentage of product cost.
Manufacturing and Purchase Price Variance Shows the total manufacturing variances and total purchasing variances (Purchase Price Variance and Invoice Price Variance) as both a raw value and a percentage of product cost.
![]() Actual Scrap Shows scrap value and percentage of assemblies scrapped against target. You can further refine your selection or set your view-by to production line.
Actual Scrap Shows scrap value and percentage of assemblies scrapped against target. You can further refine your selection or set your view-by to production line.
A workbook for detailed cost variance analysis is also provided.
Purchasing Intelligence
Purchasing Intelligence is the intelligence product that serves the professional buying community. It includes a portal that covers the entire procure-to-pay cycle and a set of reports and workbooks.
Procure to Pay Portal
The Procure to Pay portal is composed of a set of portlets laid out to give you a view of the entire cycle on a single Web page; it spans the time from the moment a need is recognized to the disbursement of funds. It might be used by a vice president of procurement or as a tab on a Chief Executive Officer portal. The actual page is somewhat longer than the section shown in Figure 21-4. Again, there are more portlets defined than have been arranged on the Procure to Pay portal.

FIGURE 21-4. Procure to Pay portal
Performance Measures
The Performance Measures portlet on the Procure to Pay portal has KPIs for QTD, purchases (POs approved), and QTD spend (invoices received). Contract leakage identifies spend for commodities for which contracts exist but have not been used. The procure-to-pay cycle time is broken down into PO approval, order to payment, order to receive, and receipt to pay.
Monthly Travel and Entertainment Expenses
Monthly Travel and Entertainment is a graph broken out period by period for the current and prior years and with month-to-date for current month.
QTD Purchases by Supplier
QTD Purchases by Supplier shows the total value of POs approved in descending order of aggregate spend by supplier. Each supplier is shown with the percentage of total spend and the overall score. The overall score is an index constructed from the price, quality, delivery, and service scores for the supplier.
Monthly Purchases—Total Company
Monthly Purchases is a graph of POs approved period by period.
QTD Purchases by Category
The QTD Purchases by Category shows the aggregate value of POs approved by category. It displays current and prior year with growth or reduction percentage.
QTD Purchases by Manager
Purchases by Manager shows the POs approved by cost center manager. The purchases are rolled up the management chain. Toplevel managers are shown against all the spend that they control, either directly in their cost centers or indirectly through the cost center budgets that they have delegated to their managers. For example, Jane Smith is the general manager of the Consumer Products and Accessories Division. Her direct managers are Bob Jones and Fred Clark. Bob runs the Palmtop product line. He has cost center managers that run service, research and development, and marketing. When the CEO of Neptune is reviewing spend by his managers, he will see the spend of Palmtop R&D included in the purchases for Jane Smith. You can drill up and down the management chain by clicking the names. You can see the current and prior year and QTD spend with a growth or reduction percentage. The previous quarter purchases are also shown.
QTD Contract Savings Opportunities
Contract Savings Opportunities shows the contract leakage and noncontract purchases in the quarter. Contract leakage, as explained earlier, is the value of POs that have been raised without the benefit of negotiated contracts that the company has in place for the commodity purchased. Noncontract purchases are an indicator for the purchasing department that the company is spending money on commodities for which no negotiated contract exists.
Supplier Risk Indicators
Supplier Risk Indicators shows the number of suppliers that are categorized as problem suppliers, at-risk suppliers, and good suppliers. You can see the numbers that fall into each of these categories based on service, delivery, quality, price, and overall.
Payment Discount Opportunities
Payment Discount Opportunities shows the terms discounts that have been lost in the quarter because of missing terms discount dates, as wells as the terms discounts available on accounts payable that are due within the quarter.
QTD Pay Activity Summary
This portlet shows the transaction throughput for each operating unit across PO lines created, receipts created, payables invoices created, and payments created, as well as PO cycle time.
Current Activity Transaction Backlog
The Current Activity Transaction Backlog shows activity that is behind schedule within the procure-to-pay cycle by operating unit. Supplier late activities are late acknowledgements, both number and days late, and overdue receipts. Internal measures are the number of open payments and the average number of days late within accounts payable.
Purchasing Intelligence Reports
In the Purchasing Intelligence Reports, you can restrict and view by levels in hierarchies in the organization, trading partner, and item dimensions.
PO Purchases
This report shows the value of POs approved. You can also restrict and view by the buyer and geography dimension, as well as the operating unit, item, time, and trading partner dimension.
Accounts Payable Spend
Accounts Payable Spend shows the value of invoices received. You can also restrict and view by the AP clerk.
Supplier Scorecard
The Supplier Scorecard shows the score for price, quality, delivery, survey, and total, with a target for each score.
Contract Leakage Report
The Contract Leakage Report tells managers if rogue buying is happening. It is a very powerful report that is worthy of a little explanation.
![]() PO Purchases Shows the value of purchases
PO Purchases Shows the value of purchases
![]() Contract Purchases Shows the value within those purchases that were made under a negotiated contract
Contract Purchases Shows the value within those purchases that were made under a negotiated contract
![]() Leakage Shows the value of purchases that could have been made under negotiated contract, but were not
Leakage Shows the value of purchases that could have been made under negotiated contract, but were not
![]() Potential Savings Shows the value of the difference between the price paid for the commodities and the price available under the negotiated sources.
Potential Savings Shows the value of the difference between the price paid for the commodities and the price available under the negotiated sources.
![]() Actual and Target Shows the percentage leakage percentage of purchases against target
Actual and Target Shows the percentage leakage percentage of purchases against target
Purchasing Workbooks
The E-Business Suite provides workbooks for analysis in spend, contract, supplier performance, supply-base optimization, discount, productivity, and buyer.
Supplier Scorecard Calculations
The Supplier Scorecard and Risk Indicators incorporate a scorecard that shows the relative performance on axes of price, delivery, quality, and survey. The relative scores are displayed. An explanation of how those scores are calculated follows.
Weighted Price Score
The Weighted Price Score displays the price score multiplied by the corresponding weight factor entered in the parameter page for this worksheet. This score is determined by comparing the average price that a supplier gives for an item with the target price. The target price is the “best” price given for an item from any supplier during the same time period. The closer a supplier is to the target price, the higher the supplier’s price score will be. The price score is calculated in the following way:
Price Score =(Transaction Quantity Ordered * (Target Price/ Price))/
Total Quantity Ordered
NOTE
Target price has a detailed algorithm for determining the correct value. The method varies depending on the type of PO, whether there are price breaks, and several other conditions.
Weighted Quality Score
The Weighted Quality Score displays the quality score multiplied by the corresponding weight factor entered in the parameter page for this worksheet. This score is a reflection of the percentage of goods accepted after inspection for a given supplier. The quality score is calculated in the following way:
Quality Score = ((Quantity Received — Quantity Rejected)/Quantity Received)
   * 100
NOTE
The Quantity Received and Quantity Rejected columns come from the receiving transaction table in Oracle Purchasing.
Weighted Delivery Score
The Weighted Delivery Score displays the delivery score multiplied by the corresponding weight factor entered in the parameter page for this worksheet. This score is a reflection of the percentage of on-time deliveries for that supplier. The delivery score is calculated as follows:
Delivery Score = (Quantity Received - Quantity Received Early — Quantity
Received Late)/(Quantity Received + Quantity Past Due) * 100
Weighted Survey Score
The Weighted Survey Score displays the survey score multiplied by the corresponding weight factor entered in the parameter page for this worksheet. This score is a reflection of the average score received by that supplier during a given time period. Scores at the lowest time period are averaged together. For each level in the time dimension, scores continue to be averaged as they are rolled up to the level that you want to analyze. Each individual survey score is calculated as follows:
Survey Score = ((Score - Minimum Score)/(Maximum Score - Minimum Score))
 * 100
Survey scores are entered through special survey forms available in the Oracle Applications source environment. The surveys themselves are created in the same environment, which is where the maximum and minimum scores are defined.
Aggregate (Overall) Score
The overall score displays the aggregate, or total, score for a supplier. Each component score, including price, quality, delivery, and service, is weighted using the corresponding weight factor entered in the parameter window. The weighted scores are then added together to determine the total supplier score.
Summary
This chapter reviewed the various technologies that Oracle employs to provide Business Intelligence within the E-Business Suite. It reviewed the portals that Oracle provides and showed how to customize the portals to your own needs. The chapter also reviewed the performance management framework, illustrated the setting of set targets and tolerances, and showed how the Performance Management viewer reports against these targets. Drilling and pivoting capabilities of Oracle Discoverer and how to move through the end-user layer were also covered. You also looked at the business views and learned how to run the business view generator, build the data warehouse, and adapt the warehouse definition with Oracle Warehouse Builder.
The Business Intelligence Applications were examined, first looking at supply chain intelligence, then manufacturing intelligence, and finally purchasing intelligence. The intelligence products have a portal, a set of reports, and a set of workbooks. In this chapter you reviewed the portal that gathers the business intelligence for a whole process and presents the information in a comprehensive page of information with drills to related reports and information. The reports have a common set of dimensions to view and restrict access to the information; each report and the workbooks that provide analysis capability for each area were discussed.