
The influence of ambient crosswind on the performance of solar updraft power plant system1
Tingzhen Ming1,2, Xinjiang Wang2, Jinle Gui2, Renaud Kiesgen de Richter3, Wei Liu2, Guoliang Xu2, Tianhua Wu2 and Yuan Pan4, 1School of Civil Engineering and Architecture, Wuhan University of Technology, Wuhan, P.R. China, 2School of Energy and Power Engineering, Huazhong University of Science and Technology, Wuhan, P.R. China, 3Institut Charles Gerhardt Montpellier – UMR5253 CNRS-UM2 – ENSCM-UM1–Ecole Nationale Supérieure de Chimie de Montpellier, Montpellier, France, 4School of Electrical and Electric Engineering, Huazhong University of Science and Technology, Wuhan, P.R. China
Abstract
To investigate the impact of a strong ambient crosswind on the system output power through the collector inlet and chimney outlet, numerical analysis on the performances of a solar updraft power plant systems (SUPPS) identical to the prototype in Manzanares, Spain which is exposed to the external crosswind with different velocities was carried out in this chapter. A geometrical model including the solar chimney power plant systems (SCPPS) and its outside ambience was built, and the mathematical models to describe the fluid flow, heat transfer, and output power of the whole system were further developed. The pressure, temperature, and velocity distribution of the air in the ambience and SUPPS together with the output power of the SUPPS were analyzed. The numerical simulation results reveal that ambient crosswind has an influence on the performance of the SUPPS in two ways. On the one hand, when the ambient crosswind is comparably weak, it will deteriorate the flow field and reduce the output power of the SUPPS. On the other hand, it may even increase the mass flow rate and output power if the crosswind is strong enough. Later, to overcome the negative impact of strong ambient crosswind on the performance of the system through the collector inlet, a 2 m high blockage was circularly set a few meters away from the collector inlet. The results revealed that after a blockage was set in front of the collector inlet, the negative influence of ambient crosswind on the performance of the SUPPS was overcome to a great extent.
Keywords
Solar chimney power plant system (SCPPS); ambient crosswind; blockage; output power
7.1 Introduction
The solar updraft power plant systems (SUPPS) are among the most sustainable natural resources for electric power generation. They copy the daily solar thermal air motion in the atmosphere to produce electric energy free of CO2 emissions, and are predicted to be an efficient way of mitigating the unprecedented pressure to reduce CO2 discharge that many countries in the world are facing today. Compared with more conventional solar energy applications, the SUPPS has gained its ascendancy by achieving several goals: easy to procure building materials, fewer contaminants generated throughout its operating process, and a longer operating lifespan. A SUPPS often consists of four key parts: a collector, a chimney, a turbine, and an energy storage layer. The collector, whose canopy is made of transparent or half-transparent materials, such as plastic and glass, is large enough to collect solar energy because of the one-way-screen characteristics of the canopy material. During the day the visible and UV wavelengths of the solar radiation, where most energy of the sunlight spectrum is concentrated, pass through the cover and warm up the air, meanwhile the infrared wavelengths warm up an energy storage layer. The increased air temperature results in a decrease of its density, while in the meantime a strong airflow buoyant force is produced and the chimney stack leads to natural convection in the SUPP. The air momentum will drive a turbine at the foot of the solar chimney stack whereby kinetic energy will be transformed into electric power. During the night, the heated energy storage layer, which is made of soil, stone, or water in tubes, transfers thermal energy to the air inside the collector, allowing night operation.
The first 50-kW SUPPS prototype built that led to the validation of the solar chimney concept was originally erected in Manzanares, Spain by Jörg Schlaich [1], a professor at the University of Stuttgart, in the early 1980s as a result of a joint venture between the German government and a Spanish utility. The chimney was 194.6 m high and 10 m in radius, with the collector being 122 m in radius and 2–6 m in height from inlet to center. This prototype power station worked successfully for more than 7 years.
Since then, relevant studies on the SUPPS have never ceased due to its prosperous future and some significant breakthroughs in theoretical, numerical analysis and prototype experiments which have been since carried out. All around the world several teams are examining the possibilities of building SUPPS, for instance, Enviromission in Australia and in Arizona (USA) [2,3]. Larbi et al. [4] studied the possible performance of a SUPPS in the southwestern region of Algeria, and Dai et al. [5] in the northwestern regions of China; Zhou et al. [6] did the same for the Qinghai-Tibet region of China; Mostafa et al. [7] estimated the performance of a solar chimney under Egyptian weather conditions; Sangi et al. [8] for Iran, and Ketlogetswe et al. [9] studied the case of Bostwana; Hamdan [10] the Arabian Gulf region; Nizetic [11] looked at the feasibility of implementing SUPPS in the Mediterranean region; and Cervone et al. [12] and Bilgen and Rheault [13] developed a mathematical model to evaluate the performance of SUPPS at high latitudes.
Based on the 50-kW prototype in Manzanares, Spain, Haaf et al. [14,15] made primary investigations into the energy balance, design criteria, and cost analysis in the SUPPS. Following that were the same author’s experimental reports on the operating condition of the SUPPS in Spain. In order to analyze the influence of miscellaneous parameters, such as environmental conditions and geometrical dimensions, on the temperature and velocity of air and output power of the solar chimney, the research group led by Professor Sherif [16–21] conducted comprehensive mathematical models to evaluate the fluid flow, heat transfer, and output power performances of various scales of SUPPS and developed three types of experimental prototypes in Florida, with the chimney shape, collector construction, and energy storage layer performance being taken into consideration.
By calculating the performance and efficiency of a SUPPS with chimney friction, turbine, and kinetic energy losses being considered, Gannon and von Backström [22,23] brought forth an air standard cycle analysis of the solar chimney power plant, accompanied by more thorough analysis of SUPPS with turbines being employed by Kröger and Buys [24], Gannon and von Backström [25,26], and Ming et al. [27]. Bernardes et al. [28–30] developed a comprehensive mathematical model to analyze large-scale SUPPS with a double and single collector canopy with an energy storage layer and turbine performance being considered, comparing simulation predictions to experimental results from the prototype plant at Manzanares, and evaluated the operational control strategies applicable to SUPPS. Schlaich et al. [31] presented the basic theory, practical experience, and economy of SUPPS to give a guide for the design of 200-MW commercial SUPPS. Pretorius and Kröger [32,33] developed a comprehensive mathematical model to numerically simulate the SUPPS and analyzed the impact of different calculating methods on output power.
Ming et al. [34] developed a comprehensive model to evaluate the performance of a SUPPS in which the effects of various parameters on the relative static pressure, driving force, power output, and efficiency were further investigated. Zhou et al. [35], Kasaeian et al. [36], and Ferreira et al. [37] conducted various experimental analyses on mini-scale SUPPS. Koonsrisuk and Chitsomboon [38,39] and later Sangi et al. [40] performed detailed theoretical and numerical simulations of SUPPS. Maia et al. [41] theoretically evaluated the influence of some parameters on the behavior of the airflow in a solar chimney indicating that the height and diameter of the chimney are the most important physical variables. Ming et al. [42] and Zheng et al. [43] further studied the power generation and efficiency of the solar chimney power plant systems (SCPPS) coupled with the turbine and discussed effects of different numbers of blades in the Spanish prototype. Also a MW-graded SUPP model was followed by the numerical analysis of the influence of the energy storage layer on the fluid flow, and heat transfer performances of SUPPS by Ming et al. [44] and Xu et al. [45]. As well as this, Ming et al. [46] conducted a numerical analysis on the selection of chimney shape and chimney ratio for a 10 MW SUPPS with the aim of achieving the maximum output power with minimum cost. The results indicated that the cylindrical chimney would be the best choice among the three basic configurations (divergent, conical, and cylindrical chimney), whose optimum H/D value ranges from 6 to 8.
Since 2008, quite a few research studies on SUPPS have been published. Fluri and von Backström [47,48] compared the performance of different turbogenerator layouts, single rotor and counter rotating turbines, both with or without inlet guide vanes, using analytical models and optimization techniques, and discussed the important design parameters. Koonsrisuk and Chitsomboon [39,49–51] predicted the performances of large-scale SUPPSs using the dimensional analysis together with engineering intuition to combine eight primitive variables into only one dimensionless variable that establishes a dynamic similarity between a prototype and its scaled models. Zhou et al. [52] analyzed the influence of chimney height on the performance of SUPPS subjected to standard lapse rate of atmospheric temperature. Zhou et al. [53] and Fluri et al. [54] conducted detailed economic analyses on SUPPSs. Petela [55] conducted a simplified interpretative mathematical model of the SUPPS which could be used to demonstrate feasibility of application of exergy for analysis of SUPPS and for proposing the methodology of the full thermodynamic analysis including exergy. This study presented also the application of the concepts of energy and gravity input for the modified exergetic interpretation of processes. Reports on different applications of conventional SUPPS combined with other systems and sloped SUPPS can be found in Refs. [56–61].
However, a close look at scientific publications shows that researchers focused more on solar effects than on the influence of crosswinds outside the solar chimney. Yet it is generally accepted that, the influence of ambient crosswind on the performance of the SUPPS is self-evident, even as significant as the influence of the solar radiation. Up to now, only a few preliminary studies have been carried out.
Many authors like Niemann and Höffer [62,63] were mainly interested by structural or architectural aspects, concerning mechanics and concrete resistance to wind, vibration, or earthquakes. A model with crosswind was studied by Niemann et al. [64], but was only limited to structural reliability of SUPPS system. Rousseau [65] showed that structural integrity of solar chimneys might be compromised by the occurrence of resonance. The wind gust spectrum peaks near the solar chimney’s fundamental resonance frequency which poses a reliability threat, not only to the solar chimney, but also to all high-rise, slender structures. van Zijl and Alberti [66] presented the results of series of physical experiments in wind tunnels establishing external and internal pressure coefficient distributions and overall drag coefficients for rigid smooth cylinders, and demonstrated the stabilizing role of rigid cylinders with vertical ribs. Harte and van Zijl [67] studied the static wind profile converted to pressures acting on the chimney along its height, as well as along the circumference. Lupi [68] and Borri et al. [69] performed innovative modeling of dynamic wind action on SUPPS, and studied structural optimization of solar towers to minimize wind induced effects but again it was limited to structural dynamics aspects. Harte et al. [70] showed that natural draft cooling towers (CTs) and chimneys of SUPPS have many structural properties in common: they are shell structures made of reinforced concrete, they transport warm air by their internal updraft into the atmosphere, and because of their height, gale actions play the most important role in the design and show how far structural design problems of these structures are common. Krätzig et al. [71] explained the design of high efficient tower shells for SUPPS and CT including their critical response characteristics and demonstrated their close structural mechanical relationship to each other. Lv et al. [72] studied SUPPS structure vibrations and frequencies.
Already in the 1970s large dry CTs reaching up to 300 m, were designed for power stations in arid zones. However, at this height they were a long way off the height needed for professional competitive and operational solar chimneys, which start at approximately 700 m.
Although the operation of solar chimneys and CT are quite different, the problems arising from wind gusts and reduction of air-intake-flow-rate under crosswind conditions which decrease the operation efficiency, are well known because of available real scale results obtained from the large number of CT built over the last 40 years. For SUPPS there is little data available, as the tallest prototype 195 m high was built in 1982 in Manzanares (Spain), and since then one smaller one has been built. The promoters of the Arizona solar tower [73], and of the Wuhai Inner Mongolia SUPPS [74] benefit from little and scarce real scale experience and data to strengthen their preliminary studies. The efficiency of SUPPS depends mainly on the size of the collector area and on the height of the chimney, both reasons for their enormous dimensions: collector diameters up to 7 km and chimney heights up to 1500 m are in predesign.
As the concrete cement has to prove its realistic performance by enduring resistance under environmental and operational conditions, constructing CT shells from 100 to 300 m high is a big challenge and the wind load has been well studied. The challenge is enhanced 10-fold for solar updraft towers from 700 to 1500 m high: high compression stresses under dead weight and wind action, suction, or forced wind vibrations in the upper chimney part. The construction of all these very tall chimneys will make high demands on construction techniques and concrete technologies.
But even if CT have greater seniority, until recently the phenomena responsible for wind decreased performance were not well identified and have grabbed the attention of researchers for many years. The way the CT operates under crosswind conditions is still at the forefront of energy research, whereas in the area of SUPPS it is still in its infancy.
For CT, earlier studies made in 1988 by Radosavljevic and Spalding [75], simulated the fluid flow and temperature distribution in a wet CT affected by crosswind. The wind effect on a natural draught dry-CT was studied in 1993 and 1995 by Du Preez and Kröger [76,77], using a simple turbulence model based on the eddy-viscosity to study the flows inside and on the periphery of the tower. In order to minimize the crosswind effect on the thermal performance of towers, they introduced the windbreak walls. Wei et al. [78] in 1995 used complete sample models and wind tunnel testing to demonstrate the adverse effects of wind on the functioning of dry CTs.
Problems encountered in the operation of CTs in the west of Canada led to Derksen et al. [79] investigating in 1996 the effects of wind on the air intake flow rate. Wind tunnel tests on a 1/25 scale model allowed the study of the external flow patterns, pressure characteristics, and air intake flow rate. They discovered that flow imbalance was the cause of ice formation on the inlet side, as the wind-facing side of the tower presented a flow rate almost increased by 45% whereas the opposite rear side flow rate decreased by 19%.
The numerical simulation performed by Su [80] explained the main reason for decline of the performance of dry-CT under crosswind and provided some foundation to improve its thermal performance under crosswind conditions.
Using the commercial software Fluent, Al-Waked and Behnia [81–83], did a 3-D modeling of a tower and simulated the internal and external flows, introducing the wind speed profile as a new important parameter, to correctly simulate the flow around the tower. They also suggested the windbreak walls as a solution for reducing the adverse effects of wind. Zhai and Fu [84,85] performed a numerical and experimental study of the effects of two windbreak sidewalls on the efficiency of a dry-CT. In 2010, Al-Waked [86] investigated the effects of crosswinds on the thermal performance of natural draft wet CTs.
Goodarzi [87–90] demonstrated that a natural draft dry-CT is significantly affected under crosswind conditions and performance might decrease up to 75% in the range of moderate to high wind-velocity conditions. He proposed a new exit configuration for tower stack that could reduce the throttling effect of deflected plume and increase cooling efficiency.
Very little work has been published about crosswind effects on the performance of SUPPS. Serag-Eldin [91] addressed the degradation of SUPPS performance taking into consideration external ambient crosswind, and introduced the concept of controllable flaps aimed to reduce the proportion of hot air gone with the wind by-passing the chimney stack, but did not continue his analysis further on effects of different ambient wind profiles. Pretorius and Kröger [92] analyzed the influence of ambient winds at 2 m/s by regarding its effects on the annual power output of the solar chimney power plant. The comparison of two models which were simulated gave with quiet ambient conditions an annual power output of 373.2 GWh and with windy ambient conditions 336 GWh (a drop of approximately 11%). The windy conditions resulted in an increased convective heat transfer coefficient, facilitating a greater heat flux from the collector roof to the environment and ultimately lower power output.
In this chapter, we numerically analyze the influence of various magnitudes of ambient crosswind on the pressure, velocity, and temperature distributions, and heat transfer and output power performance of SUPPS.
7.2 Model Description
7.2.1 Geometric Model
In this paper, a simplified model of the SUPPS Manzanares prototype [14] is adopted for the numerical simulation. As shown in Fig. 7.1, the model has a 200-m-high and 5-m-radial chimney and a collector which covers the earth’s surface in a round shape: 120 m in radius and 2 m in height. In order to simulate the performance of the SUPPS exposed to such a vast space, we place the model in the center of an actually nonexistent cubical box with its lengths in x, y, z directions of 400, 400, and 300 m, respectively. A box that has every surface set with different boundary conditions which will be displayed in the ensuing introduction. In this figure, the x-axis is aligned in the velocity direction of the ambient crosswind, and z-axis in the straight up direction. Assuming the symmetric property to be perpendicular to the y-axis direction, only half of the whole system can be taken into consideration as shown in Fig. 7.1, thus the whole geometric dimensions of the cubical box are 400, 200, and 300 m in the x, y, z directions, respectively. Furthermore, in this model, the influence of the energy storage layer was not considered and the geometrical model was not included in the computational model as the present PC could not tolerate the number of meshes of the model including the ambience and the SUPPS with the four parts (collector, turbine, chimney, energy storage layer).

By comparison, the simulation with a much longer X value, say 600 m, downstream of the chimney is also performed, and the influence of this length downstream the chimney on the accuracy of numerical simulation results has been presented in Figs. 7.3 and 7.4. The main aim of this research is to analyze the influence of ambient crosswind on the performance of SUPPS. As for the influence of the outflow from the chimney outlet on the local ambient climate, Zhou et al. [93] has presented some relevant numerical results, and may be one of our further study points will also focus on this.
7.2.2 Mathematical Model
For the SUPPS, we consider the fluid flow inside is natural convection induced by solar radiation heating the ground wall. A criterion number that can measure the intensity of the buoyancy-induced flow is the Rayleigh number being defined as follows:
(7.1)
where ![]() is the maximum temperature increase within the SUPPS.
is the maximum temperature increase within the SUPPS. ![]() , β, and L are the thermal diffusivity, thermal expansion coefficient, and the collector height, respectively. After preliminary calculation, we found that Ra is higher than 1010 which is the upper limit transition value of natural convection from laminar to turbulent flow, therefore the turbulent mathematical model needs to be selected to describe fluid flow within the SUPPS. Also, the density variation in the whole computational model including the SUPPS and ambience is so small that it can even be neglected in Mass and Energy equations, making it necessary to resort to Boussinesq approximation without causing large errors [8]. As a result, Mass equation, Navier-Stokes equation, Energy equation, and standard κ-ε equations can be written as follows:
, β, and L are the thermal diffusivity, thermal expansion coefficient, and the collector height, respectively. After preliminary calculation, we found that Ra is higher than 1010 which is the upper limit transition value of natural convection from laminar to turbulent flow, therefore the turbulent mathematical model needs to be selected to describe fluid flow within the SUPPS. Also, the density variation in the whole computational model including the SUPPS and ambience is so small that it can even be neglected in Mass and Energy equations, making it necessary to resort to Boussinesq approximation without causing large errors [8]. As a result, Mass equation, Navier-Stokes equation, Energy equation, and standard κ-ε equations can be written as follows:
Continuity equation:
(7.2)
Navier-Stokes equation:
(7.3)
Energy equation:
(7.4)
Equation for the turbulent kinetic energy k:
(7.5)
Equation for the energy dissipation:
(7.6)
where Gk denotes the generation of turbulence kinetic energy because of the mean velocity gradients and can be defined as: ![]() .
. ![]() ,
, ![]() , and
, and ![]() represent the turbulent Prandtl numbers for T, k, and ε, respectively: σT=0.9, σk=1.0, σε=1.3. And c1 and c2 are two constants for turbulent model: c1=1.44, c2=1.92.
represent the turbulent Prandtl numbers for T, k, and ε, respectively: σT=0.9, σk=1.0, σε=1.3. And c1 and c2 are two constants for turbulent model: c1=1.44, c2=1.92. ![]() and cμ=0.09.
and cμ=0.09.
The reason why we select the standard κ-ε equation is that the authors simplified the turbine installed at the base of the chimney as a reverse fan as shown in the following Section 7.2.3. The complex geometrical construction of the three dimensional turbine model within the chimney base will result in complex strong vortexes and turbulent flow which could be accurately simulated using RNG or Realizable κ-ε model [94]. However, in this work, the turbine model is treated as a reverse fan—a two dimensional boundary condition which will not result in complex strong vortexes and turbulent flow—so the standard κ-ε equation is accurate enough to describe the present problem. Detailed numerical simulation coupled with a three dimensional turbine will be performed in a future study.
7.2.3 Boundary Conditions
When taken into account the ambient crosswind on the SUPPS, boundary conditions for both the SUPPS which have been shown in the previous chapters and the ambient should be carefully given. Fig. 7.1 also represents the boundary conditions set in this case as well as the coordinate applied to the model. Detailed descriptions of the boundary conditions are shown as follows.
7.2.3.1 Inlet boundary (surface at x=0)
The cases in this paper are based on the assumption that the ambient crosswind is fully developed and the temperature constantly at 293K before flowing into the internal space of this model. According to the logarithmic law of the wind speed profile in the atmospheric boundary layer which was proposed by Prandtl in 1932 the ambient wind inlet velocity can be fitted as the equations below [95]:
(7.7)
(7.8)
In which ![]() stands for the ground surface shear stress and
stands for the ground surface shear stress and ![]() for aerodynamic roughness length of the ground. Specific data of
for aerodynamic roughness length of the ground. Specific data of ![]() for different terrains is available in charts such as the one that was collected by [95]; and in this case
for different terrains is available in charts such as the one that was collected by [95]; and in this case ![]() and
and ![]() are chosen as 0.4 and 0.01 m, respectively, since a flat desert terrain type is preset. After that,
are chosen as 0.4 and 0.01 m, respectively, since a flat desert terrain type is preset. After that, ![]() can be calculated from a given value of wind speed
can be calculated from a given value of wind speed ![]() at a known height, a height in this case is selected to be that of the tip surface of the SUPPS.
at a known height, a height in this case is selected to be that of the tip surface of the SUPPS.
7.2.3.2 Outlet boundary (surfaces at x=400 and z=300)
After the influences of the ambience crosswind and the chimney outlet being taken into account, there are two outlet boundaries in the model as shown in Fig. 7.1: the top surface of the model for the exit of the wind from the solar chimney and the surface of the box parallel to that of the inlet ambient crosswind. Pressure outlet boundary condition is applied to each of these and the simplification that reversed flow is normal to the boundary surface.
7.2.3.3 Ground boundary (surface at z=0)
Both the ground underneath the canopy of the collector and the region outside are contained in the ground boundary condition. The exposed ground outside the collector is assumed to be isothermal and is set to be a wall with a temperature of 318K. This coarse assumption may be more or less influences the accuracy of the simulation results compared to the practical working conditions outside the SUPPS but will not significantly influence the main object of this paper. Consequently, functions for boundary layer are employed here in order to simulate the near-surface flow:
(7.9)
(7.10)
(7.11)
(7.12)
where the subscript s represents “surface value,” while other values without such a subscript are evaluated at nodes that are near the ground surface. According to Eqs. (7.11) and (7.12) the values of ![]() and
and ![]() are fixed respectively in these zones.
are fixed respectively in these zones.
The ground surface covered by the collector canopy is assumed to generate heat fluxes of different values according to various solar radiation intensities. And other parameters set for the wall boundary are quite similar to those of the ground outside the collector. Such simplifications ascribe to the assumptions below:
a. The vibration of wind effects is neglected and thus the time term is considered steady.
b. The solar radiation is uniform vertical incident rays.
c. The ground layer is homogeneous and isotropic.
d. Local heat equilibrium has been achieved between the ground and the air that bypasses it.
e. Radiation heat transfer among the walls of SUPPS in the model is negligible.
All the assumptions introduced are aimed at avoiding analyzing more than one factor simultaneously without deviating too much from the real conditions.
7.2.3.4 Side wall (surface at y=200)
Due to the long distance of side wall from the solar chimney inlet and outlet, the influence of the side wall is relatively small compared with others listed above. There is hardly any amount of kinetic or thermal turbulence here and thus heat and mass transfer between the geometric model and the outside ambience is weak on the side wall. Accordingly, the parameters of the properties of the side wall are chosen to be default during numerical simulation.
7.2.3.5 Symmetry surface (surface at y=0)
As mentioned above, because the model in this case is symmetric in the y-direction, and so is the inlet crosswind, symmetry boundary condition is set in this case in order to alleviate the computing process. As is shown in Fig. 7.1, the computing length in the y-direction is shortened to just its half due to the symmetry scheme, thus reducing the computing grids in a large scale. The only necessary procedure to get a whole-zone field is to mirror the simulated velocity and temperature field to the other side of the symmetry surface.
7.2.3.6 Turbine coupling
3-D numerical simulation of the SUPPS coupled with a turbine conducted by Ming et al. [42] indicated that it is a little difficult to simulate the turbine region and many more meshes are needed to accurately describe flow, heat transfer, and output power performances of the system. For the numerical model in this paper it is impossible to realize the simulation procedure simultaneously including regions of the SUPPS, the ambience, and the 3-D turbine due to the limitation of grid numbers. Fortunately, however, the research work conducted by Pastohr et al. [96] indicated that it is also an efficient way to realize the object by simplifying the 3-D turbine to be a 2-D reversed fan with pressure drop across it being preset. This method was verified by Xu et al. [45] and Ming et al. [46] and was proven to be effective to alleviate the mesh pressure by a 3-D turbine region without significantly affecting total performance of SUPPS. Thereby, the turbine is regarded as a reversed fan with pressure drop across it being preset although a 3-D model for the SUPPS and the ambience is selected. To simulate different output power of the turbine, we assign the pressure drop a group of values ranging from 0 to 200 Pa at an interval of 20 Pa. we can thereby calculate the output power of this model according to the equation below:
(7.13)
where ![]() stands for the electric output power of the turbine,
stands for the electric output power of the turbine, ![]() represents the overall energy conversion efficiency from thermal to electricity, which is preset as 0.72. This number is the multiple of efficiency from thermal to turbine shaft output power and that from turbine shaft output power to electricity, the former being about 0.8 by Schlaich et al. [31] and the latter being 0.9 which is available easily.
represents the overall energy conversion efficiency from thermal to electricity, which is preset as 0.72. This number is the multiple of efficiency from thermal to turbine shaft output power and that from turbine shaft output power to electricity, the former being about 0.8 by Schlaich et al. [31] and the latter being 0.9 which is available easily.
7.2.4 Meshing Skills
In general, for the same meshing zone, the hexahedral (HEX) meshing method is more economical and can reduce false diffusion more efficiently than the tetrahedral one. As a result, HEX grids were applied in the model and the mesh generation procedure of the whole geometric model was executed using the commercial software package Gambit 2.3.16. Fig. 7.2 reveals the grid distribution of the geometric model in different angle of view. Fig. 7.2a shows the grid distribution on the symmetric plane. Because of the anticipated relatively steep gradients in velocity, pressure, and temperature in zones such as at the chimney outlet, near the chimney wall and inside the chimney and collector, the grids need to be more concentrated than in the other zones, which is shown in the form as the darker areas. Fig. 7.2b displays the local grid distribution within the chimney and its outside ambience, with finer grids for the boundary layer near the chimney wall, collector wall, and ground wall and the structured quadrilateral grids were adopted in order to reduce the grid number to improve the computing speed without impairing the meshing quality.

7.2.5 Computational Procedure
The computations have been performed by using the general purpose CFD program Fluent 6.3.26. The QUICK scheme was used to discretize the convective terms and a second order accurate treatment was used for the diffusion terms. The set of discretized algebraic equations was solved in a coupled manner. The iterations were continued until the relative error in the mass conservation equation was below 5×10⁻⁵ and in the energy equation 1×10⁻⁸. The simulation method using the relative static pressure in place of static pressure to analyze the whole pressure distribution of the whole system is the same as that used by Pastohr et al. [96], Ming et al. [34,42,46], and Sangi et al. [40].
In order to test the grid-independent performance of the grid system selected in the numerical simulation, three test cases of the whole model under the same conditions (ambient crosswind is 0 m/s, and solar radiation is 857 W/m2) with grid numbers being 1,511,354; 1,674,272; 1,833,458, respectively, were tested. Numerical simulation results indicated that the volume flow rates of the chimney outlet are 789.19, 822.77, and 833.35 m3/s, respectively, corresponding to the three mesh systems listed above. By comparing the latter two mesh systems, we found that there was only a deviation of approximately 1.3% between these two results, which demonstrated the solutions in this case are grid-independent. The grid spacing and number of 1,674,272 is thus selected as the basic mesh system of this paper.
7.2.6 Selection of Ambient Geometrical Dimensions
The juxtaposed two figures below (Figs. 7.3 and 7.4) reflect the velocity contours in the simulated field. The difference lies in the size of the model, the right one is lengthened in both the x and z directions relative to the left one. Due to the fact that there exists Karman vortex downstream, which would result in the periodic sway of the flow in the rear, it is plausible that the velocity contours behave unsteadily. Moreover, when the lower left quarter of the larger-scale model is cut off and analyzed, it is found that the contours are identical to those in the small one, thus testifying the reasonability of the results got from a model with just 200 m in the downstream domain.
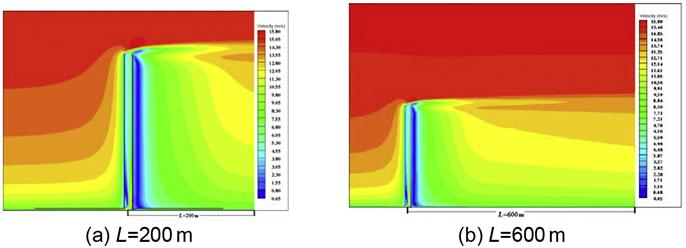

In order to find the impact of the scale of the simulated domain on the performance of SUPPS, based on the two different model, detailed analysis on the outflow updraft velocity under different ambient conditions, especially velocity, has been carried out. As can be seen from Fig. 7.4, a deviation lower than 3% can be detected from the changing curve of the two models shown in Fig. 7.3. Therefore, the power performance, which is the most important parameter we care about, can be considered as reliable results despite the smaller simulated scale. The appropriate main geometrical dimensions are thus shown in Fig. 7.1.
7.3 Results and discussion
For the SUPPS model whose geometrical dimensions mainly come from the prototype in Manzanares, Spain [14], the main factors that influence its characteristics are solar energy input into the system, ambient crosswind, and fore-and-aft pressure drop across the turbine. In this paper, the solar radiation heating the ground surface of the collector can be regarded as heat flux, and wind-velocity magnitude at the top of the chimney and pressure drop across the turbine can be set beforehand.
In this section, the effect of only the ambient crosswind on the performance of SUPPS was researched. A group of wind strength was adopted here: the ambient crosswind velocity at the height of the chimney outlet (200 m) changes from 0 to 15 m/s, at an interval of 5 m/s. According to the logarithmic law of wind profile, in these conditions, the wind velocity at the height of 10 m is 0, 2.2, 4.3, and 6.5 m/s, tantamount to the Beaufort wind force scale 0, 2, 3, and 4, respectively.
Generally, the solar radiation intensity in the deserts of northwest of China varies from 0 to 1400 W/m2. When the absorption of the soil and the energy loss being reflected as the form of radiation heat transfer back to space are taken into consideration, the solar energy transferring to the air as thermal energy within the collector is just 60%–70% of the total amount. Therefore, heat flux through the collector bottom ranges from 0 to 980 W/m2, making 600 W/m2 fairly representative of the common heating condition. Thereby, the heat flux through the ground of the collector was selected as being 600 W/m2, namely, the solar radiation is 857 W/m2, to analyze the effects of ambient crosswind on the velocity, pressure, and temperature distributions of the system qualitatively.
7.3.1 Comparison of Flow Performances
Fig. 7.5 displays the comparison of contours of velocity magnitude at the symmetry plane in the whole simulated area when the velocity of the ambient crosswind at the height of 200 m increases from 0 to 15 m/s and the solar radiation intensity G remains 857 W/m2, constantly, where U200m means the ambient crosswind at the height of 200 m which is also the height of the chimney outlet. It is apparent that when no external wind is blowing horizontally, as shown in Fig. 7.5a, the airflow in the solar chimney and the collector is axisymmetric: air nearby flows into the collector, accelerates gradually and runs centripetally to the foot of the chimney with energy being absorbed from the ground surface of the collector and air temperature increasing gradually; then, the heated air is sucked into the chimney and the updraft reaches its peak at a maximum speed of 19.3 m/s at the chimney bottom and finally passes through the chimney smoothly and steadily until it approaches the top outlet of the chimney. However, when the ambient crosswind at the top of the chimney increases to 5 m/s, as shown in Fig. 7.5b, the negative influences are evident: the airflow at the chimney bottom is deflected with a maximum velocity magnitude less than 13.1 m/s; the outflow from the chimney outlet is also slanted downstream by the ambient crosswind instead of rising straightly upward. The same phenomenon occurs when ambient crosswind velocity at the chimney outlet is 10 m/s shown in Fig. 7.5c, namely, the peak air velocity inside the SUPPS decreases to 11.2 m/s with increasing ambient crosswind velocity. However, when approaching 15 m/s, as shown in Fig. 7.5d, the ambient crosswind does not exacerbate the flow performance of SUPPS, instead, it seems to function oppositely: the peak velocity of airflow within the chimney bottom returns to 12.7 m/s, beyond our expectation according to the former downside influence of ambient crosswind. We can thus find that the ambient crosswind has a two-side effect on the SUPPS from the down-and-up performance of airflow velocity magnitude in the chimney.

Fig. 7.6 contracts the static pressure when the ambient velocity differs from each other. From these figures, it is evident that the pressure undergoes a promotion though the chimney, no matter whether there’s crosswind outside. Inasmuch as no turbine is installed, wall friction mainly contributes to the depletion of pressure difference as the updraft flows inside.

In order to further illustrate the phenomenon observed above, Fig. 7.7 shows the local velocity vectors near the chimney outlet at G=857 W/m2 with different ambient crosswind velocities. To some extent, the vectors can reflect the velocity field as their length stands for the velocity magnitude and the arrow heads for the flow direction. As shown in these contrasted figures, the air from the chimney outlet flows straight upwards without ambient crosswind. Then, the outflow slants to the downstream with the existence of ambient crosswind: the higher the ambient crosswind velocity, the more deflective the outflow. It can be expected that, the weak ambient crosswind will inhibit the existent chimney outflow which is due to the buoyancy effect caused by the solar radiation on the collector ground surface, whereas the weak chimney outflow may be strengthened if ambient crosswind is strong enough. A very strong ambient crosswind horizontally flowing across the chimney outlet may produce a negative-pressure zone near the chimney outlet, resulting in an increase of the chimney outlet air velocity.

Fig. 7.8 displays the local velocity vectors at the chimney bottom at G=857 W/m2 with different ambient crosswind velocities. Comparing Fig. 7.8a to b, we can easily see that airflow within the chimney abates with increasing ambient crosswind, whereas it rises with increasing ambient crosswind from the latter two figures. In addition, there are two phenomena to which we should pay close attention. On the one hand, there is a vortex within the chimney bottom with the existence of the ambient crosswind, and it lies on the left side near the chimney wall as the ambient crosswind flows from the left to the right side. This vortex increases its scope with increasing ambient crosswind, leaving the updraft near the chimney wall on the right side being stronger. On the other hand, looking carefully at the airflow direction within the collector, we can find that the airflow sucked from the area in the ambient crosswind’s downstream half of the collector, which in the figures is the half on the right, is weakened by the existing ambient crosswind. Especially, when the bottom ambient crosswind is strong enough, air may be blown to the outside of the collector instead of converging into the chimney. Therefore, the enthalpy of the heated air is lost, which might be the main reason why ambient crosswind at low speed has negative effects on the performance of the SUPPS.

Pretorius [97], in an attempt to find a “thermo-economically optimized” dimensional configuration of SUPPS by comparing construction costs to annual power output, tested many plant dimensions with a multitude of variables for different cost structures for SUPPS from 500 to 1500 m high. His numerical model predicted plant configurations for which inflow of cold air into the top of the tower (called cold inflow) may exist in the chimney of the SUPPS, especially when air velocities through the plant are low (very slow upward air velocities). The probability of a plant experiencing cold inflow increases with decreasing collector diameter, chimney height, and collector inlet height, as well as increasing chimney diameter.
In general, for Pretorius’ model, if the ratio H/D of the chimney height/chimney diameter is >5 there was no cold inflow, in the absence of crosswind, or with outside wind velocities of 2 m/s at 10 m high and 4 m/s at the top of the chimney. In our model, with a smaller tower (Manzanares model), and higher crosswind velocities from 10 to 20 m/s, inflow of air into the top of the tower seem to be experienced, as seen for the local velocity vectors in Fig. 7.8, at the bottom of the tower.
Serag-Eldin analysis [91] revealed a huge degradation of performance with 10 m/s winds, and even with 2 m/s weak winds a considerable degradation occurs unless the collector inlet height is lower (7.5 m instead of 15 m). As a matter of fact, for his study he took the dimensions suggested by Haaf et al. [14,15] for a 5 MW plant, but the collector entrance is too high (15 m). In our study this height is 2 m like in the Manzanares pilot plant.
In these conditions, Serag-Eldin observed the effect of the atmospheric crosswind is to blow the heated air downstream the collector, rather than up the chimney stack, thus reducing the air temperature in the chimney stack, the temperature difference between hot air in the stack and the atmospheric air outside is lower, the velocity of air in the stack is greatly reduced, and so is the flow rate. Moreover, since this motion is responsible for driving the wind turbine, the plant performance is severely impacted.
In another work [98] Serag-Eldin addressed the problem of performance degradation of SUPPS when they are exposed to strong external atmospheric flows. In an attempt to reduce the hot air escaping sideways he proposed the introduction of controllable flaps (a quarter or a half circle perimeter) at the downstream end of the collector, in order to reduce the proportion of hot air by-passing the chimney stack.
7.3.2 Comparison of Relative Static Pressure Contours
Fig. 7.9 shows the relative static pressure contours near the chimney bottom at G=857 W/m2. Because this is the very place where airflow from the collector converges, the pressure undergoes the steepest gradient at the entrance of the chimney. Also, the negative relative static pressure, which represents the pressure difference between the airflow within the chimney and the stable atmosphere outside, has its minimum value at the turning from the collector to the chimney and then increases gradually through the chimney. By analyzing the contrast of pressure distributions as shown from Fig. 7.9a–d, we can find that the minimum relative static pressures at the chimney bottom are −254.37, −118.36, −79.69, and −95.61 Pa, respectively, in corresponding to the four ambient crosswind velocities: 0, 5, 10, and 15 m/s. As the minimum relative static pressure of the SUPPS is a reflection of the system driving force analyzed by Ming et al. [34], the driving force of the SUPPS will also slump at first and then ascends with increasing ambient crosswind velocity. Besides, the reversed flow field of model exposed in strong ambient crosswind is more expansive than in weak ambient crosswind; in particular, when external crosswind is at a speed of 15 m/s at the top of chimney, the vortex-shedding phenomenon is pretty clear. Also, as shown in Fig. 7.9c,d, the relative static pressure is positive in the downstream half of the collector when the ambient wind is relatively strong, which means that the pressure at this place is higher than that of the ambience at the same height. Thus the air within this zone where the relative static pressure is positive will flow from the collector inlet to the ambience which has been verified previously from the results shown in Fig. 7.8c,d.

7.3.3 Comparison of Temperature Contours
Fig. 7.10 denotes the contrast of temperature contours in the symmetry plane of SUPPS exposed in different ambient crosswind velocities ranging from 0 to 15 m/s. It is evident that the plume of the air outflow from the chimney outlet deflects more and that its average temperature decreases as the external crosswind becomes stronger: the value of the average temperature is 317.75, 303.84, 299.55, and 297.96 K, respectively, for the four conditions. In addition, the plume scope of the air outflow influenced by the ambient crosswind becomes smaller and smaller with increasing ambient crosswind velocity. This is because: on the one hand, the temperature increase of the updraft decreases with increasing ambient crosswind velocity; on the other hand, convection heat transfer between the plume of the updraft and the ambience has been significantly enhanced with increasing ambient crosswind velocity. From what the comparison displayed, it is safe to draw the conclusion that ambient crosswind has a negative influence on the heat transfer process within the SUPPS, thus reducing the buoyant force originating from the density difference between the SUPPS and the ambience. It is apparent that the difference of temperature in the solar chimney among these conditions partly results from the imposed flow by the ambient crosswind underneath the collector, as shown in Fig. 7.10. The crosswind heading toward the collector outlet in the downstream half of the collector brings about the outflow of heated air. This effect may contribute to the waste of buoyant force generated by heated air and deteriorate the SUPP performance. Furthermore, the external crosswind skating over the chimney wall and collector canopy surface may accelerate the heat transfer between the air within the SUPPS and the ambience, leading to the decrease of the updraft temperature increase, but this effect is comparatively insignificant.

7.3.4 Comparison of System Temperature Increase, Driving Force, and Updraft Velocity
In this section, the numerical simulation results of the geometrical model including SUPPS and ambience in Fig. 7.1 being given different solar intensity and ambient crosswind conditions are quantitatively compared and analyzed as shown from Figs. 7.11–7.13.


Fig. 7.11 displays the influences of external crosswind on the temperature increase of the updraft from the chimney outlet. As seen from this figure, the increase of updraft temperature decreases significantly with the increase of ambient crosswind velocity as long as the solar radiation intensity is over zero, and it increases with increasing solar radiation. Similarly, it is the ambient lowermost crosswind flowing into the collector that gives rise to the decrease of the updraft temperature increase. From the more integral data shown here, it is easy to observe that the SUPPS with higher solar radiation is more sensitive to ambient crosswind: the outlet temperature increase plummets from 30.35K to 13.51K, about 17K drop, when solar radiation is 1143 W/m2 with ambient crosswind velocity at the chimney outlet increasing from 0 to 5 m/s, compared with just 7K drop when the solar radiation is 286 W/m2. This phenomenon might be mainly caused by increased cooling of the canopy and by the escape of air with relatively high enthalpy from the collector.
Fig. 7.12 shows the influence of the ambient crosswind on the driving force of SUPPS with different solar radiations, where the minimum value of relative static pressure within the chimney bottom can directly reflect the driving force of the SUPPS.
With solar radiation being more than 286 W/m2 it looks like that with wind speed at 5 and 10 m/s the wind acts as a cover (cap effect) at the tower outlet which decreases the tower airflow.
As shown in this figure, a very interesting phenomenon can be found that, with solar radiation being 0 W/m2, the driving force of the SUPPS increases gradually with increasing ambient crosswind velocity, whereas it decreases significantly to valley values and then gradually increases with increasing ambient crosswind velocity when the solar radiation is over 0 W/m2. Apparently the ambient crosswind has positive influence on the driving force of SUPPS with solar radiation being 0 W/m2, the reason for this might be that the lower the velocity of ambient crosswind that directly enters the collector, the higher the velocity of ambient crosswind that roars past the chimney outlet which will result in a negative-pressure zone near the chimney outlet causing a suction effect of the SUPPS.
The Bernoulli Principle might explain why the higher the velocity of the wind across the top of the chimney of the SUPPS, the faster it will draw air up the chimney (which in turn can increase power output). When wind blows perpendicular to the end of a tube, it creates a vacuum. The higher the wind velocity, the lower the pressure will be, and the more air will be drawn through an open-ended tube. As wind passes over the opening at the top of a chimney, the lower pressure sucks the air up the chimney. In other words with wind blowing with sufficient speed over the top of the chimney, the air pressure at the top is reduced, and tends to draw higher-pressure air from down below. Also the higher the wind speed, the higher the Venturi suction effect at the top of the chimney. The Bernoulli equations are simplifications of the Navier-Stokes Eq. (7.3).
From this figure, when the ambient crosswind velocity is less than 10 m/s, it has negative influence on the driving force of SUPPS; and it will have positive influence on the driving force of SUPPS if it is higher than 10 m/s when the solar radiation is over 0 W/m2. This is because both negative and positive aspects of ambient crosswind influence the system simultaneously. Apparently, when ambient crosswind is relatively weak, the maximum pressure difference under these solar conditions differs much more from what they do when the ambient crosswind velocity approaches 25 m/s. This phenomenon indicates that with the ambient crosswind getting stronger, solar radiation functions less and, is less crucial in determining the performance of SUPPS while the ambient crosswind becomes more and more predominant.
Fig. 7.13 displays the relationship between the average velocity of the updraft and the ambient crosswind velocity under different solar radiation intensity. As shown in this figure, the airflow inside the chimney is notably accelerated with increasing ambient crosswind with solar radiation being 0 W/m2, which is in agreement with the result shown in Fig. 7.12. Similarly, there also exists a valley value of updraft velocity in each line with increasing ambient crosswind when the solar radiation is over 0 W/m2. Take the curve of G=1143 W/m2, for example, we can see that at first the ambient crosswind undermines the average velocity of updraft and further impairs the performance of the SUPPS evidently. However, once the valley point is weathered, the positive effect, namely the suction effect of the SUPPS from the chimney outlet, of external crosswind plays a more important role.
7.3.5 Influence of Crosswind with Turbine Pressure Drop
Fig. 7.14 displays the influence of ambient crosswind on average velocity of updraft with turbine running when the solar radiation is 857 W/m2, where the basic method for the control of the turbine pressure has been presented by Ming et al. [34] and Xu et al. [45]. As shown in this figure, when the turbine pressure drop remains constant, the relation between average velocity of updraft and the ambient crosswind velocity seems to be similar to that shown in Fig. 7.13. That is, the performance of the solar chimney experiences an overall down-and-up process and the minimum of average velocity of updraft occurs when ambient crosswind velocity is 10 m/s. Numerical simulation results with different solar radiation indicate that the similar phenomenon shown above can be found regardless of the pressure drop, at least in the scope of conditions the model of this paper is involved in. Meanwhile, the average velocity of the updraft decreases notably with increasing turbine pressure drop being given the same ambient crosswind velocity. This phenomenon further denotes that the ambient crosswind and the turbine pressure drop are two key factors that influence the performances of SUPPS independently.

In order to evaluate the output power performance of SUPPS exposed to various ambient crosswind velocities, Fig. 7.15 displays how the output power of the turbine, which represents the ability of the SUPPS to convert the solar and wind energy into electric power, can be influenced by the pressure drop across it at G=857 W/m2. As for the curve computed in the absence of ambient crosswind, it is rather easy to see that it is so smooth that a parabolic curve of its overall profile can be deduced from the first half of it, similar to what has been observed by Xu et al. [45]. For this phenomenon, a convincing reason is proposed: according to Eq. (7.13), turbine output is determined by both turbine pressure drop and volume flow rate, only when the extent to which pressure drop increases is considerable can the rate of airflow decrease significantly, making the product of them to climb up at first and then run down with the pressure drop.

In other conditions with ambient crosswind velocity being higher than 0 m/s, although the output power curves experience somewhat similarly, they yet differ much in specifics. Differences are the maximum of output power and the corresponding turbine pressure drop, as well as the protruding extent of the curves. When the ambient crosswind velocity is lower than 15 m/s, it has significant influence on the output power: the maximum output power can be over 50 kW at the turbine pressure drop of 160 Pa without ambient crosswind velocity whereas it is lower than 10 kW with ambient crosswind velocity being 10 m/s. It can also be seen from the three output power curves (U200m=0 m/s, U200m=5 m/s, U200m=10 m/s) that their changing trend is very similar. Thus the ambient crosswind has negative influence on the system output power. However, the output power curves of U200m=15 m/s and U200m=20 m/s as shown in Fig. 7.15 differ greatly from the curves with ambient crosswind velocity being lower than 15 m/s. Take the curves of U200m=20 m/s, U200m=15 m/s, and U200m=10 m/s as an example, we found that being given certain turbine pressure drop, the system output power increases with increasing ambient crosswind velocity, which is notably different from the changing trend shown when ambient crosswind velocity is lower than 15 m/s. Thereby, the ambient crosswind has positive influence on the output power of SUPPS. In addition, the maximum output power of SUPPS can be reached at certain turbine pressure drop point with ambient crosswind velocity being lower than 15 m/s, whereas it can be reached during a broad scope of turbine pressure drop with ambient crosswind velocity being higher than 15 m/s. For instance, when the ambient crosswind velocity is 20 m/s, the system output power is about 13–14 kW with the turbine pressure drop changing from 60 to 160 Pa.
7.3.6 Main Findings
Through the detailed numerical simulations, this chapter has investigated the influences of various ambient crosswind velocities on the performance of SUPPS. The solar radiation and turbine pressure drop were all being taken into consideration in the analysis. The geometrical model including the SUPPS of the Spanish prototype and its ambience were developed together with the mathematical models describing the fluid flow, heat transfer, and output power performances of the system. The fluid flow, temperature, and pressure distributions as well as the temperature increase, driving force, and output power parameters were also presented and analyzed.
The numerical simulation results revealed that the ambient crosswind has significant influence on the fluid flow, heat transfer, and output power performances of the SUPPS. The feature of the influence has two sides, both positive and negative.
The results have indicated that at low speed the wind effects can be attributed to:
• the thermal flow effect at the level of the greenhouse canopy (wind increases convective heat losses from the collector roof to the environment);
• the entering air at the bottom of the tower causing airflow distortions and resistances, the reduction of pressure or temperature difference between the inside and outside of the tower;
• nonuniform air temperature distribution inside the tower and flow distortions;
• the wind flow covers the exit and deflects the plume. As a result the reduction of the effective area of the chimney outlet causes a throttling or a cap effect which decreases the output air flow;
• possible infiltration of wind into the tower through its top resulting in choking flows inside the tower.
The results seem to indicate that at high speed the wind effects can be attributed to:
• a wind suction effect (Bernoulli type, might be increased by a Venturi deflector) at the tower outlet which increases the tower airflow.
It was found that the SUPPSs performance would be deteriorated if the ambient crosswind velocity was below 15 m/s, and the performance was gradually improved with ambient crosswind velocity being higher than 15 m/s. The trend under different external ambient crosswind conditions may contribute to the optimal design and control for the running of the turbine of SUPPS.
7.4 SC Model with Blockage
In this section, the geometrical model was almost similar to that shown in the above. A simplified model of the SUPPS Manzanares prototype [14], was also adopted for the numerical simulation. As shown in Fig. 7.16, the model has a 200-m-high and 5-m-radial chimney and a collector which covers the earth’s surface in a round shape: 120 m in radius and 2 m in height. We placed the model in the center of an actually nonexistent cubical box with its lengths in the x, y, z directions of 400, 600, and 300 m, respectively. In this figure, the x-axis was aligned in the velocity direction of the ambient crosswind, the z-axis in the vertical direction. Assuming the symmetric property to be perpendicular to the y-axis direction, only half of the whole system was taken into consideration as shown in Fig. 7.16, thus the whole geometric dimensions of cubical box are 600, 200, and 300 m in the x, y, z directions, respectively. Similarly to the previous research work, the influence of the energy storage layer was not considered.

It should noted that the ambient wind is not fixed, it can enter the SUPPS from the collector inlet in any direction, so the blockage should be circularly built in front of the collector inlet to avoid all the ambient crosswind in any possible directions.
7.5 Results and Discussion
As mentioned in the previous research work [99], the main factors that influence the characteristics of SUPPS are solar radiation, ambient crosswind, and turbine pressure drop, in which the ambient crosswind significantly affects the key parameters of SUPPS through the collector inlet and chimney outlet. Specially, the contours of temperature, pressure, and velocity within the SUPPS change notably due to the existence of ambient crosswind. In this analysis, the solar radiation is given as 857 W/m2, the influence of a SUPPS with a blockage wall in front of the collector inlet on the system performance is analyzed.
7.5.1 Comparison of Flow Performances
Figs. 7.17 and 7.18 display the comparison of velocity distributions and pressure distributions at the symmetry plane of the SUPPS with/without blockage. It seems that no significant differences can be seen from the two different systems given the same ambient crosswind. However, from Fig. 7.19, we can see that the velocity vectors within the chimney bottom have been improved significantly by using a blockage near the collector inlet. Fig. 7.19a,c,e shows the velocity vectors of the system without blockage, the outflow near the chimney bottom slants to the downstream with the existence of ambient crosswind: the higher the ambient crosswind velocity, the more deflective the outflow. Further, a part of the fluid flows down to the downstream of the collector with strong ambient crosswind as seen in Fig. 7.19e, whereas this phenomenon has not occurred in Fig. 7.19f where the fluid flows from the collector in all directions to the chimney.


7.5.2 Comparison of Relative Static Pressure Contours
Fig. 7.20 shows the relative static pressure contours near the chimney bottom of the SUPPS with/without blockage. It seems from Fig. 7.20b,d that the pressure distributions of the system have not been significantly influenced with ambient crosswind being less than 10 m/s. Although the pressure distribution, shown in Fig. 7.20f, is not as good as those shown in Fig. 7.20b,d, which indicates that an ambient crosswind larger than 15 m/s does influence the system pressure distribution, it is still much better than that shown in Fig. 7.20e. Undoubtedly, it is due to the existence of blockage near the collector inlet that all these improvements in pressure distributions of Fig. 7.20b,d,f can be obtained.

7.5.3 Flow Characteristics Near the Collector Inlet
From the comparisons shown in Figs. 7.19 and 7.20 the ambient crosswind entering the system through the collector inlet has an ill effect on the velocity and pressure distributions near the chimney bottom, and thereby, it will also has an ill effect on the SUPPS performance. Figs. 7.21–7.23 show the detailed local velocity, temperature, and pressure distributions near the collector inlet of SUPPS with blockage. It is clear that the existence of blockage near the collector inlet significantly changes the local velocity, temperature, and pressure distributions near the collector inlet. The blockage effectively holds back the upstream fluid flow coming from the ambient crosswind and flows outside the collector canopy. Certainly, we can see that a small part of the fluid flow carried by ambient crosswind still enters the collector inlet with ambient crosswind velocity being 15 m/s, and we can predict that, an increasing percent of fluid flow carried by ambient crosswind will enter the system through the collector inlet with increasing ambient crosswind velocity, which will deteriorate the SUPPS performance.


7.5.4 Comparison of System Temperature Increase and Driving Force
In this part, numerical simulation results of the two geometrical models, that is, SUPPS with/without blockage and ambience, are quantitatively compared and analyzed as shown in Figs. 7.24 and 7.25.


Fig. 7.24 displays the influence of blockage on the system temperature increase exposed to external ambient crosswind when the turbine is not in operation. As seen from this figure, the increase of updraft temperature decreases significantly with the increase of ambient crosswind velocity both for these two systems. Whereas, the temperature increase of SUPPS with blockage is much higher than that of SUPPS without blockage at any ambient crosswind velocity: the former is even 10K higher than the latter when the ambient crosswind velocity is 5–15 m/s. This is due to the ambient crosswind velocity entering the system through the collector inlet which significantly changes the fluid flow performance of the SUPPS as shown above. After building a blockage wall a few meters away from the collector inlet, this will to some extent avoid ambient crosswind in any directions influencing the inner pressure, velocity, and temperature distributions of the SUPPS. Similar phenomenon can be seen in Fig. 7.25 which displays the relationship between the driving force of the updraft and the ambient crosswind velocity under given solar radiation intensity. From this figure, we can see that the existence of blockage greatly increases the driving force of the system with ambient crosswind being in the scope of 5–20 m/s.
7.5.5 Comparison of System Output Power
A detailed comparison of output power with the two different systems has been displayed in Fig. 7.26. It can easily be seen that, when the ambient crosswind velocity is less than 10 m/s, the output powers of the SUPPS with blockage are very close to that of SUPPS without blockage with ambient crosswind velocity being 0 m/s. In other words, at given ambient crosswind velocity higher than 0 m/s, the output power of SUPPS with blockage is much higher than that of SUPPS without blockage, which further verifies that the negative influence of ambient crosswind on the system performance through the collector inlet can be restrained to a great extent.

On the other hand, although the blockage is utilized, the output power of the SUPPS still decreases significantly with increasing ambient crosswind velocity at a given turbine pressure drop. This phenomenon is caused by the strong negative influence of ambient crosswind through the chimney outlet. This can be overcome only when the turbine pressure drop is over 160 Pa with ambient crosswind velocity being larger than 20 m/s as shown in Fig. 7.26, but the output power could never reach that without ambient crosswind.
In addition, the comparison shown in Fig. 7.26 further indicates that the ambient crosswind has negative influence on the SUPPS performance both though the collector inlet and though the chimney outlet. The adoption of blockage around the collector inlet can only overcome the negative effect on the SUPPS performance through the collector inlet but the negative effect though the chimney outlet could be overcome by finding other methods.
7.5.6 Main Findings
Aiming at decreasing the negative influence of ambient crosswind on the SUPPS performance, a blockage wall was utilized to be built a few meters in front of the collector inlet. The geometrical model including the SUPPS of the Spanish prototype, the blockage and the ambience were developed together with the mathematical models describing the fluid flow, heat transfer, and output power performances of the system. The fluid flow, temperature, and pressure distributions, as well as the temperature increase, driving force, and output power parameters were also presented and analyzed. All the simulation results were compared to the SUPPS without blockage to analyze the effect by utilizing the blockage. The results indicated that the blockage significantly improves the performance of SUPPS exposed to strong ambient crosswind. The velocity, pressure, and temperature distributions within the whole SUPPS have been much better than those of SUPPS without blockage, and therefore, the performance parameters such as temperature increase, driving force, and output power of the SUPPS with blockage all improve significantly at any given ambient crosswind velocity and at any turbine pressure drop.
Nomenclature
![]() specific heat at constant pressure (J/(kg·K))
specific heat at constant pressure (J/(kg·K))
![]() acceleration of gravity (m/s2)
acceleration of gravity (m/s2)
![]() solar radiation intensity (W/m2)
solar radiation intensity (W/m2)
![]() turbulence kinetic energy generation due to the mean velocity gradients (J)
turbulence kinetic energy generation due to the mean velocity gradients (J)
![]() turbulence kinetic energy generation due to turbulence (J)
turbulence kinetic energy generation due to turbulence (J)
q heat flux through the ground underneath the collector (W/m2)
![]() Reynolds number (dimensionless)
Reynolds number (dimensionless)
U200m ambient crosswind velocity at the height of 200 m (m/s)
β volume coefficient of expansion (1/K)