
Helio-aero-gravity (HAG) effect of SUPPS*
Tingzhen Ming1,2, Wei Liu2 and Guoliang Xu2, 1School of Civil Engineering and Architecture, Wuhan University of Technology, Wuhan, P.R. China, 2School of Energy and Power Engineering, Huazhong University of Science and Technology, Wuhan, P.R. China
Abstract
A comprehensive fluid dynamics and heat transfer model to analyze the performance of a solar chimney power plant system (SCPPS) was presented. The relative static pressure was derived, which is capable of giving detailed descriptions of the driving force, maximum system power output and efficiency. Using the solar chimney prototype built in Manzanares, Spain, as a practical example, the numerical results of system relative static pressure was compared with the observation. Numerical studies are performed to explore the geometric modifications on the system performance. The results indicated that solar radiation and geometric parameters, such as the collector radius, the chimney height, and chimney radius, have significant effect on the relative static pressure, driving force, maximum power output, and system efficiency. The results of this study are helpful to the design of the SCPPS.
Keywords
Relative static pressure; driving force; natural convection
3.1 Introduction
The widespread use of solar energy, as an alternate and nondepletable resource for agriculture and industry as well as other applications, is dependent on the development of solar systems which possess the reliability, performance, and economic characteristics that compare favorably with the conventional systems. The solar chimney power plant system (SCPPS), which is composed of the solar collector, the chimney and the turbine, has been investigated all over the world since the German researcher Jorg Schliaich first made the brainchild in the 1970s. The main objective of the collector is to collect solar radiation to heat up the air inside. As the air density inside the system is less than that of the environment at the same height, natural convection affected by buoyancy, which acts as driving force, comes into existence. Due to the existence of the chimney, the cumulative buoyancy results in a large pressure difference between the system and the environment, and the heated then air rises up into the chimney with great speed. If an axis-based turbine is placed inside the chimney where there is a large pressure drop, the potential and heat energy of the air can be converted into kinetic energy and ultimately into electric energy.
After Schlaich’s pioneering work on the solar chimney concept to harness solar energy, Haaf et al. [1] provided the fundamental investigations for the Spanish prototype system in which the energy balance, design criteria, and cost analysis were discussed. Later, the same authors [2] reported preliminary test results of the solar chimney power plant. Krisst [3] demonstrated a “back yard type” device with a power output of 10 W in West Hartford, Connecticut, USA. Kulunk [4] produced a microscale electric power plant of 0.14 W in Izmit, Turkey. Pasumarthi and Sherif [5] developed a mathematical model to study the effect of various environment conditions and geometry on the air temperature, air velocity, and power output of the solar chimney. Pasumarthi and Sherif [6] also developed three model solar chimneys in Florida and reported the experimental data to assess the viability of the solar chimney concept. Padki and Sherif [7] developed a simple model to analyze the performance of the solar chimney. Lodhi [8] presented a comprehensive analysis of the chimney effect, power production, efficiency, and estimated the cost of the solar chimney power plant set up in developing nations. Bernardes et al. [9] presented a theoretical analysis of a solar chimney, operating on natural laminar convection in steady state. Gannon and Backström [10] presented an air standard cycle analysis of the solar chimney power plant for the calculation of limiting performance, efficiency, and relationship between main variables including chimney friction, and system, turbine, and exit kinetic energy losses. Bernardes et al. [11] developed a thermal and technical analysis to estimate the power output and examine the effect of various ambient conditions and structural dimensions on the power output. Pastohr et al. [12] carried out a numerical simulation to improve the description of the operation mode and efficiency by coupling all parts of the solar chimney power plant including the ground, collector, chimney, and turbine. Schlaich [13] presented the theory, practical experience, and economy of the solar chimney power plant to give a guide for the design of 200 MW commercial SCPPSs. Ming et al. [14] presented a thermodynamic analysis on the solar chimney power plant and advanced energy utilization degree to analyze the performance of the system. Liu et al. [15] carried out a numerical simulation for the MW-graded solar chimney power plant, presenting the influences of pressure drop across the turbine on the draft and the power output of the system.
For a SCPPS with certain geometrical dimensions, the important factors which influence the power output are solar radiation, chimney height, and volumetric flux, which have been analyzed and validated by theoretical and experiment investigations. However, the role of pressure difference on the performance of solar chimney systems has long been ignored. Many researchers only recognize the pressure difference as a function of the air density difference and the chimney height [1,8] and Bernardes et al. [11] neglected the theoretical analysis of pressure in the system but gave a comparatively simple driving force expression. Gannon and Backström [10], Krisst [3], Kulunk [4], Pasumarthi [5,6], and Padki [7] also ignored the discussion on pressure difference. Recently, Pastohr et al. [12] presented pressure profiles of the collector numerically, but in his investigation the static pressure inside the collector is positive and increases along the flow direction, which is in contradiction with basic flow theory and the solar chimney principle. Therefore, the effect of pressure difference on the performance of solar chimneys and the pressure field in the system remain unsolved problem, which motivated us to do a thorough analysis on the pressure distribution, exploring the relationship between the relative static pressure and driving force, and predicting the power output and efficiency.
3.2 Relative Static Pressure
Consider the static pressure profiles inside and outside the chimney as shown in Fig. 3.1. Denoting S the static pressure difference between the chimney and the environment at the same height: ![]()

Thereby, S can be regarded as the relative static pressure. Hence S at x and x+dx can be written as:
(3.1)
(3.2)
From the definition of S and the equations above, we have:
(3.3)
In the environment, the relationship between the static pressure and air density can be written as:
(3.4)
Considering a steady adiabatic SCPPS of cylindrical geometry and neglecting the viscous friction, we can write the momentum equation as:
(3.5)
Substituting Eqs. (3.3), (3.4), and (3.5) into Eq. (3.2) yields:
(3.6)
Integrating Eq. (3.6) from 0 to x along the chimney yields:
(3.7)
At the chimney exit, the static pressure must be equal to the ambient atmospheric static pressure at that altitude. Thereby, we get:
Integrating Eq. (3.7) we can get:
(3.8)
For the small scale SCPPSs, the density inside the chimney and the environment can be assumed to be constant. So Eq. (3.8) can be written as:
(3.9)
Substituting Eq. (3.9) into Eq. (3.7) yields:
(3.10)
From Eqs. (3.9) and (3.10), we can easily find that, in the chimney, S has a negative value distribution. In addition, S has a linear relationship with the height of the chimney and the minimum value of S lies in the bottom of the chimney.
Although the expression of S is deduced in the chimney, it can also be used in the whole SCPPS. As the air is heated persistently inside the collector, the density may be less than that of the environment at the same height. Thus S also has a negative value distribution inside the collector.
In the collector, as the air velocity is not very large, the viscous resistance can be neglected. From the Continuity Equation and Bernoulli Equation, we get:
As the height and velocity only change slightly along the flow direction inside the collector, the static pressure also changes slightly. But at the collector exit and the chimney inlet, as the flow section changes significantly, S may change significantly as well.
If the chimney is as high as 1000 m or higher, both the density inside the chimney and in the environment could not be regarded as constant. Thereby, introducing the so-called bulk air density in the system and the environment:
By using the bulk air densities in the deduction above, we can also get the similar form with Eqs. (2.9) and (2.10).
3.3 Driving Force
According to the above analysis, the minimum of S is the integration of pressure differences from the bottom to the chimney exit. As the system is connected with the environment by the collector inlet and the chimney exit, the pressure difference becomes the driving force to impel the air to flow inside the system. Thereby, according to Eq. (3.9), we get:
(3.11)
Eq. (3.11) indicates that the driving force is the absolute value of the relative static pressure at the bottom of the chimney, which can be expressed as the product of air density, gravity, and the chimney height. Unfortunately, this expression cannot give detailed information of the factors which have an effect on the driving force. As to different dimensions of SCPPSs, the collector radius, chimney radius, and solar radiation can also have significant effect on the heating, temperature difference, and air density difference. Hence, it is necessary to give a further discussion of Eq. (3.11).
Taken into account the steady flow with constant solar radiation, radiation heat transfer between the walls and the air inside the system is converted into the convection heat transfer between the soil, canopy, and the air. Evaluation of energy equilibrium along the radius of the collector and in the flow direction is carried out by dividing the collector into several concentric sections. For one of the sections, the energy equilibrium equation can be written:
where ![]() and
and ![]() are the converted convective heat transfer coefficients of the soil and the canopy to the air, respectively, and
are the converted convective heat transfer coefficients of the soil and the canopy to the air, respectively, and ![]() and
and ![]() are the temperature of the soil and canopy, respectively. Because the air flows to the center of the collector, air temperature decreases with the increase of radius. Thereby there is a negative sign on the left hand side of the equation. If we consider that all the solar radiation is absorbed by the air inside the system, the energy can be converted to the heat transfer from the soil to the air:
are the temperature of the soil and canopy, respectively. Because the air flows to the center of the collector, air temperature decreases with the increase of radius. Thereby there is a negative sign on the left hand side of the equation. If we consider that all the solar radiation is absorbed by the air inside the system, the energy can be converted to the heat transfer from the soil to the air:
Then if we integrate the equation above through the whole collector, the temperature profile along the collector can be written:
(3.12)
where ![]() is the collector radius. It is noted that the maximum temperature difference in the collector should be when r=0 in Eq. (3.12).
is the collector radius. It is noted that the maximum temperature difference in the collector should be when r=0 in Eq. (3.12).
The density difference may be expressed in terms of the volume coefficient of expansion, defined by:
(3.13)
Substituting Eqs. (3.12) and (3.13) into Eq. (3.11), we get:
(3.14)
Neglecting the viscosity of the flow, and substituting the Continuity Equation and Bernoulli Equation into Eq. (3.14), we can obtain:
(3.15)
where ![]() is the chimney radius. From Eq. (3.15), we can see that, for the natural convection in the SCPPS, the driving force depends on the chimney height and fluid properties. However, it also depends intensively on the solar radiation and the other dimensions, such as the chimney radius and collector radius.
is the chimney radius. From Eq. (3.15), we can see that, for the natural convection in the SCPPS, the driving force depends on the chimney height and fluid properties. However, it also depends intensively on the solar radiation and the other dimensions, such as the chimney radius and collector radius.
The driving force can be expressed by a function of the collector inlet, but for each solar chimney power plant, the collector inlet changes very little.
3.4 Power Output and Efficiency
After successfully deriving the expression of the driving force, we can easily obtain the expressions of other solar chimney performance parameters.
Substituting Eq. (3.15) into Eq. (3.14), we can get the mass flow rate:
(3.16)
The maximum power output can be expressed as the product of the driving force and the volumetric flow rate:
Substituting Eq. (3.14) to the equation above yields:
(3.17)
Eq. (3.17) shows that the air properties, the chimney height, the collector radius, and the solar radiation have significant effects on the maximum power output. Compared with the formulation advanced by Haaf [1], Eq. (3.17) gives a detailed description of factors which influence the maximum power output.
The maximum efficiency of the system can be expressed by:
Substituting Eq. (3.17) to the equation above, we get:
(3.18)
Eq. (3.18) demonstrates the functional dependence of the system maximum efficiency on the air density, the inlet temperature and the chimney height. Eq. (3.18) gives a more accurate expression of the maximum efficiency of the system compared with the results by Schlaich [13] and Gannon and Backström [10].
3.5 Results and Discussions
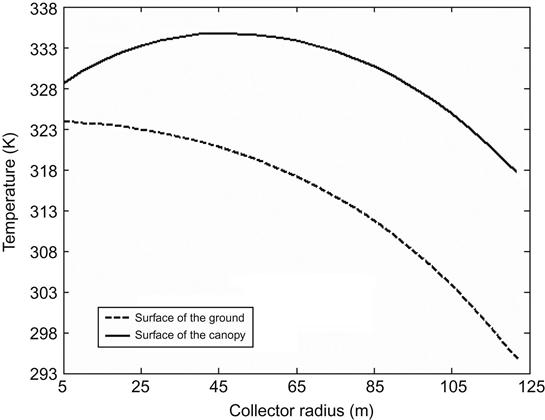
To validate the theoretical analysis, the relative static pressure distributions are compared with the numerical simulation results of the prototype in Manzanares, Spain. Later, solar chimney models with different geometrical parameters were simulated to obtain the flow and temperature contours. During the simulation, the conservation equations for mass, momentum and energy, and standard ![]() turbulent equations are selected [16], and natural convection and gravity effect are taken into consideration. The main boundary conditions are shown in Table 3.1 for energy conservation equations, and the temperature profiles of the ground and the canopy in Fig. 3.2 are different parabolic functions of the radius, and the functions will vary with different solar radiations.
turbulent equations are selected [16], and natural convection and gravity effect are taken into consideration. The main boundary conditions are shown in Table 3.1 for energy conservation equations, and the temperature profiles of the ground and the canopy in Fig. 3.2 are different parabolic functions of the radius, and the functions will vary with different solar radiations.
Table 3.1
Boundary Conditions and Model Parameters
| Place | Type | Value |
| Surface of the ground | Wall | T=f(r)K |
| Surface of the canopy | Wall | T=g(r)K |
| Surface of the chimney | Wall | qchim=0 W/m2 |
| Inlet of the collector | Pressure inlet | S=0 Pa, T0=293.15K |
| Outlet of the chimney | Pressure outlet | S=0 Pa |
Figs. 3.3–3.5 show, when the solar radiation is 800 W/m2, the results of 3D numerical simulations, which are the axis section flow and temperature distributions of the Spanish prototype. From Fig. 3.3, we can find that the relative static pressure distributions are negative in the system, which show good agreement with Eq. (3.10). But the minimum of relative static pressure does not lie at the location of 0 m marked A in Fig. 3.3, on the contrary, there is a large value at this location. The reasons are as follows: The air flowing in all directions causes a large swirl at this location which may result in a much smaller velocity and large static pressure. The real chimney bottom lies in the location labeled B in Fig. 3.3. At this location, the flow section changes greatly which causes the minimum relative static pressure.


The relative static pressure changes greatly at the bottom of the chimney, which shows that the largest pressure gradients also lie in this location. If an axis-based turbine is set up at this location, the static pressure difference can be used to drive the turbine and ultimately can be converted into electric energy.
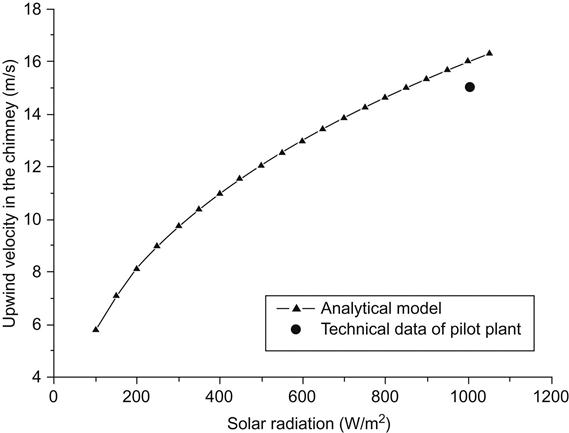
From Figs. 3.6 and 3.7, we can see that the calculations done on the numerical simulation are consistent with the technical data of the Spanish prototype [1]. When the solar radiation is 1000 W/m2, the upwind velocity inside the chimney reaches about 16 m/s, and the temperature difference of the system with no-load condition simulation surpasses 20°C. The results are a little larger than the technical data only because it is supposed in this analytical model that the solar radiation is fully absorbed by the air inside the system.

From Figs. 3.3–3.5, the large swirl which lies in the collector outlet causes very low velocity, high pressure, and high temperature, which will cause large energy losses of the system. Thereby, a modification of the prototype model according to the temperature distribution shown in Fig. 3.5 was done to achieve a much more uniform temperature distribution. Figs. 3.8–3.10 show the flow and temperature contours of the new model. As a result, the local relative static pressure and velocity change significantly at the bottom of the chimney, and the temperature distribution becomes more uniform, but the main velocity, temperature, and pressure in the chimney have no appreciable changes. The larger pressure difference shown in Fig. 3.8 will be positive to the energy conversion process (from thermal and potential energy to kinetic energy) by the turbine. The results suggest that it is feasible to increase the power output by modifying the local configuration of the solar chimney power plant.


Fig. 3.11 shows the relative static pressure profiles at x=1 m in the collector, which indicates that the relative static pressure is negative and decreases along the flow direction. From this figure, we can see that static pressure is less than that of the environment at the same altitude.

Fig. 3.12 shows the relative static pressure profiles with different collector radii but the same chimney height, in which the profile marked R=120 is the prototype of the Spanish model. From this figure, the minimum relative static pressure decreases with the increase of the collector radius. In addition, the relative static pressure profiles in the 0<H<10 m range lie in the collector, the minimum values lie at the bottom of the chimney. The relative static pressure increases along the chimney height, which shows great agreement with Eq. (3.10).
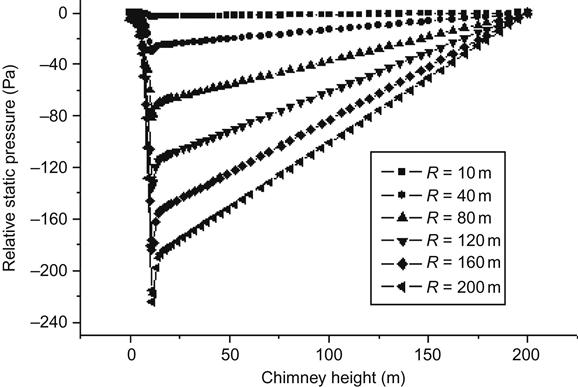
Fig. 3.13 shows the relative static pressure profiles with different chimney heights but the same collector radius, in which the profile marked H=200 m is the prototype of the Spanish model. From this figure, the minimum relative static pressure decreases with the increase of the chimney height, which shows great agreement with Eq. (3.9).

Figs. 3.14–3.16 show the influence of solar radiation, collector radius, chimney height, and chimney radius on the driving force of the system. Fig. 3.14 shows the driving forces in the chimney with the same chimney height but different collector radii, and Fig. 3.15 shows the driving forces with the same collector radius but different chimney heights, while Fig. 3.16 shows the driving forces with the same collector radius and chimney height but different chimney radii.


When the solar radiation is constant, with an increase of the collector radius, the area of the air collector increases, the air temperature in the system increases, which results in a decrease of the air density. Therefore, the relative static pressure in the system increases, and the driving force increases accordingly. Similarly, when the solar radiation increases, the air density will decrease for the same solar chimney model, and the driving force will also increase. The increase of the chimney height will cause an increase of the driving force, which has been validated by theoretical investigations. Fig. 3.15 shows reasonable agreement with Eq. (3.15).
The increase of the chimney radius will cause an increase of the mass flow rate, therefore, the air density will also increases. The increase of the air density will result in the decrease of the air density difference between the chimney and the environment. Thereby, the driving force will decrease, which is also consistent with Eq. (3.15).
Figs. 3.17–3.19 show the effect of solar radiation, collector radius, the chimney height, and the chimney radius on the power output of the system. The three figures indicate that solar radiation has a significant effect on the power output of the system.


As analyzed above, when the solar radiation is constant, with an increase of the collector radius, the area of the air collector increases with the radius by a parabolic relationship, which results in a dramatic increase of the solar energy absorbed by the air. As a result, the air has higher temperature, less density, larger driving force, and eventually a greater power output.
Similarly, an increase of the chimney height causes an increase of the mass flow rate, and the driving force as well. The driving force can be used to drive the axis-based turbine. The increase of driving force will result in the increase of the pressure difference across the turbine. Therefore, the chimney height has a direct effect on the power output of the system. Figs. 3.17 and 3.18 show reasonable agreement with Eq. (3.17).
The effect of chimney radius on the power output is complicated: the increase of chimney radius will cause the increase of mass flow rate, but also the increase of air density and the decrease of the driving force. This latter effect overshadows the effect of the mass flux increase. Therefore, the power output decreases slightly with the increase of the chimney radius.
Figs. 3.20–3.22 show the effect of collector radius, the chimney height, and chimney radius on the system efficiency. The curves of the former efficiency in these figures were obtained according to the formulation advanced by Schlaich [13] and Gannon and Backström [10].


The former efficiency advanced by Schlaich [13] and Gannon and Backström [10] can be influenced only by the chimney height as shown, but it is shown in the following three figures that the solar radiation, the collector radius, and the chimney radius can also have an effect on the maximum efficiency. The maximum efficiency will increase with the increase of solar radiation and collector radius, but decrease with the increase of chimney radius.
It is easy to see from Fig. 3.21 that the chimney height has a significant effect on the maximum efficiency. When the chimney height reaches 300 m, the maximum efficiency will reach 1%. It will surpass 3% when the chimney height reaches 1000 m, which can be used as a large-scale SCPPS.
In addition, the numerical simulation results also show the influence of chimney radius on the relative static pressure, driving force, power output, and the system efficiency. As shown in Fig. 3.22, when the solar radiation is constant, the effect of chimney radius on the performance of the solar chimney power plant is complicated: the increase of chimney radius will cause the increase of mass flow rate, but the increase of air density and the decrease of the driving force as well. This latter effect overshadows the effect of mass flux increase. Therefore, the power output and efficiency decrease slightly with the increase of the chimney radius.
3.6 Conclusions
The objective of this chapter was to evaluate the static pressure distribution and driving force of the solar chimney power plant theoretically. The relative static pressure was developed to analyze the correlation of static pressure between the system and the environment to estimate the pressure difference and the driving force of the system. Later, a detailed model was developed to estimate the influence of driving force by the dimensions of the solar chimney power plant and solar radiation. Then, the theoretical analysis was validated with numerical simulations of different model parameters. The theoretical analysis and numerical simulation results show that:
1. The relative static pressure in the whole system is negative, and the minimum value lies at the bottom of the chimney. The pressure difference may become larger by shrinking the flow section at the conjunction of the collector and chimney.
2. Driving force is the absolute value of the minimum value of relative static pressure. The solar radiation and the geometry of the solar chimney, such as the collector radius, the chimney height, and chimney radius, can have significant effects on the driving force of the system. The driving force of the system increases with the increase of the solar radiation, the collector radius, and the chimney height, while it decreases with the increase of the chimney radius.
3. The maximum power output is the function of the solar radiation, the collector radius, chimney height, and chimney radius. Similarly, the maximum power output of the system increases with the increase of the solar radiation, the collector radius, and the chimney height, but it decreases slightly with the increase of the chimney radius.
4. The maximum efficiency is also the function of air density and chimney height. The air density is the function of the solar radiation, the collector radius, chimney height, and chimney radius. Therefore, the maximum efficiency is influenced by the solar radiation, the collector radius, chimney height, and chimney radius. But the main factor to influence the maximum efficiency is the chimney height. When the chimney height reaches 300 m, the maximum efficiency will reach 1%. It will surpass 3% when the chimney height reaches 1000 m which can be used as a large scale SCPPS.
Nomenclature
S relative static pressure (Pa)
x coordinate in axial direction (m)
cp specific heat capacity of the air 1005 (J/(kg·K))
h heat transfer coefficient (W/(m·K))
qchim heat flux through the chimney wall (W/m2)
T0 temperature of the environment (K)