
Experimental investigation of a solar chimney prototype
Tingzhen Ming1,2, Wei Liu2, Yuan Pan3 and Zhou Zhou2, 1School of Civil Engineering and Architecture, Wuhan University of Technology, Wuhan, P.R. China, 2School of Energy and Power Engineering, Huazhong University of Science and Technology, Wuhan, P.R. China, 3School of Electrical and Electric Engineering, Huazhong University of Science and Technology, Wuhan, P.R. China
Abstract
A mini-scale solar chimney prototype has been set up, and the temperature distribution of the system with time and space, together with the velocity variation inside the chimney with time, has been measured. The experimental results indicate that the temperature distributions inside the collector and the effects of seasons on the heat transfer and flow characteristics of the system show great agreement with the analysis, while the temperature decreases significantly inside the chimney as the chimney is very thin which causes very high heat loss.
Keywords
Solar chimney power plant system; collector; chimney
8.1 Introduction
The solar chimney power generation system (SC), which has the following advantages while compared with the traditional power generation systems: easier to design, more convenient to draw materials, lower cost of power generation, higher operational reliability, fewer running components, more convenient maintenance and overhaul, lower maintenance expense, no environmental contamination, continuous stable running, and longer operational lifespan, is a late-model solar power generation system [1].
No related experimental results on large-scale commercial SC system, however, have ever been reported since the first SC prototype was built in Spanish in 1980s [2,3], which is mainly because of the excessive early cost required. Establishing a large-scale commercial SC of about 200 MW output power requires the financial support from both local government and enterprise. In 1985, Kulunk [4] set up a miniature SC experimental facility. In 1997, Sherif et al. [5–6] set up three SC models by modifying the shape and radius of the collector or canopy in Gainesville of Florida University, and carried out experiments on the temperature and velocity distributions of the airflow inside the canopy, whose results agree well with the theoretical analysis. Zhou et al. [7] presented a comparison of experimental results and simulation results of a pilot SC equipment.
As for the study of theoretical and numerical analysis of the SC systems, many researchers have conducted related mathematical models and simulation results on different kinds of SC systems. Bernardes et al. [8] established a rounded mathematic model for SC system on the basis of the energy-balance principle. Pastohr et al. [9] carried out a two-dimensional steady-state numerical simulation study on the whole SC system which consists of the energy storage layer, the collector, the turbine, and the chimney, and obtained the distributions of velocity, pressure, and temperature inside the collector. Denantes et al. [10] developed and validated an efficiency model at design performance for counter-rotating turbines. Ming et al. [11] developed a comprehensive model to evaluate the performance of an SC system, in which the effects of various parameters on the relative static pressure, driving force, power output, and efficiency have been further investigated. Ming et al. [12,13] established different mathematical models for the collector, the chimney, and the energy storage layer and analyzed the effect of solar radiation on the heat storage characteristic of the energy storage layer. Ming et al. [14] carried out numerical simulations on the SC systems coupled with a three-blade turbine using the Spanish prototype as a practical example and presented the design and simulation of a MW-graded SC system with a five-blade turbine, the results of which show that the coupling of the turbine increases the maximum power output of the system and the turbine efficiency is also relatively rather high. Later, the same authors [15] presented a simple analysis on the thermodynamics of the solar chimney systems.
In this chapter an indoor miniature SC experimental facility is introduced. There are two primary differences between this facility and other experimental facilities shown above: One is that several heaters, replacing the effect of solar radiation, are used to supply energy for the air inside the collector, and the other is that the canopy of this facility is made of heat adiabatic material instead of transparent material as it is unnecessary to receive any energy from the outside. The main work done in this paper includes measurement of temperature and velocity distributions of airflow inside the SC prototype, and analysis of the effects of heat flux exerted on the collector, time and the ambient temperature on the air flow, and heat transfer characteristics of this prototype model.
8.2 Experimental Setup
Fig. 8.1 shows the experimental setup for a miniature SC prototype model. The system is made up of collector canopy, chimney, heaters, and a ground thermal insulating layer. The chimney, of height 2500 mm, outside diameter 106 mm, and wall 2 mm thick, is made of polytetrafluoroethylene; the collector canopy is made of foam which is 30 mm thick and a square 2000 mm in length, the periphery of the canopy is open to the environment with a height of 55 mm; two pieces of rectangular iron sheet of length 2000 mm and width 1000 mm are applied at the bottom of the collector for better heat transfer, under which lies a closed heating space with eight plate electric heaters uniformly installed inside, the resistance of each heater is about 60 Ω, the material under the bottom of the closed space is an adiabatic layer made of perlite with a thickness of 55 mm.

Related laboratory instruments during experiment are shown as follows: 16 copper constantan thermocouples and a 5.5 digit-voltmeter are applied for the temperature measurement of the air inside the collector, chimney, and the environment; a hot wire anemoscope of Testo Company is applied for the measurement of ambient wind and the air velocity within the chimney; and the solar radiation is simulated through setting the voltage of an autocouple voltage regulator.
8.3 Disposal of Measurement Points
As for a SC prototype, the measurement of the system temperature and velocity distributions becomes the most important experimental target. Temperature measurement points were dispersed as shown in Fig. 8.2, among which nine were dispersed inside the collector, four were along the chimney. Moreover, one measurement point was placed on the surface of the collector canopy, one was on the outside wall of the chimney, and one was for the ambient temperature. There were 16 temperature measurement points used to detect the temperature variation of the SC system and the ambient.

For abscissa, from east to west; for vertical ordinate, from south to north, locations for temperature measurement points were shown as follows (units for all measurement points adopt mm): 1(300, 500), 2(600, 500), 3(900, 500), 4(1100, 500), 5(1400, 500), 6(1700, 500), 7(1700, 650), 8(1400, 800), 9(1100, 950). Locations for measurement points along the chimney, from the bottom up, were as follows: 10(1000, 300), 11(1000, 1000), 12(1000, 1500), 13(1000, 2000). Measurement point 14 was on the outer wall of the chimney, measurement point 15 on the outer wall of the collector canopy, and point 16 was used to measure the ambient temperature. There was a little pore used as a chimney air velocity measurement point: P (1000, 500).
8.4 Results and Discussion
8.4.1 Variations of Temperature with Time
Measurement conditions for Fig. 8.3 were as follows: room-temperature and room-velocity were 285 K and 0.02 m/s, respectively, and initial air velocity inside the chimney was 0.28 m/s; we imposed a voltage of 80 V upon the heaters inside the closed space at 8:45 am and kept it constant. Supposing there was no energy lost from the periphery and bottom of the closed heating space, the heat flux from the bottom of the collector (two pieces of iron sheet) to the air was accordingly 213 W/m2.

Measurement conditions for Fig. 8.4 were as follows: room-temperature and room-velocity were 281 K and 0.02 m/s, respectively, and initial air velocity inside the chimney was 0.15 m/s; we imposed a voltage of 120 V at 9:20 am and kept it constant, the heat flux from the bottom of the collector to the air was accordingly 480 W/m2. The time interval for the measuring between Figs. 8.3 and 8.4 was 10 days, which was mainly for the purpose of avoiding the case that the former measurement had any influence on the latter measuring conditions and measurement results.

It can be obviously seen from Figs. 8.3 and 8.4 that the measurement results above indicate that the toggle speed of the system is quite fast. After heating for an hour, the maximum temperature increase for the chimney inlet air reaches 38 and 56 K, respectively, afterwards, the temperature increase for each measurement point is fairly gentle, and the system is basically under a steady state. Besides, through comparing Figs. 8.3 and 8.4, it also can be found that the effect of heat flux on the system temperature variation is very remarkable, the higher the heat flux, the more remarkable the temperature variation of each measurement point.
Measurement conditions for Fig. 8.6 were as follows: room temperature and velocity were 299 K and 0.08 m/s, respectively, and initial air velocity inside the chimney was 0.08 m/s; we imposed a voltage variation from 6:30 am till 6:30 pm to simulate the solar radiation which met the sine rule: the voltage imposed and the resulted heat flux from the bottom of the collector to the air are shown in Fig. 8.5.

Obviously shown in Fig. 8.6, the temperature variations of measurement points inside the system meet the sine variation rule. The maximum temperature increase reaches 43 K. And the largest heat flux occurs at 12:00, while the time corresponding to the maximum temperature increase occurs at 12:30. This indicates that the system has a lag effect with fairly short time, which shows that the existence of the closed space with heaters inside in the system has the characteristic of heat inertia. If a heat storage layer made of soil or gravel is used to take the place of the closed space in a commercial SC system, the characteristic of heat inertia of this kind of system will be quite notable.

8.4.2 Variations of Air Temperature and Velocity in the Chimney
Figs. 8.7 and 8.8 show the inner-chimney air temperature and velocity variations with time, respectively. Transparently, when the heat flux is 213 W/m2, the maximum velocity within the chimney is only about 1.7 m/s; while the maximum velocity within the chimney is 2.9 m/s when the heat flux is 480 W/m2. Experimental results indicate that under stable heat flux, the temperature increase and velocity within the chimney measured in winter are correspondingly larger than that measured in summer, and the experimental results agree well with the theoretical analysis results [16].


As shown in Fig. 8.9, when the heat flux at the bottom of the collector varies according to the sine rule, the temperature increase and velocity also varies according to the sine rule. And the air velocity within the chimney also reaches its maximum of 2.0 m/s at 12:30. Obviously, if a high heat flux is provided for a relatively long period (heating time is longer than 2 h with the heat flux larger than 500 W/m2 before peak value is reached), and this velocity is far smaller than that in winter, the difference mainly lies in that when the temperature increase is identical and air is heated under a relatively high ambient temperature, the air density variation and the system buoyancy produced are relatively small, thus causing a relatively small air velocity. Therefore, under the same heating conditions, operation performance of the SC system in winter is better than that in summer.

8.4.3 Temperature Distributions of the System
It can be seen from Figs. 8.10 and 8.11 that the air temperature gradually decreases along the air flow direction within the chimney. Taking the thinness of chimney wall into account, the inner-outer temperature difference of the chimney and the heat loss through the wall are relatively large, hence the temperature variation within the whole chimney is quite remarkable and should not be considered as adiabatic, which differs from the theoretical analysis for a commercial SC power plant [14]. The main reason for this is that the theoretical analysis results are based upon the fact that the actual thickness of the chimney is relatively large, that is, thicker than 1 m, and the chimney is made of reinforced concrete, which guarantees larger heat resistance and smaller heat loss. However, the chimney of the experimental setup in this paper differs greatly from the chimney of large-scale SC system, and as a result, analysis should be carried out according to the practical condition.
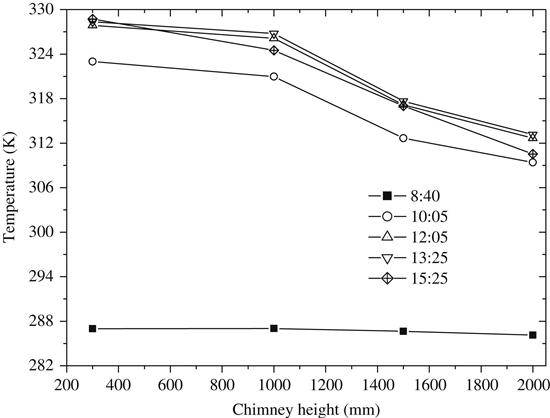

Furthermore, the experimental results also indicate that the temperature of the air flowing from the collector inlet to the bottom of the chimney is increasing all the time, the closer to the interior of the collector, the higher the measurement point’s temperature.
8.5 Conclusions
Experimental research for a mini-scale SC prototype was carried out, and under the conditions of both constant heat flux and heat flux varying according to the sine rule, the air temperature variations within the collector, air temperature, and velocity variations within the chimney were all measured. Experimental results indicate:
1. The air temperature increase and velocity within the chimney in winter are both larger than that in summer, which agrees well with the theoretical analysis results.
2. Temperature from the inlet of the collector to its center gradually increases, which agrees with the theoretical analysis. However, the temperature varies remarkably along the air flow direction within the chimney, thus the airflow within the chimney should not be regarded as an adiabatic process, which is quite different from that of a large-scale SC system, and this is mainly caused by the thinness of the chimney wall, which means small heat resistance and considerable heat loss.