Chapter 11. Monitoring a SharePoint 2013 Environment
In This Chapter
![]() Using the SharePoint Health Analyzer
Using the SharePoint Health Analyzer
![]() Using SharePoint Native Reporting Capabilities
Using SharePoint Native Reporting Capabilities
![]() Understanding Timer Jobs for SharePoint 2013
Understanding Timer Jobs for SharePoint 2013
![]() Using System Center Operations Manager to Simplify Management of SharePoint 2013
Using System Center Operations Manager to Simplify Management of SharePoint 2013
![]() Establishing Maintenance Schedules for SharePoint
Establishing Maintenance Schedules for SharePoint
A SharePoint farm is complex, with many moving parts contributing to the functionality of the entire platform. Therefore, the farm components need to be well maintained and monitored on a regular basis to ensure the smooth functioning of the environment. Of particular emphasis are the SQL databases that SharePoint runs on, which are often neglected but require regular maintenance and monitoring.
Fortunately for the SharePoint administrator, Microsoft has revamped SharePoint 2013 to include robust monitoring capabilities and features, including an optimized Health Monitor that automatically determines whether issues exist that affect SharePoint health. The SharePoint team has also built in advanced reporting capabilities natively in SharePoint and improved timer jobs.
In addition to the internal tools, outside of SharePoint, applications such as Microsoft’s System Center Operations Manager (SCOM) 2012 provide for SharePoint-aware management capabilities that exceed those of the internal tools.
This chapter focuses on the specifics for monitoring and maintaining SharePoint, including an analysis of the native tools, the SharePoint Health Analyzer, and a discussion of System Center Operations Manager 2012 monitoring for a SharePoint 2013 environment. In addition, practical guidance for daily, weekly, monthly, quarterly, and yearly maintenance is provided.
Using the SharePoint Health Analyzer
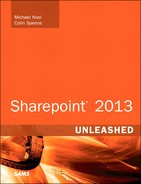
Earlier versions of SharePoint did not include many integrated tools to help with monitoring the health of the SharePoint environment. SharePoint 2013 was built with a native SharePoint Health Analyzer, shown in Figure 11.1, which greatly improves the ability of SharePoint administrators to quickly detect issues within the farm.
Reviewing SharePoint Health Analyzer Settings
The SharePoint Health Analyzer is essentially a SharePoint list, as shown in Figure 11.2, that is driven by timer jobs that run on a regular basis. The list settings are Extensible Markup Language (XML) driven and can be configured to automatically resolve SharePoint health issues in certain cases.

In a default installation, there are more than 60 preconfigured rule definitions, in 4 different categories: Availability, Configuration, Performance, and Security. Each list item is configured to be checked on a regular basis. The following is a list of some of the default rules created in SharePoint 2013:
Accounts used by application pools or service identities are in the local machine Administrators group.
Business Data Connectivity connectors are currently enabled in a partitioned environment.
Web applications using claims authentication require an update.
The server farm account should not be used for other services.
The Unattended Service Account application ID is not specified or has an invalid value.
Application pools recycle when memory limits are exceeded.
Databases used by SharePoint have fragmented indices.
Databases exist on servers running SharePoint Foundation.
The paging file size should exceed the amount of physical memory in the system.
Databases used by SharePoint have outdated index statistics.
The timer service failed to recycle.
The Visio Graphics Service has a maximum cache age setting that adversely impacts performance.
The Visio Graphics Service has a maximum web drawing size setting that adversely impacts performance.
The Visio Graphics Service has a maximum recalculation setting that adversely impacts performance.
The Visio Graphics Service has a minimum cache age setting that adversely impacts performance.
The Visio Graphics Service has a minimum cache age setting that might cause a security issue.
The Visio Graphics Service has a maximum cache size setting that might adversely impact performance.
Alternate access URLs have not been configured.
The Application Discovery and Load Balancer Service is not running in this farm.
Automatic Update setting is inconsistent across farm servers.
Built-in accounts are used as application pool or service identities.
Missing server-side dependencies.
Databases require upgrade or are not supported.
Databases running in compatibility range, upgrade recommended.
Outbound email has not been configured.
Product/patch installation or server upgrade required.
Databases within this farm are set to read-only and fail to upgrade unless it is set to a read-write state.
Web.config file has incorrect settings for the requestFiltering element.
The number of distributed cache hosts in the farm exceeds the recommended value.
This distributed cache host might cause cache reliability problems.
Firewall client settings on the cache host are incorrect.
More cache hosts are running in this deployment than are registered with SharePoint.
Distributed cache service is not enabled in this deployment.
Web.config files are not identical on all machines in the farm.
One or more web applications are configured to use Windows classic authentication.
Dedicated crawl target configuration has one or more invalid servers.
The InfoPath Forms Services Maintenance timer job is not enabled.
InfoPath form library forms cannot be filled out in a web browser.
InfoPath Forms Services forms cannot be filled out in a web browser because no State Service connection is configured.
Expired sessions are not being deleted from the ASP.NET session state database.
The State Service Delete Expired Sessions timer job is not enabled.
Verify each User Profile Service application has an associated Managed Metadata Service connection.
Verify each User Profile Service application has an associated Search service connection.
Verify each User Profile Service application has a My Site host configured.
Verify that the critical User Profile Application and User Profile Proxy Application timer jobs are available and have not been mistakenly deleted.
Validate the My Site host and individual My Sites are on a dedicated web application and separate URL domain.
Verify that the Activity Feed timer job is enabled.
People search relevance is not optimized when the Active Directory has errors in the manager reporting structure.
The settings for the Machine Translation Service are not within the recommended limits.
Verify that OAuth is configured correctly for the Machine Translation Service application proxy.
Verify that OAuth is configured correctly for the Machine Translation Service application.
Immediate translations for the Machine Translation Service are disabled.
The Machine Translation Service is not running when it should be running.
XLIFF translation for the Machine Translation Service is disabled.
Content databases contain orphaned apps.
Drives are running out of free space.
Drives are at risk of running out of free space.
Content databases contain orphaned items.
Some content databases are growing too large.
Database has large amounts of unused space.
The Security Token Service is not available.
One or more servers are not responding.
One or more services have started or stopped unexpectedly.
One of the cache hosts in the cluster is down.
Cached objects have been evicted.
The current server is running low on memory.
Drives used for SQL databases are running out of free space.
All State Service databases are paused for a State Service application.
A State Service application has no database defined.
The settings for Word Automation Services are not within the recommended limits.
Critical state of this rule indicates that the Word Automation Services is not running when it should be running.
Modifying Health Analyzer Job Definitions
You can modify the default SharePoint Health Analyzer rules directly from within Central Admin or from PowerShell. In addition, the rules can be easily extended by third-party tools or add-ons to SharePoint. Developers or administrators can also write their own custom rules to look for specific criteria.
Custom rules can be created through creation of code that uses either the SPHealthAnalysisRule or SPRepairableHealthAnalysisRule classes. Rules are compiled and registered with the Health Analyzer and, when created, are allocated an associated timer job created to run the rule.
For SharePoint administrators, the default content rules can be modified to change how often they run and whether the rule will attempt to automatically fix the problem associated with the rule. Clicking the rule and then clicking Edit Item pulls up a dialog box similar to the one shown in Figure 11.3, which enables for customization of the rule.

Using SharePoint Native Reporting Capabilities
Out-of-the-box, SharePoint 2013 gives administrators access to a default set of reports that can analyze traffic patterns or perform diagnostics on an environment.
The default set of reports can also be extended by third-party utilities or with custom-created reports. In addition, SharePoint administrators can customize individual reports to fit their own specific needs.
Note
SharePoint reporting can be further extended using SQL Server Reporting Services running in SharePoint integration mode.
Optimizing Usage Data Collection Log Settings
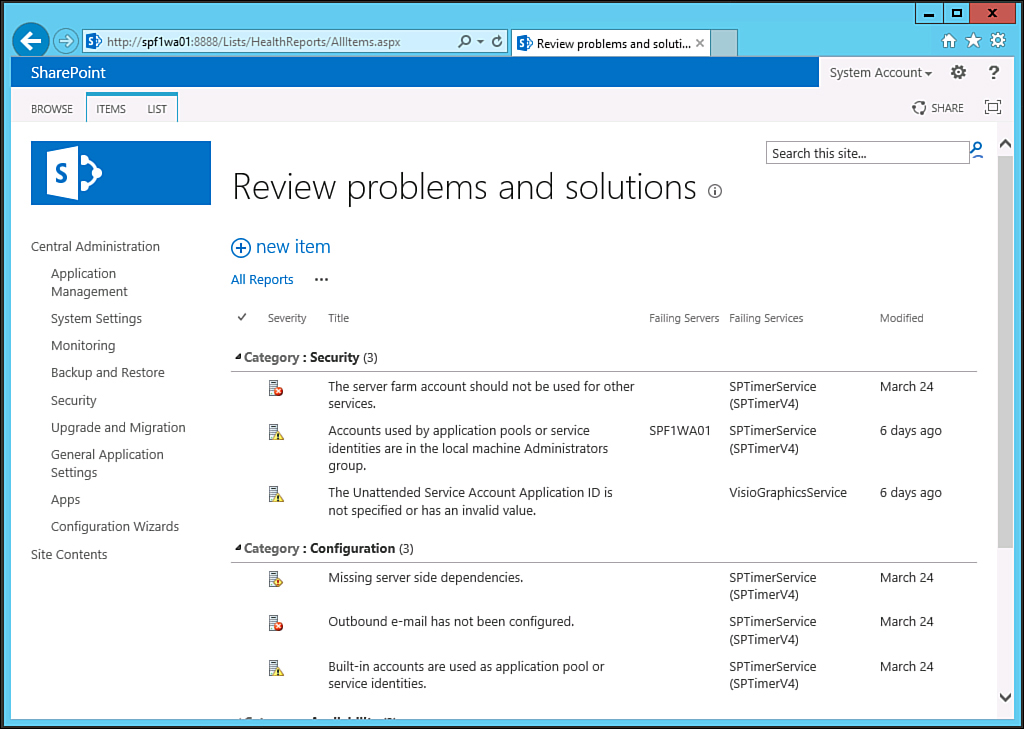
By default, usage data collection logs, which are used to analyze traffic patterns on SharePoint sites, are stored on the default system volume with the rest of the SharePoint data. Because these files can grow quite large, you should move them to their own volume or limit their growth. To modify these settings for the farm, click the Configure Usage and Health Data Collection link under the Monitoring section of SharePoint Central Admin, and modify the settings, as shown in Figure 11.4.
The location for the usage collection logs must exist on all SharePoint servers in the farm. This note applies to any other log location setting defined, because these settings apply to every server within the farm.
Modifying Diagnostic Log Settings
You can use diagnostic logs to determine whether issues exist with individual services in SharePoint 2013. You can turn on (or off) logging for individual services in the Diagnostic Logging dialog box, as shown in Figure 11.5.

Other settings for diagnostic logs, including which drive the trace files are stored on and how large they can grow, can be modified from this same page, as shown in Figure 11.6. It is highly recommended to control the growth of trace files because they can grow large very quickly. In general, enable only those diagnostic files that you need to avoid growing out of control. It is good practice to change the location to which they are written to something other than the system drive where SharePoint is installed.

Understanding Timer Jobs for SharePoint 2013
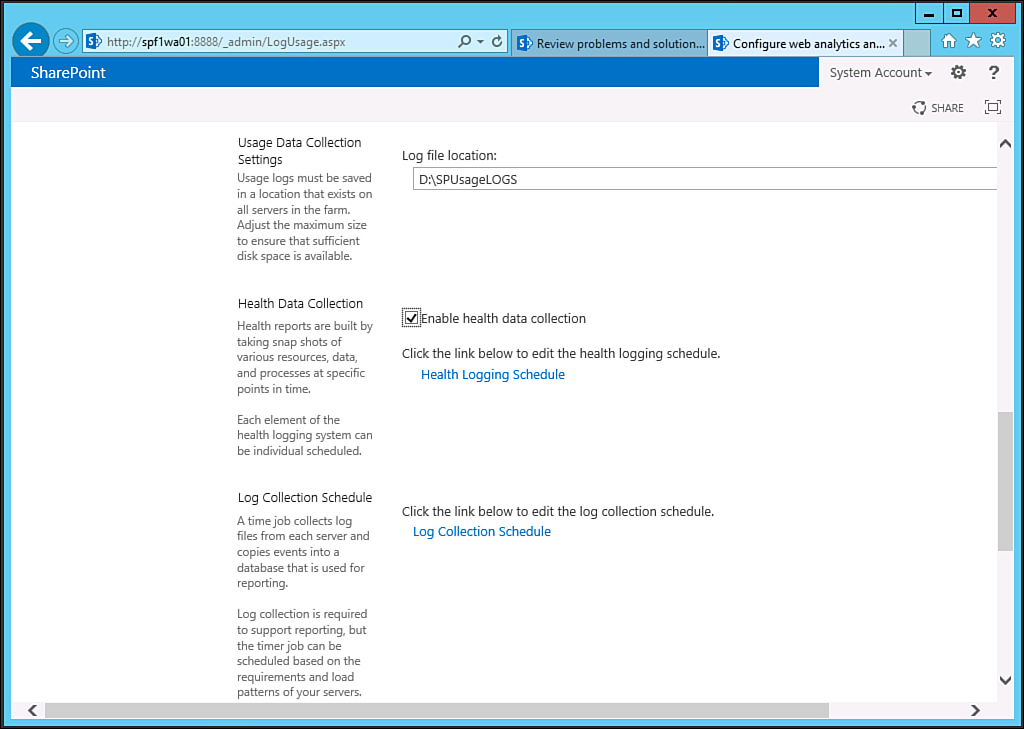
Timer jobs, as shown in Figure 11.7, are critical components in SharePoint jobs. They are used to fire off tasks on a scheduled basis and are critical to the smooth operation of a farm. It is critical to understand which timer jobs are configured and how to modify them to understand how to administer a SharePoint environment.
Modifying Timer Jobs
The schedule for individual timer jobs can be modified by clicking the name of the timer job from within the Timer Job page, located within the Monitoring area of SharePoint Central Admin. Jobs can be modified to occur as often as every minute or as seldom as monthly, as shown in Figure 11.8. In addition, you can kick off individual timer jobs by clicking the Run Now button.

Monitoring Timer Jobs
The status for any one timer job can also be easily monitored, this time by clicking the Timer Job Status link within the Monitoring page of SharePoint Central Admin (see Figure 11.9). The job schedule is shown at the top of the page, and job status is shown at the bottom.
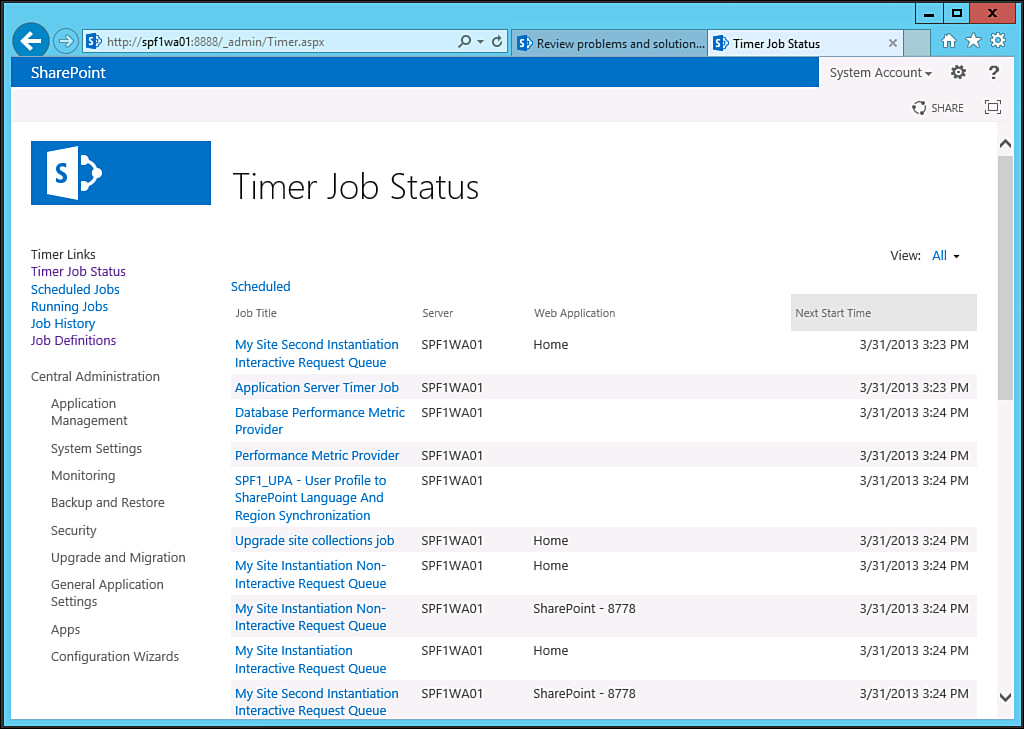
In addition to the SharePoint Central Admin tool, you can use the PowerShell scripting interface to administer timer jobs. Enter Get-Command *SPTimerJob from PowerShell to get a list of commands that you can use to administer timer jobs from the command line.
Using System Center Operations Manager to Simplify Management of SharePoint 2013
SCOM is an enterprise-class monitoring and management solution for Windows environments. It is designed to simplify SharePoint server management by consolidating events, performance data, alerts, and more into a centralized repository. Reports on this information can then be tailored depending on the environment and the level of detail needed and extrapolated. This information can assist administrators and decision makers in proactively addressing SharePoint server operation and any problems that exist or may occur.
The latest version of SCOM, System Center Operations Manager 2012, can be further extended through the addition of management packs for SharePoint Foundation and SharePoint Server, which contain built-in event and performance analysis tools specifically written to ensure smooth functionality of a SharePoint environment. Deployment of a SCOM solution in a SharePoint environment would not be complete without installation of this tool.
Many other intrinsic benefits are gained by using SCOM, including the following:
![]() Event log monitoring and consolidation
Event log monitoring and consolidation
![]() Monitoring of various applications, including those provided by third parties
Monitoring of various applications, including those provided by third parties
![]() Enhanced alerting capabilities
Enhanced alerting capabilities
![]() Assistance with capacity-planning efforts
Assistance with capacity-planning efforts
![]() A customizable knowledge base of Microsoft product knowledge and best practices
A customizable knowledge base of Microsoft product knowledge and best practices
![]() Web-based interface for reporting and monitoring
Web-based interface for reporting and monitoring
Taking a Closer Look at System Center Operations Manager
SCOM 2012 is the latest version of Microsoft’s enterprise monitoring product. Previously owned by NetIQ and then sold to Microsoft, the product has evolved from a product known as Microsoft Operations Manager (MOM) to the latest generation.
SCOM provides for several major pieces of functionality, as follows:
![]() Event log consolidation: SCOM agents, deployed on managed systems, forward all event log information to a central SCOM SQL Server database, which is managed and groomed by SCOM. This data is used for reporting, auditing, and monitoring the specific events.
Event log consolidation: SCOM agents, deployed on managed systems, forward all event log information to a central SCOM SQL Server database, which is managed and groomed by SCOM. This data is used for reporting, auditing, and monitoring the specific events.
![]() Advanced alerting capabilities: SCOM provides advanced alerting functionality by enabling email alerts, paging, and functional alerting roles to be defined.
Advanced alerting capabilities: SCOM provides advanced alerting functionality by enabling email alerts, paging, and functional alerting roles to be defined.
![]() Performance monitoring: SCOM collects performance statistics that can let an administrator know whether a server is being overloaded or is close to running out of disk space, among other things.
Performance monitoring: SCOM collects performance statistics that can let an administrator know whether a server is being overloaded or is close to running out of disk space, among other things.
![]() Built-in application-specific intelligence: SCOM management packs are packages of information about a particular application or service, such as domain name server (DNS), Dynamic Host Configuration Protocol (DHCP), Exchange Server, or SharePoint Server. The Microsoft management packs are written by the design teams for each individual product and are loaded with the intelligence and information necessary to properly troubleshoot and identify problems. For example, the SharePoint management pack automatically knows which event IDs indicate configuration errors in the software and specifically directs an administrator to the proper location on the Web where Microsoft Knowledge Base articles can be used for troubleshooting.
Built-in application-specific intelligence: SCOM management packs are packages of information about a particular application or service, such as domain name server (DNS), Dynamic Host Configuration Protocol (DHCP), Exchange Server, or SharePoint Server. The Microsoft management packs are written by the design teams for each individual product and are loaded with the intelligence and information necessary to properly troubleshoot and identify problems. For example, the SharePoint management pack automatically knows which event IDs indicate configuration errors in the software and specifically directs an administrator to the proper location on the Web where Microsoft Knowledge Base articles can be used for troubleshooting.
SCOM architecture can be complex, but often it is as simple as an SQL database running on a server, with another server providing the management server functions of SCOM. This type of server is also known as an SCOM management server.
Installing SCOM Management Packs for SharePoint 2013
As previously mentioned, management packs contain intelligence about specific applications and services and include troubleshooting information specific to those services. Microsoft has released two management packs for SharePoint 2013. The first is the management pack for SharePoint Foundation 2013; the second is for the full SharePoint 2013 suite. It is recommended to deploy those management packs that are used within your environment.
To download these management packs, go to http://pinpoint.microsoft.com and search for “SharePoint 2013 management pack.” Within the Search results, you should see the following available for download:
![]() System Center Monitoring Pack for SharePoint Server 2013
System Center Monitoring Pack for SharePoint Server 2013
![]() System Center Monitoring Pack for SharePoint Foundation 2013
System Center Monitoring Pack for SharePoint Foundation 2013
Install and import each management pack individually into SCOM 2012 via the Import/Export Management Packs link to enable them in the environment. When installed, they intelligently sense which servers are SharePoint servers and deploy scripts and event viewer monitors to those systems.
Installing Additional Management Packs for SharePoint Farms
In addition to the SharePoint 2013-specific management packs, a SharePoint environment should leverage additional management packs installed on SCOM to monitor the other non-SharePoint components:
![]() Microsoft SQL Server Management Pack for Operations Manager 2012
Microsoft SQL Server Management Pack for Operations Manager 2012
![]() Windows Server Internet Information Services (IIS) for System Center Operations Manager 2012
Windows Server Internet Information Services (IIS) for System Center Operations Manager 2012
![]() Windows Server Operating System (OS) Management Pack for Operations Manager 2012
Windows Server Operating System (OS) Management Pack for Operations Manager 2012
![]() Active Directory Management Pack for System Center Operations Manager 2012 (for the domain controllers)
Active Directory Management Pack for System Center Operations Manager 2012 (for the domain controllers)
Review the list of components used within the SharePoint environment and compare that list with the list of management packs provided. This might mean that additional management packs are needed. For example, if Forefront Threat Management Gateway or Forefront Unified Access Gateway are used to secure inbound Hypertext Transport Protocol Secure (HTTPS) access to SharePoint, those management packs may be required.
Monitoring SharePoint Functionality and Performance with SCOM
After the management pack is installed for SharePoint and the agent has been installed and is communicating, SCOM consolidates and reacts to every event and performance counter sent to it from the SharePoint server. This information is reflected in the SCOM operations console.
Performance data for SharePoint can also be displayed in SCOM. This enables reports and performance metrics to be obtained from the farm. For more information on SCOM 2012, refer to www.microsoft.com/SystemCenter.
Establishing Maintenance Schedules for SharePoint
Maintaining a SharePoint farm is not an easy task for administrators. They must find time in their firefighting efforts to focus and plan for maintenance on the server systems. When maintenance tasks are common in an environment, they can alleviate many of the common firefighting tasks.
The processes and procedures for maintaining Windows Server systems can be separated based on the appropriate time to maintain a particular aspect of SharePoint. Some maintenance procedures require daily attention, whereas others may require only yearly checkups. The maintenance processes and procedures that an organization follows depend strictly on the organization; however, the categories described in the following sections and their corresponding procedures are best practices for organizations of all sizes and varying IT infrastructures.
Outlining Daily Maintenance Tasks
Certain maintenance procedures require more attention than others. The procedures that require the most attention are categorized as daily procedures. A SharePoint administrator should review these procedures each day to ensure system reliability, availability, performance, and security. These procedures are examined in the following three sections.
Checking Overall SharePoint Server Functionality
Although checking the overall server health and functionality may seem redundant or elementary, this procedure is critical to keeping the system environment and users working productively.
Questions that should be addressed during the checking and verification process include the following:
![]() Can users access data in SharePoint document libraries?
Can users access data in SharePoint document libraries?
![]() Can remote users access SharePoint via Secure Sockets Layer (SSL) if configured?
Can remote users access SharePoint via Secure Sockets Layer (SSL) if configured?
![]() Is there an exceptionally long wait to access the portal (that is, longer than normal)?
Is there an exceptionally long wait to access the portal (that is, longer than normal)?
![]() Do Simple Mail Transfer Protocol (SMTP) alerts function properly?
Do Simple Mail Transfer Protocol (SMTP) alerts function properly?
![]() Are searches properly locating newly created or modified content?
Are searches properly locating newly created or modified content?
Verifying That Backups Are Successful
To provide a secure and fault-tolerant organization, it is imperative that a successful backup be performed every night. If a server failure occurs, the administrator may be required to perform a restore from tape. Without a backup each night, the IT organization is forced to rely on rebuilding the SharePoint server without the data. Therefore, the administrator should always back up servers so that the IT organization can restore them with minimum downtime if a disaster occurs. Because of the importance of the tape backups, the first priority of the administrator each day needs to be verifying and maintaining the backup sets.
If disaster ever strikes, the administrators want to be confident that a system or entire farm can be recovered as quickly as possible. Successful backup mechanisms are imperative to the recovery operation; recoveries are only as good as the most recent backups.
Although Windows Server’s or SharePoint’s backup programs do not offer alerting mechanisms for bringing attention to unsuccessful backups, many third-party programs do. In addition, many of these third-party backup programs can send emails or pages if backups are successful or unsuccessful. For more information on backing up and restoring SharePoint, see Chapter 10, “Backing Up and Restoring a SharePoint Environment.”
Monitoring the Event Viewer
The Windows Event Viewer is used to check the system, security, application, and other logs on a local or remote system. These logs are an invaluable source of information regarding the system. The following event logs are present for SharePoint servers running on Windows Server:
![]() Security: Captures all security-related events being audited on a system. Auditing is turned on by default to record success and failure of security events.
Security: Captures all security-related events being audited on a system. Auditing is turned on by default to record success and failure of security events.
![]() Application: Stores specific application information. This information includes services and any applications running on the server.
Application: Stores specific application information. This information includes services and any applications running on the server.
![]() System: Stores Windows Server-specific information.
System: Stores Windows Server-specific information.
All Event Viewer events are categorized as informational, warning, or error.
Note
Checking these logs often helps to understand them. Some events constantly appear but aren’t significant. Events will begin to look familiar, so it will be noticeable when something is new or amiss in event logs. It is for this reason that an intelligent log filter such as SCOM 2012 is a welcome addition to a SharePoint environment.
Best practices for monitoring event logs include the following:
![]() Understand the events being reported.
Understand the events being reported.
![]() Set up a database for archived event logs.
Set up a database for archived event logs.
![]() Use an automatic log parsing and alerting tool, such as SCOM.
Use an automatic log parsing and alerting tool, such as SCOM.
To simplify monitoring hundreds or thousands of generated events each day, the administrator should use the filtering mechanism provided in the Event Viewer. Although warnings and errors should take priority, the informational events should be reviewed to track what was happening before the problem occurred. After the administrator reviews the informational events, he/she can filter out the informational events and view only the warnings and errors.
To filter events, follow these steps:
1. Start the Event Viewer by choosing Start, All Programs, Administrative Tools, Event Viewer.
2. Select the log from which you want to filter events.
3. Right-click the log and select Filter Current Log.
4. In the Filter Current Log window, select the types of events to filter.
5. (Optional) Select the time frame in which the events occurred, event source, category, event ID, or other options that will narrow down the search. Click OK when finished.
Some warnings and errors are normal because of bandwidth constraints or other environmental issues. The more logs are monitored, the more familiar an administrator should be with the messages and therefore will spot a problem before it affects the user community.
Note
You might need to increase the size of the log files in the Event Viewer to accommodate an increase in logging activity.
Performing Weekly SharePoint Maintenance
Maintenance procedures that require slightly less attention than daily checking are categorized in a weekly routine and are examined in the following sections.
Checking Disk Space
Disk space is a precious commodity. Although the disk capacity of a Windows Server system can seem virtually endless, the amount of free space on all drives should be checked daily. Serious problems can occur if there isn’t enough disk space.
One of the most common disk space problems occurs on database drives where all SQL SharePoint data is held. Other volumes such as the system drive and partitions with logging data can also quickly fill up.
As mentioned earlier, lack of free disk space can cause a multitude of problems, including the following:
![]() SharePoint application failures
SharePoint application failures
![]() System crashes
System crashes
![]() Unsuccessful backup jobs
Unsuccessful backup jobs
![]() Service failures
Service failures
![]() Inability to audit
Inability to audit
![]() Degradation of performance
Degradation of performance
To prevent these problems from occurring, administrators should keep the amount of free space to at least 25%.
Caution
If needing to free disk space, move or delete files and folders with caution. System files are automatically protected by Windows Server, but data files are not.
Verifying SharePoint Hardware Components
Hardware components supported by Windows Server are reliable, but this doesn’t mean that they’ll always run continuously without failure. Hardware availability is measured in terms of mean time between failures (MTBF) and mean time to repair (MTTR). This includes downtime for both planned and unplanned events. These measurements provided by the manufacturer are good guidelines to follow; however, mechanical parts are bound to fail at one time or another. As a result, hardware should be monitored weekly to ensure efficient operation.
Hardware can be monitored in many different ways. For example, server systems may have internal checks and logging functionality to warn against possible failure, Windows Server’s System Monitor might bring light to a hardware failure, and a physical hardware check can help to determine whether the system is about to experience a problem with the hardware.
If a failure occurs or is about to occur on a SharePoint server, having an inventory of spare hardware can significantly improve the chances and timing of recoverability. Checking system hardware on a weekly basis provides the opportunity to correct the issue before it becomes a problem.
Archiving Event Logs
The three event logs on all servers can be archived manually, or a script can be written to automate the task. You should archive the event logs to a central location for ease of management and retrieval.
The specific amount of time to keep archived log files varies on a per-organization basis. For example, banks or other high-security organizations might be required to keep event logs up to a few years. As a best practice, organizations should keep event logs for at least three months.
Tip
Organizations that deploy SCOM with SharePoint can take advantage of SCOM’s capability to automatically archive event log information, providing for a significant improvement to monitoring and reporting of SharePoint.
Performing Monthly Maintenance Tasks
When you determine the maintenance required for SharePoint, it is vital to formalize the procedures into documented steps. A maintenance plan can contain information on what tasks to perform at different intervals. You should perform the tasks examined in the following sections on a monthly basis.
Maintaining File System Integrity
CHKDSK scans for file system integrity and can check for lost clusters, cross-linked files, and more. If Windows Server senses a problem, it runs CHKDSK automatically at startup.
Administrators can maintain FAT, FAT32, and NTFS file system integrity by running CHKDSK once a month. To run CHKDSK, follow these steps:
1. At the command prompt, change to the partition that you want to check.
2. Type CHKDSK without any parameters to check only for file system errors.
3. If any errors are found, run the CHKDSK utility with the /f parameter to attempt to correct the errors found.
Testing the UPS Battery
You can use an uninterruptible power supply (UPS) to protect the system or group of systems from power failures (such as spikes and surges) and keep the system running long enough after a power outage so that an administrator can gracefully shut down the system. A SharePoint administrator should follow the UPS guidelines provided by the manufacturer at least once a month. Also, monthly scheduled battery tests should be performed.
Validating Backups
Once a month, an administrator should validate backups by restoring the backups to a server located in a lab environment. This is in addition to verifying that backups were successful from log files or the backup program’s management interface. A restore enables the administrator to verify the backups and to practice the restore procedures that would be used when recovering the server during a disaster. In addition, this procedure tests the state of the backup media to ensure that it is in working order and builds administrator confidence for recovering from a true disaster.
Updating Documentation
An integral part of managing and maintaining any IT environment is to document the network infrastructure and procedures. The following are just a few of the documents you should consider having on hand:
![]() SharePoint Server build guides
SharePoint Server build guides
![]() Disaster recovery guides and procedures
Disaster recovery guides and procedures
![]() Maintenance checklists
Maintenance checklists
![]() Configuration settings
Configuration settings
![]() Change control logs
Change control logs
![]() Historical performance data
Historical performance data
![]() Special user rights assignments
Special user rights assignments
![]() SharePoint site configuration settings
SharePoint site configuration settings
![]() Special application settings
Special application settings
As systems and services are built and procedures are decided upon, document these facts to reduce learning curves, administration, and maintenance.
It is not only important to adequately document the IT environment, but it’s also often even more important to keep those documents up-to-date. Otherwise, documents can quickly become outdated as the environment, processes, and procedures change as the business changes.
Performing Quarterly Maintenance Tasks
As the term implies, quarterly maintenance is performed four times a year. Areas to maintain and manage on a quarterly basis are usually self-sufficient and self-sustaining. Infrequent maintenance is required to keep the system healthy. This doesn’t mean, however, that the tasks are simple or that they aren’t as critical as those tasks that require more frequent maintenance.
Checking Storage Limits
Storage capacity on all volumes should be checked to ensure that all volumes have ample free space. Keep approximately 25% free space on all volumes.
Running low or completely out of disk space creates unnecessary risk for any system. Services can fail, applications can stop responding, and systems can even crash if there isn’t plenty of disk space.
Keeping SQL database disk space consumption to a minimum can be accomplished through a combination of limiting document library versioning or implementing site quotas.
Changing Administrator Passwords
Administrator passwords should, at a minimum, be changed every quarter (90 days). Changing these passwords strengthens security measures so that systems can’t easily be compromised. In addition to changing passwords, other password requirements such as password age, history, length, and strength should be reviewed.
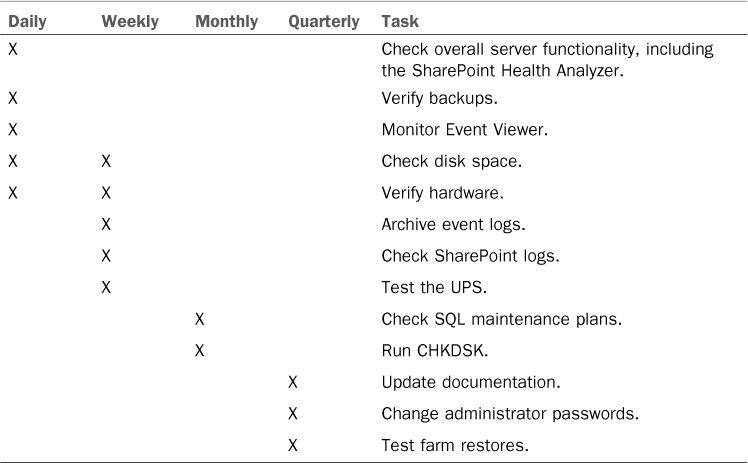
Summary of Maintenance Tasks and Recommendations
Table 11.1 summarizes some of the maintenance tasks and recommendations examined in this chapter.
Summary
Although SharePoint administrators can easily get caught up in daily administration and firefighting, it’s important to structure system management and maintenance to help prevent unnecessary amounts of effort. Following a management and maintenance regimen reduces administration, maintenance, and business expenses, while at the same time increasing reliability, stability, and security.
SharePoint 2013 includes built-in monitoring capabilities using tools such as the SharePoint Health Analyzer, enhanced timer job capabilities, and enhanced logging that can help SharePoint administrators have better control over their SharePoint environment. Combined with an enterprise tool, such as System Center Operations Manager, and together with a comprehensive maintenance schedule composed of daily, weekly, monthly, and quarterly tasks, a SharePoint 2013 farm can be properly monitored and controlled.
Best Practices
The following are best practices from this chapter:
![]() Use the SharePoint Health Analyzer to proactively identify health issues in a SharePoint 2013 farm.
Use the SharePoint Health Analyzer to proactively identify health issues in a SharePoint 2013 farm.
![]() Understand how to modify timer job schedules and to run timer jobs manually.
Understand how to modify timer job schedules and to run timer jobs manually.
![]() Move the trace and usage logs to a dedicated drive that exists on all SharePoint farm members.
Move the trace and usage logs to a dedicated drive that exists on all SharePoint farm members.
![]() Use SCOM 2012 to proactively manage SharePoint Server 2007 systems.
Use SCOM 2012 to proactively manage SharePoint Server 2007 systems.
![]() Download all relevant SCOM management packs, including SQL, IIS, and Windows OS management packs, in addition to the two SharePoint 2013-specific ones.
Download all relevant SCOM management packs, including SQL, IIS, and Windows OS management packs, in addition to the two SharePoint 2013-specific ones.
![]() Identify tasks important to the system’s overall health and security.
Identify tasks important to the system’s overall health and security.
![]() Thoroughly test and evaluate service packs and updates in a lab environment before installing them on production servers and client machines.
Thoroughly test and evaluate service packs and updates in a lab environment before installing them on production servers and client machines.
![]() Install the appropriate service packs and updates on each production SharePoint server and client machine to keep all systems consistent.
Install the appropriate service packs and updates on each production SharePoint server and client machine to keep all systems consistent.
![]() Categorize and document daily, weekly, monthly, and quarterly tasks required to monitor SharePoint farm servers.
Categorize and document daily, weekly, monthly, and quarterly tasks required to monitor SharePoint farm servers.