Chapter 26. Extending SharePoint 2013 with Excel Services, Visio Graphics Services, and Access Services
In This Chapter
![]() Working with Excel Data in SharePoint 2013
Working with Excel Data in SharePoint 2013
![]() Getting to Know the Excel Services Service Application
Getting to Know the Excel Services Service Application
![]() Managing the Excel Service Application
Managing the Excel Service Application
![]() Allowing Parameter Input in Excel Web Access
Allowing Parameter Input in Excel Web Access
![]() Visio Graphics Service Overview
Visio Graphics Service Overview
The service applications covered in this chapter are available only in the SharePoint Server 2013 Enterprise Edition, but provide a variety of tools and capabilities that may be of interest to organizations that are already familiar with the SharePoint “basics” and want to understand some more advanced tools in the product line.
The capabilities of Excel Services are covered in the most depth, due largely to its popularity and the proliferation of Excel spreadsheets in almost every type of organization. Visio Graphics Services and Access Services are more specialized and appeal to a smaller subset of users and organizations.
All these service applications can be leveraged by developers within the organization to create sophisticated applications, and this chapter touches on some of those capabilities from a high level.
Note that this chapter focuses on the Microsoft Office 2013 products, including Excel 2013, Access 2013, and Visio 2013, but not earlier versions. Therefore, if organizations have earlier versions of these Office products, they should test the capabilities of these products with SharePoint 2013 to ensure that they function properly.
Working with Excel Data in SharePoint 2013
Integration between Excel spreadsheets and SharePoint has been a hot topic for years, and Microsoft has provided a number of methods to integrate the two products. This section reviews some basic methods of working with Excel data in SharePoint from a high level to provide some background on different ways Excel data can be integrated with the SharePoint 2013 environment and to prepare for additional discussions around Excel Services.
To begin with, users can simply upload Excel spreadsheets to SharePoint libraries (without using the Excel Services publishing process described later in this chapter). Users gain the many benefits and tools provided by the document library, but are still working with the same Excel spreadsheets. These spreadsheets are still highly portable, difficult to manage when they leave the SharePoint library. Many organizations want to better manage the data contained in the spreadsheets and control the proliferation of versions of the spreadsheet.
A SharePoint list has many similarities with an Excel spreadsheet. Both allow the creators of the documents to define the columns that are part of the entity, define what type of content is stored in each column (text, currency, date/time, numeric, and so on), and control the format of the data. Excel provides many more tools to format the data than SharePoint does, but SharePoint lists still provide an excellent alternative to “emailing spreadsheets to the whole company” by centralizing the data in a secure location, allowing multiple users to edit the list at the same time, tracking versions of row data, and providing features such as alerts, workflows, custom views, and many other features. There are many more differences between a SharePoint list and an Excel spreadsheet that are not detailed here, but through some trial and error an organization can quickly learn where a SharePoint list is better suited to their requirements and where an Excel spreadsheet still needs to be used.
SharePoint also offers an Import Spreadsheet list template, which pulls in select data from a spreadsheet and creates a SharePoint list based on that data. The administrator or power user simply chooses the Import Spreadsheet list template (also called an app in SharePoint 2013 parlance), then specifies the spreadsheet to import, and then selects the range of cells. SharePoint then creates a list and does its best to choose column types to match the columns in the spreadsheet. Although not always perfect (the administrator or power user should verify the column settings to make sure that they do in fact match the type of content in the columns), this is a quick way to pull Excel content into SharePoint and then allow users to collaborate on the data.
When the Import Spreadsheet list template is used, no connectivity exists between the SharePoint list and the source spreadsheet. Therefore, if the source data changes, there is no effect on the SharePoint list, and likewise if the SharePoint list data changes, there is no impact on the source spreadsheet. In some cases, this is perfectly acceptable, but in others the users or administrators want to preserve connectivity between the source and the “clone.”
SharePoint lists allow users to export content out to Excel using the Export to Excel tool on the List tab of the ribbon. This process is “sticky” because a connection is established between the SharePoint list and Excel 2013, but it is a one-way connection. The content in the spreadsheet can be updated by clicking Refresh All on the Design tab, and any changes in the SharePoint list are synced to the local copy of the spreadsheet.
Each of these processes has pros and cons, and the administrator or power users involved with managing and migrating content to SharePoint 2013 should be familiar with the different processes and the capabilities of Excel Services, as covered in the sections to follow in this chapter.
Getting to Know the Excel Services Service Application
From a high level, Excel Services is a service application in SharePoint 2013 Enterprise that provides a number of powerful tools used for “business intelligence (BI)” applications in the enterprise. It is designed for sharing, securing, managing, and using Excel 2013 workbooks in a browser to enable the organization to better manage key data and better leverage this data. Real-world experience has shown that many organizations can realize benefits on a less grandiose scale, and all levels of employees and knowledge workers can—and do—benefit from Excel Services in many other ways.
Fundamentally, Excel Services provides the following capabilities:
![]() Sharing workbooks
Sharing workbooks
![]() Building BI dashboards
Building BI dashboards
![]() Reuse of logic encapsulated in Excel workbooks in custom applications
Reuse of logic encapsulated in Excel workbooks in custom applications
![]() Report building
Report building
From a functional standpoint, Excel Services consists of three main components:
![]() Excel Calculation Services: A service that can be enabled on one or more SharePoint 2013 Enterprise servers
Excel Calculation Services: A service that can be enabled on one or more SharePoint 2013 Enterprise servers
![]() The Excel Web Access Web Part: A web part that can be added to SharePoint web pages
The Excel Web Access Web Part: A web part that can be added to SharePoint web pages
![]() Excel Services Application: A service application that is managed through Central Administration
Excel Services Application: A service application that is managed through Central Administration
These components are discussed in more detail later in the chapter.
A primary capability is that Excel Services enables users to “publish” Excel workbooks to a document library. This is not meant to replace the other means of making Excel data available in SharePoint 2013 as outlined in the previous section, but is meant as a means of managing and securing the workbooks and publishing content through the SharePoint interface. For example, if Company 123 wants to make their Product Sales spreadsheet available to all users in the organization so that they can input their personal sales information, Excel Services would not be the best way to do this. Rather, the manager, who wants to leverage SharePoint technologies, would ask users to update a SharePoint list (such as a Product Sales list) and then review the information to ensure it is accurate. The manager would then export this content to create a spreadsheet, add graphs for ease of analysis, and then publish it using Excel Services. This example is shown in action later in this chapter.
Note
Excel Services can open workbooks from SharePoint libraries as well as from Universal Naming Convention (UNC) paths and Hypertext Transport Protocol (HTTP) websites. For initial testing purposes, it is generally recommended to start with SharePoint library-based workbooks and then extend to other sources.
Before the process of publishing using Excel Services is reviewed, the Excel Services service application will be reviewed from a high level because it is important for the farm administrator to understand the different tools available for configuring and managing the Excel Services service application before opening it up to users for testing purposes.
A Brief History of the Evolution of Excel Services
Excel Services was introduced in SharePoint 2007, where it was part of the shared services provider and created the foundation for the product as it exists today. It served as a key component in Microsoft’s BI strategy, as Microsoft realized that Excel spreadsheets contained an incredible amount of data in the average organization, as well as equations, macros, scripts, and even usernames and passwords that connected to data sources and other spreadsheets. SharePoint was a natural platform to use to allow organizations to better manage their valuable data.
A number of new features were then added to the product for the SharePoint 2010 version, including the following:
![]() Excel Services became a service application, and as such became more manageable and customizable than it was in SharePoint 2007, where it was part of the shared services provider.
Excel Services became a service application, and as such became more manageable and customizable than it was in SharePoint 2007, where it was part of the shared services provider.
![]() Excel Services provided the rendering engine that Office Web Apps for SharePoint 2010 used to allow users to read, edit, and collaborate on spreadsheets stored in SharePoint libraries via their browsers.
Excel Services provided the rendering engine that Office Web Apps for SharePoint 2010 used to allow users to read, edit, and collaborate on spreadsheets stored in SharePoint libraries via their browsers.
![]() PowerShell commandlets (cmdlets) for Excel Services management were provided.
PowerShell commandlets (cmdlets) for Excel Services management were provided.
![]() Representational State Transfer (REST) application programming interface (API) support was added. The REST API is a client/server software architecture/protocol that uses hyperlinks and lets the user access entities (such as ranges and charts) in workbooks using Excel Services through HTTP and also provides a method for users to set values in these ranges, including single cells.
Representational State Transfer (REST) application programming interface (API) support was added. The REST API is a client/server software architecture/protocol that uses hyperlinks and lets the user access entities (such as ranges and charts) in workbooks using Excel Services through HTTP and also provides a method for users to set values in these ranges, including single cells.
Excel Services in SharePoint 2013 has continued to evolve and provides additional functionality, such as the following:
![]() Code can be written using the JavaScript Object Model (JSOM). There are two supported scenarios where this code can run: The code can live on a SharePoint 2013 page or on a host web page that contains an embedded workbook that is stored on SkyDrive.
Code can be written using the JavaScript Object Model (JSOM). There are two supported scenarios where this code can run: The code can live on a SharePoint 2013 page or on a host web page that contains an embedded workbook that is stored on SkyDrive.
![]() JavaScript user-defined functions (UDFs) enable developers to add JavaScript to a web page and then reference the code from a spreadsheet. This allows functionality that Excel may not provide natively, such as getting the stock price of a current stock from a website.
JavaScript user-defined functions (UDFs) enable developers to add JavaScript to a web page and then reference the code from a spreadsheet. This allows functionality that Excel may not provide natively, such as getting the stock price of a current stock from a website.
![]() Excel Interactive View allows developers to add some Hypertext Markup Language (HTML) code to a page that contains an HTML to add a clickable Excel icon above the table. If a user clicks the icon, an Excel table and chart is generated, in the browser, providing more options for interacting with the data. Excel Interactive View uses HTML, JavaScript, and Excel Services to generate these Excel tables and chart views on-the-fly.
Excel Interactive View allows developers to add some Hypertext Markup Language (HTML) code to a page that contains an HTML to add a clickable Excel icon above the table. If a user clicks the icon, an Excel table and chart is generated, in the browser, providing more options for interacting with the data. Excel Interactive View uses HTML, JavaScript, and Excel Services to generate these Excel tables and chart views on-the-fly.
![]() Excel Services can now access data using the Open Data Protocol (OData), which builds upon the capabilities of the existing Excel Services REST API. OData can be used to get information about tables in a workbook that is stored in a SharePoint library, which is returned in the Extensible Markup Language (XML) Atom format.
Excel Services can now access data using the Open Data Protocol (OData), which builds upon the capabilities of the existing Excel Services REST API. OData can be used to get information about tables in a workbook that is stored in a SharePoint library, which is returned in the Extensible Markup Language (XML) Atom format.
Managing the Excel Service Application
Most SharePoint Server 2013 Enterprise installations contain an Excel Services service application. If a new service application is needed, you can create it from the Manage Service Applications page on the Central Administration site. The details of each configuration will vary based on the needs of the organization, and the settings for the service application are discussed here from a high level.
A number of tools allow farm administrators to manage the instance of Excel Services, as shown in Figure 26.1. Each of these tools is important for more complex Excel Services configurations, but the farm administrator can most likely leave them at their default settings for simpler implementations where the workbooks are stored in SharePoint libraries and don’t contain connections to external content.

The Global Settings tool provides access to a number of settings that are essential to configure properly if content not stored in SharePoint libraries is being accessed. The configuration details will vary based on a number of factors, such as whether there is a dedicated Excel Services front-end server (in which case, more resources can be dedicated to the Excel Services service application) or if Excel Services is sharing a front-end server with numerous other services applications. Also, the location of the data being connected to will affect these settings. For reference purposes, here are the items that you can configure:
![]() Security settings: File Access Method (Impersonation or Process Account), Connection Encryption (Not Required or Required), and Allow Cross Domain Access (Yes/No). File Access Method settings have no effect when users try to access content stored in SharePoint 2013 libraries, only when the workbooks are stored in UNC or HTTP locations. Connection encryption supports Secure Sockets Layer (SSL) and IPsec.
Security settings: File Access Method (Impersonation or Process Account), Connection Encryption (Not Required or Required), and Allow Cross Domain Access (Yes/No). File Access Method settings have no effect when users try to access content stored in SharePoint 2013 libraries, only when the workbooks are stored in UNC or HTTP locations. Connection encryption supports Secure Sockets Layer (SSL) and IPsec.
Note
In most SharePoint 2013 deployments where front-end servers and Excel Calculation Services application servers run on different computers, impersonation requires Kerberos delegation.
![]() Load-balancing options: Workbook URL, Round Robin with Health Check, or Local.
Load-balancing options: Workbook URL, Round Robin with Health Check, or Local.
![]() Session management: Maximum Sessions per User (default setting 25).
Session management: Maximum Sessions per User (default setting 25).
![]() Memory utilization: Maximum Private Bytes (set to 50% of physical memory on the machine by default), Memory Cache Threshold (set to 90% by default), and Maximum Unused Object Age (set to no maximum by default).
Memory utilization: Maximum Private Bytes (set to 50% of physical memory on the machine by default), Memory Cache Threshold (set to 90% by default), and Maximum Unused Object Age (set to no maximum by default).
![]() Workbook cache: Location (by default stored in the system temporary directory), Maximum Size of Workbook Cache (by default set to 40,960MB), and Caching of Unused Files (enabled by default).
Workbook cache: Location (by default stored in the system temporary directory), Maximum Size of Workbook Cache (by default set to 40,960MB), and Caching of Unused Files (enabled by default).
![]() External data settings: Connection Lifetime (set to 1,800 seconds by default), Analysis Services EffectiveUserName (disabled by default), and Unattended Service Account. (Secure Store Service Association can be provided or a new Unattended Service Account can be defined.)
External data settings: Connection Lifetime (set to 1,800 seconds by default), Analysis Services EffectiveUserName (disabled by default), and Unattended Service Account. (Secure Store Service Association can be provided or a new Unattended Service Account can be defined.)
The Unattended Service Account option allows the farm administrator to specify the application ID of a target application ID that needs to be configured in the Secure Store service application. The target application ID is provided with credentials and a password, administrators are configured, and a key is generated for it. This target application ID is then used as a “get data” type of account when a workbook is loaded that contains a data connection for the unattended account, and it is required when a workbook connection specifies None for authentication.
Additional tools available from the Manage Excel Services Application page include the following:
![]() Trusted File Locations: These are the file locations (SharePoint Foundation-based, UNC, or HTTP) that are considered “trustworthy,” and Excel workbooks can be published to these locations. Child libraries and directories can also be trusted; Session Timeouts, Maximum Workbook Size, and Maximum Chart Size can be defined; and external data connections can be configured here. By default, the address http:// is considered trusted along with children sites, but you can change this (for example, to only include the Finance Department’s site or other site or site collection). Figure 26.2 shows an example where the URL http://sp20131/sites/Finance is the only trusted location.
Trusted File Locations: These are the file locations (SharePoint Foundation-based, UNC, or HTTP) that are considered “trustworthy,” and Excel workbooks can be published to these locations. Child libraries and directories can also be trusted; Session Timeouts, Maximum Workbook Size, and Maximum Chart Size can be defined; and external data connections can be configured here. By default, the address http:// is considered trusted along with children sites, but you can change this (for example, to only include the Finance Department’s site or other site or site collection). Figure 26.2 shows an example where the URL http://sp20131/sites/Finance is the only trusted location.

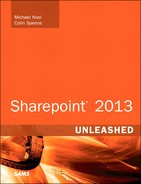
![]() Trusted Data Providers: A number of data providers that can be used for external data sources in Excel workbooks are already provided, and new ones can be defined using the data provider types OLE DB, ODBC, or ODBC DSN. Figure 26.3 shows the full list.
Trusted Data Providers: A number of data providers that can be used for external data sources in Excel workbooks are already provided, and new ones can be defined using the data provider types OLE DB, ODBC, or ODBC DSN. Figure 26.3 shows the full list.
![]() Trusted Data Connection Libraries: By default, there aren’t any trusted data connection libraries, so a farm administrator needs to add them. First, use the Data Connection Library template to create the library in the desired site collection, then click Add Trusted Data Connection Library, and then enter the URL of the library.
Trusted Data Connection Libraries: By default, there aren’t any trusted data connection libraries, so a farm administrator needs to add them. First, use the Data Connection Library template to create the library in the desired site collection, then click Add Trusted Data Connection Library, and then enter the URL of the library.
![]() User-Defined Function Assemblies: None are provided by default, so a farm administrator must provide the strong name or full path of the assembly.
User-Defined Function Assemblies: None are provided by default, so a farm administrator must provide the strong name or full path of the assembly.
Note
STSADM commands (such as Add-ecsfiletrustedlocation, Add-ecssafedataprovider) are no longer supported against Excel Services in SharePoint 2013. Fortunately, an error is displayed in the command prompt if an administrator tries to run one of these commands. The error states: “Error. This stsadm command is no longer supported. Use PowerShell to modify Excel Services Application settings from the command line.” The cmdlets are listed in full on TechNet at http://technet.microsoft.com/en-us/library/ee906545.aspx.
Publishing to Excel Services
This section provides a walkthrough of exporting a SharePoint list to an Excel 2013 spreadsheet and then publishing that content using Excel Services. This example walks through a process where a manager at Company 123 asks his employees to update a SharePoint list with sales data, then he exports this to Excel 2013, edits it, and then publishes back to SharePoint 2013 using Excel Services. The home page for the site is then edited to include an Excel Web Access web part that links to the published content.
This example helps to clarify the full process of publishing using Excel Services and then exposing the data using the Excel Web Access web part, so administrators and power users can get a sense for what is and isn’t possible using Excel Services. This is just “scratching the surface,” and administrators and power users should feel free to experiment with publishing other Excel workbooks using Excel Services and learning what is and isn’t supported in the publishing process.
Prerequisites for this example include the following:
![]() SharePoint 2013 Enterprise must be installed, and an Excel Services service application must be configured and working for the site where the lists live.
SharePoint 2013 Enterprise must be installed, and an Excel Services service application must be configured and working for the site where the lists live.
![]() A PC or image with Excel 2013 must be available.
A PC or image with Excel 2013 must be available.
The site that will be used needs to have a custom list (described next), as well as a document library that doesn’t need any special configuration settings. The site used in this example is http://sp20131/salestest and is built using the Team Site template.
Assuming these prerequisites are met, follow these steps to walk through this example:
1. Create a list called Product Sales using the Custom List template, and then configure the list so that it contains the columns and settings described in Table 26.1.

2. Add several items to this list so that there is enough data to create charts from (for example, data for several different salespeople for different products sold in different months). An example of the resulting list is shown in Figure 26.4. This simulates a simplified tracking tool that salespeople use to enter their sales into a list that the manager then verifies, analyzes, and publishes in Excel Services.

3. From the Product Sales list, click the List tab on the Ribbon and select Export to Excel button.
4. Click Open when the File Download window opens.
5. Click Enable when the Microsoft Excel Security Notice window opens. This enables data connections between the computer and SharePoint 2013, which are required to update the content of the workbook at a later time.
6. An Import Data appears. Verify the options Table and New Workbook are checked. Click OK.
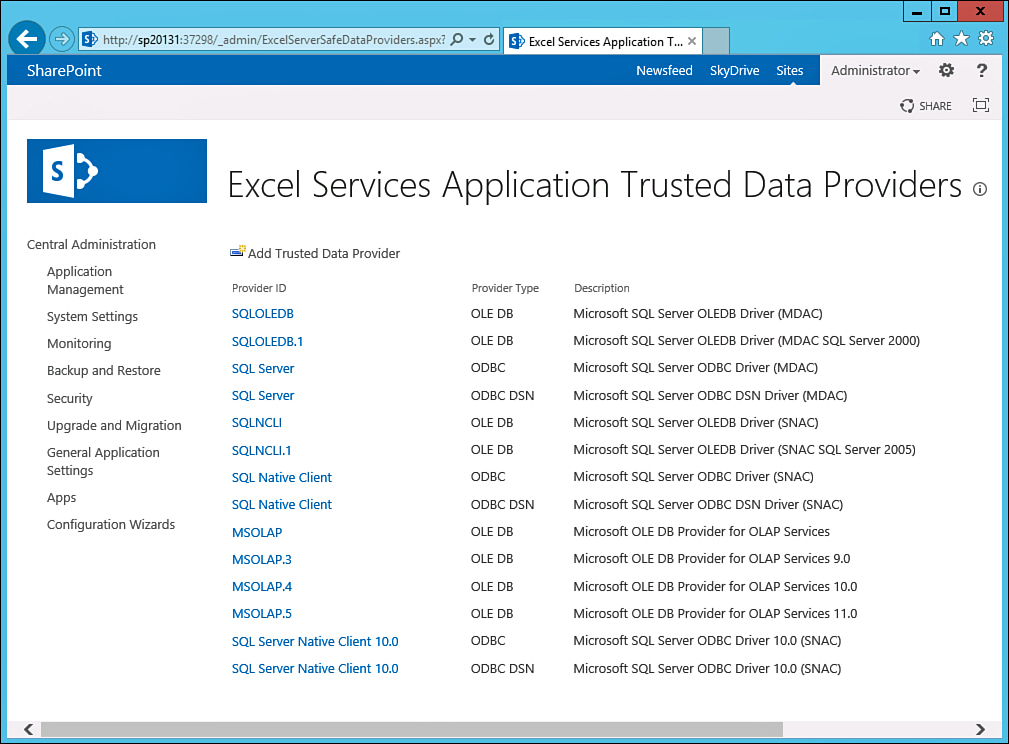
7. Excel opens and displays the content similar to what is shown in Figure 26.5. Actual values will vary based on what was entered in the SharePoint Product Sales list. At this point, there is still connectivity between the SharePoint list and the Excel workbook, as you can see on the Design tab on the ribbon, which shows the Refresh button that will refresh the content from the SharePoint 2013 list.
8. Click the File tab in Excel, then Save As, and save the workbook to a local folder on the computer as Product Sales Local Copy and click Save. This reflects the manager’s desire to save the workbook locally so that he can edit it before he publishes it using Excel Services.
9. Navigate back to the Product Sales list in SharePoint and change a value, such as the product sold for a specific entry. This simulates the manager spotting an error in the spreadsheet and fixing it in the list.
10. Return to the spreadsheet, make sure the Data tab is active, click the drop-down arrow under the Refresh All icon, and select Refresh All. Verify that the value in the spreadsheet changes to reflect the change made in the SharePoint list.
11. Still in Excel, click the Design tab (if not visible, click any cell that contains data in the table) and check the value of the table name in the Table Name field in the Properties section of the Ribbon on the left. It will be something similar to Table_owssvr_1. Change this value to Table1 and press Enter to save the value.
12. Right-click the tab at the bottom of the screen and rename the active tab to Sales Numbers. These small changes make the workbook easier to deal with when it is published using Excel Services.
13. Next, a PivotChart is added for more interactive analysis of the data. Click the Insert tab on the ribbon and then the PivotChart icon.
14. The Create PivotChart window opens. The Table/Range field should be active and have the blinking text entry cursor in it. Click and drag on the worksheet to select the range of cells that includes the content under the Salesperson, Product, Quantity Sold, Month of Sale, and Item Type columns (but not the header rows), as shown in Figure 26.6. This selects a subset of the data contained in the table but leaves out the Invoice Number column, as well as the Path column.

15. Verify that New Worksheet is selected in the Choose Where You Want the PivotChart to Be Placed section. Click OK.
16. A new worksheet opens, and the PivotTable Field List tool pane is open on the right side of the screen. Check the Salesperson, Product, Quantity Sold, Month of Sale, and Item Type check boxes in the Choose Fields to Add to Report field, as shown in Figure 26.7.

17. Close the PivotChart Fields list pane.
18. Click the Save button to save the changes locally.
19. Now the manager is ready to publish the workbook to a SharePoint document library using Excel Services. To accomplish this, click the File tab on the ribbon, and then click Save As.
20. Click Other Web Locations and the Browse button.
21. From the Save As window, type in the URL of the site where the spreadsheet is to be saved at the top of the window (in this example, http://sp20131/salestest/shared documents is entered), and then click Enter. Give the document an appropriate filename, such as Product Sales Shared. Figure 26.8 shows an example. Click Save.

At this point in the example, the workbook has been saved to the document library. The manager, who happens to also manage the SharePoint 2013 site, now wants to display this content on the home page of the site, and so performs the following steps:
1. Assuming the previous steps have been completed successfully, return to the home page of the site that houses the document and list (http://sp20131/salestest/_layouts/15/start.aspx/ in this example) and access the Edit icon.
2. Click the Insert tab on the ribbon and click the Web Part button.
3. Click the Business Data folder in the Categories list of items, and then click Excel Web Access in the Web Parts section. Click Add, and the Excel Web Access web part is added to the page, as shown in Figure 26.9.

4. Next, the Excel Web Access web part needs to be edited to display data. Click the link inside the Excel Web Access web part that reads Click Here to Open the Tool Pane; the tool pane opens on the right.
5. Scroll to the right to expose the tool pane if needed, and click the ellipsis next to Workbook at the top. Then from the Select as Asset window, navigate to the document library that the Excel workbook was published to and select the workbook (Product Sales Shared.xlsx in this example), and click Insert.
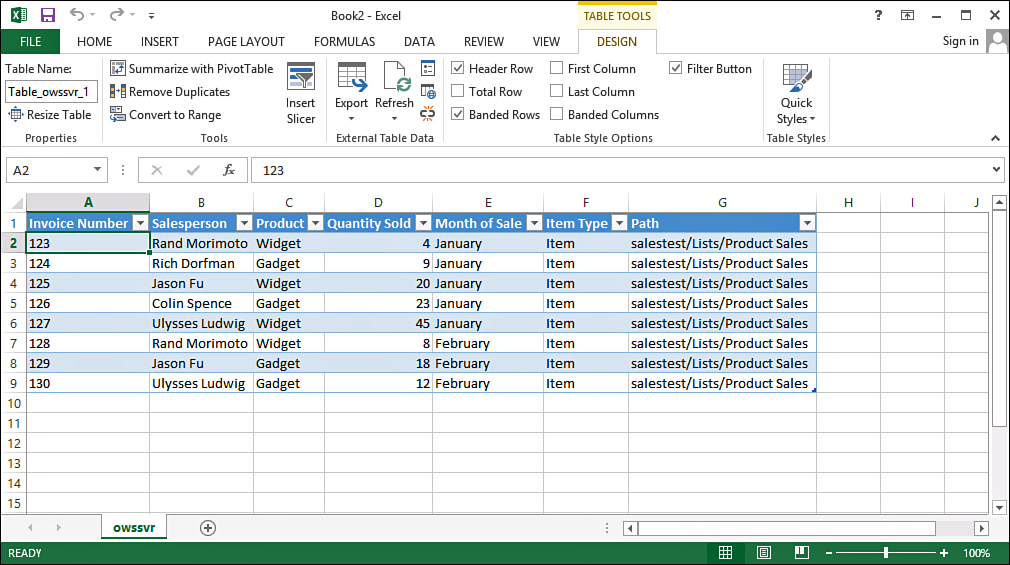
6. Click OK, and the page should look like Figure 26.10. In this example, Sheet 2 is displayed, which includes the PivotTable, but other tabs can be displayed by clicking the tab in the web part.
Note
If there is an error displaying content in the web part, go to Central Administration and make sure Excel Calculation Services is started under System Settings, Manage Services on Server.
7. Click the Save button to save changes.
8. Finally, collapse the nodes in the PivotTable view and note that the table reflects the changes and now only displays a single column per salesperson, as opposed to multiple columns per salesperson, when the PivotTable nodes are expanded. Note that none of the cells can be edited in the Excel Web Access web part.
The Excel Web Access web part offers a handy tool in the File tab: the Reload Workbook tool. This reloads the workbook to Excel Services, which may sometimes be needed because content is cached and the version being viewed might not reflect all the most recent changes.
This exercise shows an example of how a manager can use Excel Services to publish certain items from a workbook to a document library, and then the Excel Web Access web part can be added to a page to allow users to interact with a PivotTable and PivotChart.
Additional experimentation with the different tools provided in the Excel Web Access web part is encouraged, as well as additional modifications to the data in the SharePoint list, which is still connected to the spreadsheet and can, therefore, be refreshed when the SharePoint 2013 list changes and then republished to the SharePoint document library via Excel Services.
Allowing Parameter Input in Excel Web Access
Another feature to be familiar with is the ability to name a cell in Excel 2013 and publish it using Excel Services, enabling users to input a value through the Excel Web Access interface. Although somewhat time-consuming to configure, it can allow for interactivity through the Excel Web Access web part that might be very useful for encouraging end users to interact with the data. Remember that any data input by end users in the Excel Web Access web part is not saved to the published spreadsheet, so it is really only for “what if” scenarios.
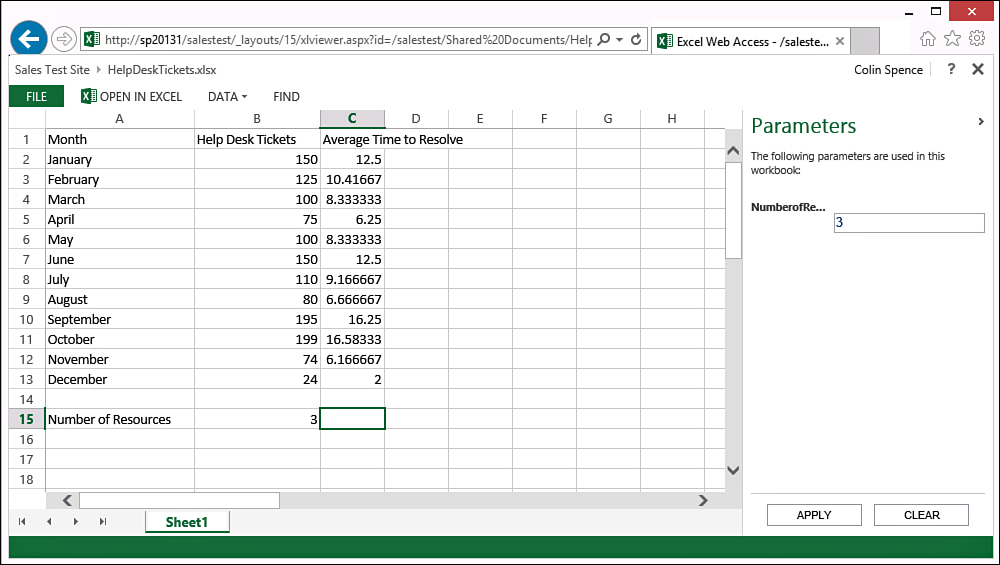
The following example reflects a situation where an IT manager wants to show senior management the impact of total number of help desk resources on average time to resolve the help desk tickets that come in based on numbers from the previous year. She creates a base spreadsheet with the months and number of help desk tickets per month, and then creates an equation for the Average Time to Resolve (Hrs) column that divides the total number of tickets by the variable that will be input by the Excel Web Access web part users. This allows users of the published worksheet to enter in different numbers in the Number of Resources cell and see the results over the course of the year. She is hoping this will enable her to convince senior management that the organization needs more help desk staff at certain times of the year if they want to meet their service level agreement (SLA) of no more than 4 hours average time to resolve help desk tickets. This example also allows the IT manager to show off her Excel Services skills to show senior management another capability of SharePoint 2013.
Follow these steps to test the process:
1. Create a new spreadsheet in Excel 2013.
2. Provide the heading Month to column A in cell A1.
3. Enter the text January in cell A2. Grab the lower-right corner of the cell, while highlighting cell A2, and drag downward until all the fields are populated with the months up to December.
4. Enter Help Desk Tickets as the header in cell B1. Enter random numbers between 0 and 200 for cells B2 through B13.
5. Enter Average Time to Resolve as the header in cell C1.
6. Enter the text Number of Resources in cell A15.
7. Select cell B15 and access the Formulas tab.
8. Click Define Name in the Defined Names section of the ribbon. Enter a name of NumberofResources and click OK. The results should look like Figure 26.11, with the exception of the actual values entered in cells B2 through B13. Note in Figure 26.11 that the name of the named cell (NumberofResources) appears in the name box to the left below the Ribbon where the cell name is normally displayed.

9. Select cell C2 and enter the following formula, which divides the number of tickets by the number of resources multiplied by four:
=B2/(NumberofResources*4)
Click Enter to save the equation. This equation assumes that each resource can resolve four help desk tickets in an hour.
The error #Div/0 error displays because there is no value in cell B15.
10. Click cell C2 and drag down to cell C13; all cells should display the #Div/0 error.
11. Click the File tab, click Save As, and click Other Web Locations. Click the Browse button.
12. Click the Browser View Options button in the lower-left corner of the Save As window, click the Parameters tab, click the Add button, and check the box next to NumberofResources; then click OK. The results should match Figure 26.12.

FIGURE 26.12 Using the Parameters tab in the Browser View Options windows when saving an Excel file to SharePoint.
13. Click OK again to close the Browser View Options window.
14. In the Save As window, enter the full path for the SharePoint site and document library in the Filename field and enter the filename HelpDeskTickets (so in this example, it is http://sp20131/salestest/shareddocuments/HelpDeskTickets). Click Save.
15. Navigate to the document library where the document was stored and click the document filename. The document should display in the browser. Enter a whole number in the Parameters pane to the right and click Apply; the results should be similar to Figure 26.13.
Note
If the document does not open in the browser using Excel Services, as mentioned in step 15, a number of factors could be involved. Check the Library Settings, Advanced Settings link, and verify that Open in the Browser or Use the Server Default (Open in the Browser) are selected. Also make sure that Excel Calculation Service is started. Check under Central Administration, System Settings, Manage Services on Server.
If this doesn’t resolve the problem, there may be other problems with Excel Services, or the site or library containing the spreadsheet isn’t trusted by Excel Services.
This example shows the steps involved with defining the name of a specific cell and then including that cell in the publishing process using Excel Services, as well as showing the interface that results. Multiple named cells can be defined in a workbook, which can then essentially be used as variables in the resulting content that is surfaced in the Excel Web Access web part. Combine this with tools such as charts, PivotTables, and conditional formatting, and the results can be very powerful.
Visio Graphics Service Overview
Visio Graphics Service is somewhat similar to Excel Services. For example, it enables users to view a Visio diagram (saved in .vsdx format) directly in their browser without having to open it locally. In addition, SharePoint 2013 Enterprise offers a Visio Web Access web part that enables administrators and developers to add the web part to a page and connect to a Visio document. There are also tools provided for developers to connect to external data sources, such as a SharePoint list or a variety of other data sources, and the JSOM provides tools for developers to create interactive mashups and applications based on Visio diagrams.
Visio Graphics Service in SharePoint 2013 has improved since the SharePoint 2010 version; a new type of Visio file (.vsdx) allows users to save files directly to SharePoint where they can be viewed in the browser using Visio Services. In SharePoint 2010, the Visio files had to be published in Visio Web Drawing (.vdw) format to be viewed in Visio Services, and only Visio Professional 2010 or Visio Premium 2010 could publish to those formats. Visio Services can still render the .vdw formats in SharePoint 2013.
The following list summarizes some other key improvements in Visio 2013 and Visio Services 2013:
![]() Visio Professional 2013 supports coauthoring on documents stored in SharePoint 2013 or SkyDrive so that multiple users can work on Visio diagrams simultaneously.
Visio Professional 2013 supports coauthoring on documents stored in SharePoint 2013 or SkyDrive so that multiple users can work on Visio diagrams simultaneously.
![]() Comments can be attached to shapes in Visio 2013, and users without Visio on their desktops can access comments and add their own through the browser if Visio Services is installed.
Comments can be attached to shapes in Visio 2013, and users without Visio on their desktops can access comments and add their own through the browser if Visio Services is installed.
![]() Visio 2013 diagrams can be connected to external lists created using SharePoint Business Connectivity Services (BCS) on SharePoint Server 2013.
Visio 2013 diagrams can be connected to external lists created using SharePoint Business Connectivity Services (BCS) on SharePoint Server 2013.
![]() Visio 2013 includes a framework for adding comments, which can be associated with a particular shape or page.
Visio 2013 includes a framework for adding comments, which can be associated with a particular shape or page.
![]() Users can now configure their data-connected diagrams directly from the Visio client, which allows data sources to be refreshed in Visio Services.
Users can now configure their data-connected diagrams directly from the Visio client, which allows data sources to be refreshed in Visio Services.
![]() The JSOM in Visio Services provides programmatic access to Visio drawings displayed in the Visio Web Access web part so that developers can create mashups or applications that access data stored in shapes interactively.
The JSOM in Visio Services provides programmatic access to Visio drawings displayed in the Visio Web Access web part so that developers can create mashups or applications that access data stored in shapes interactively.
Figure 26.14 shows an example of a Visio 2013 drawing saved to a SharePoint 2013 Enterprise document library in a farm where Visio Services is enabled. In this example, the Library Settings for the library have been configured so that the Default open behavior setting (accessible under Advanced Settings) for browser-enabled documents set to Open in the browser or Use the server default (Open in the browser). In this example, a user simply clicks the document filename in the document library, and Visio Services renders the drawing in the browser. At the top of the screen, the breadcrumb is listed, and Visio Web Access is shown to the right. Beneath that information are several links: Open in Visio, Refresh, Share Information, and Comments. A drop-down menu lists any additional pages contained in the Visio file. A zoom-in/out slider bar is provided in the lower-right corner.
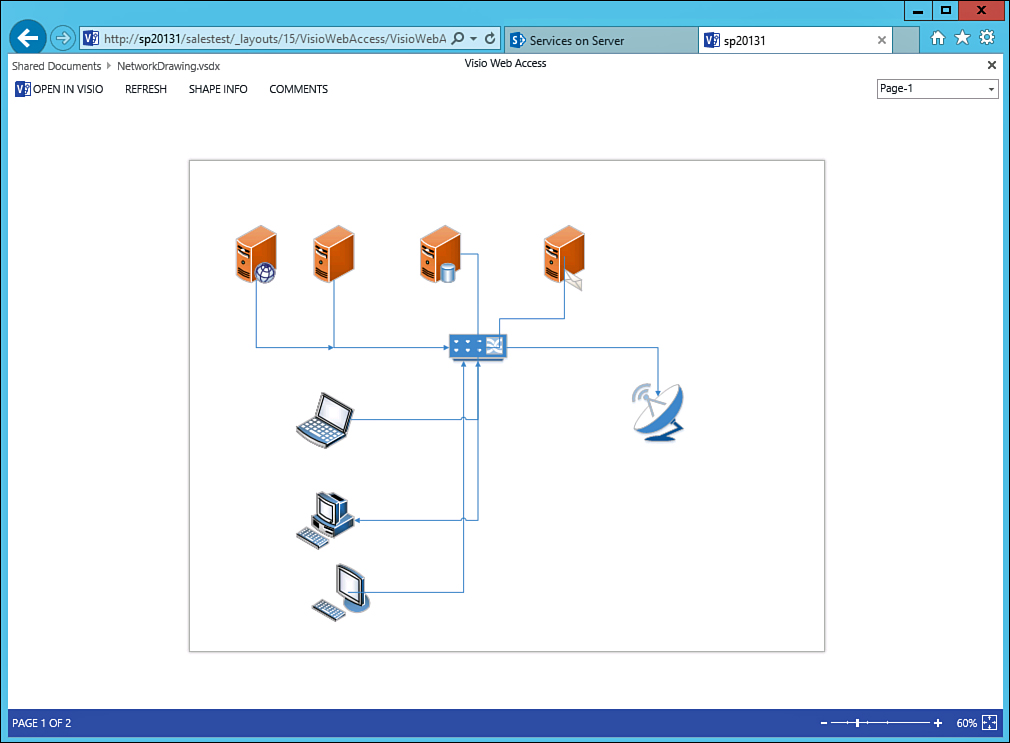
Figure 26.15 shows the results in this example where a shape was selected, then the Shape Info was clicked, and the Comments link was clicked. In this example, the author of the drawing added data to the server shape—as shown in Figure 26.15—including the asset number, serial number, location, and other default data fields associated with the shape in Visio 2013. By clicking Comments, an end user (who doesn’t need Visio on his desktop) can add comments that other users can respond to.

While Visio Graphics Service might not be one of the most widely used tools in the SharePoint toolbox, it does provide features than can enhance the collaborative use of SharePoint by the organization, especially where graphically detailed documents are required. Basic examples include network diagrams, flow charts for business processes, maps, floor plans, and the like. A developer can then add functionality to these files that can make them much more useful to the user population. For example, a map of the United States in Visio 2013 could show shapes for each office around the country, connect to additional information about each office, and provide a hyperlink to the SharePoint site for each office.
Reviewing the Visio Graphics Service Service Application
As with the Excel Services service application, the Visio Graphics Service service application is created by default in SharePoint Server 2013 Enterprise via the wizard in most cases. If a new service application is needed, you can create it from the Manage Service Applications page on the Central Administration site.
The settings for the Visio Graphics Service service application are as follows:
![]() Global Settings: Include Maximum Web Drawing Size (25MB is the default, with 50MB being the supported limit), Minimum Cache Age (5 minutes is the default number of minutes and 34,560 the maximum), Maximum Cache Age (60 minutes is the default number of minutes and 34,560 the maximum), Maximum Recalc Duration (60 seconds is the default and 120 seconds the maximum), and Unattended Service Account Application ID.
Global Settings: Include Maximum Web Drawing Size (25MB is the default, with 50MB being the supported limit), Minimum Cache Age (5 minutes is the default number of minutes and 34,560 the maximum), Maximum Cache Age (60 minutes is the default number of minutes and 34,560 the maximum), Maximum Recalc Duration (60 seconds is the default and 120 seconds the maximum), and Unattended Service Account Application ID.
![]() Trusted Data Providers: A number of data providers are already provided as shown in Figure 26.16, and new ones can be added.
Trusted Data Providers: A number of data providers are already provided as shown in Figure 26.16, and new ones can be added.

Access Services Overview
Microsoft Access is a very powerful and easy-to-use database, form and report creation tool. From an IT perspective, however, it can be seen as a tool set that encourages users to create databases and even applications to meet their needs and that IT has no control over. For example, an employee may have used Access to create a custom database, complete with several reports, customized forms for data entry and macros to perform calculations on data entered, that stores and reports on key sales information. The database could be saved to a file share, the employee’s local computer, or be copied as needed to other devices such as a laptop or home computer. And although this is very handy to the employee, it becomes difficult if not impossible for IT to back up the data or ensure that it won’t accidentally—or otherwise—end up in a competitor’s hands. If the database contains healthcare information about patients or personal data, it is likewise a source of concern for IT (and the legal department).
In addition, Access was designed by Microsoft to be a “lightweight” database tool, for less-sophisticated users, and therefore had a number of limitations. For example, Access 2010 has a limit of 2GB for an Access database (.accdb file), including all database objects and data. There are workarounds, such as linking multiple tables, but as end users and developers pushed the limits of what Access was capable of, IT was forced to look for alternatives, one of which is to move the databases to Structured Query Language (SQL) Server, and another of which is to move the databases to SharePoint Access Services.
Access Services in SharePoint 2010 was designed as an alternative to the “rogue” databases and applications, as it allowed IT to migrate Access databases, forms, and reports to the SharePoint environment, which was more effectively controlled by IT. Access Services also allowed users to create sites using out-of-the-box site templates (including Assets Web Database, Charitable Contributions Web Database, and Contacts Web Database), which could be modified much as Access databases could be, and end users could create forms and reports to meet their precise needs, without using the standalone Access products.
Access Services in SharePoint 2013 still supports Access Services from SharePoint 2010, but also provides a new incarnation of the tools, which have been modified significantly.
Assuming SharePoint Server 2013 Enterprise is installed and the wizard was used to configure the farm, the default service applications will include both Access Services 2010 and Access Services (which is really Access Services 2013). When a new Access application is created, Access Services creates a new database that stores the data, view, queries, and macros contained in the app. A key difference between Access Services 2010 and Access Services 2013 is that Access Services 2013 can take advantage of isolated app domains and can create the new databases on a different SQL 2012 server. This allows IT the option of separating the Access data and related components on a different SQL instance or a different server.
Summary
This chapter covered the integration of Excel and SharePoint, especially using the Excel Services tools, because this is such an important capability of SharePoint 2013. Many knowledge workers and managers still “live” in Excel and manage much of the most critical information in workbooks, so understanding what Excel Services can and cannot do is important for SharePoint power users and administrators. A brief overview of Visio Graphics Services and Access Services was provided to suggest some use cases for these tools. Access Services can be used for a wide range of database requirements and supports both legacy Access Services 2010 databases and the new Access Services 2013 apps, but coverage of this topic in depth is beyond the scope of this chapter.
Best Practices
The following are best practices from this chapter:
![]() There are numerous ways to move content from Excel spreadsheets and workbooks into SharePoint 2013. IT should understand the different options, including the following: creating a new list and cutting/pasting content into it, using the Import Spreadsheet list template to import data from an Excel spreadsheet, exporting list data to an Excel spreadsheet, or using Excel Services to publish a spreadsheet to a SharePoint 2013 library.
There are numerous ways to move content from Excel spreadsheets and workbooks into SharePoint 2013. IT should understand the different options, including the following: creating a new list and cutting/pasting content into it, using the Import Spreadsheet list template to import data from an Excel spreadsheet, exporting list data to an Excel spreadsheet, or using Excel Services to publish a spreadsheet to a SharePoint 2013 library.
![]() Excel Services allows Excel 2013 users to save a workbook to a SharePoint library, and then the Excel Web Access web part can be used to connect to a published Excel workbook and display tables, charts, and other items in the web part, usually on a read-only basis.
Excel Services allows Excel 2013 users to save a workbook to a SharePoint library, and then the Excel Web Access web part can be used to connect to a published Excel workbook and display tables, charts, and other items in the web part, usually on a read-only basis.
![]() Many users want to interact with the data presented by Excel Web Access web part, so the different tools available from the File tab in the Excel Web Access web part (Open in Excel, Download a Snapshot, and Download a Copy) should be demonstrated to users. In addition, the section in this chapter titled “Allowing Parameter Input in Excel Web Access” shows how a cell can be named and then published via Excel Services to allow input to the Excel Web Access web part.
Many users want to interact with the data presented by Excel Web Access web part, so the different tools available from the File tab in the Excel Web Access web part (Open in Excel, Download a Snapshot, and Download a Copy) should be demonstrated to users. In addition, the section in this chapter titled “Allowing Parameter Input in Excel Web Access” shows how a cell can be named and then published via Excel Services to allow input to the Excel Web Access web part.
![]() Visio Graphics Service allows users to save Visio 2013 documents in the new .vsdx format, which can be rendered in the browser if Visio Graphics Service is properly configured.
Visio Graphics Service allows users to save Visio 2013 documents in the new .vsdx format, which can be rendered in the browser if Visio Graphics Service is properly configured.
![]() Visio 2013 also offers coauthoring, comments, and other powerful application development tools that can allow the creation of graphically driven mashups and applications for collaborative purposes.
Visio 2013 also offers coauthoring, comments, and other powerful application development tools that can allow the creation of graphically driven mashups and applications for collaborative purposes.
![]() Access Services 2010 and 2013 service applications are provided in SharePoint 2013 Enterprise. These should be considered development tools, and the organization should carefully test these tools and determine whether they should be made available to the general user population.
Access Services 2010 and 2013 service applications are provided in SharePoint 2013 Enterprise. These should be considered development tools, and the organization should carefully test these tools and determine whether they should be made available to the general user population.
![]() A generally recommended best practice with Access Services 2013 is to create an isolated app domain where the Access Services databases are created on a separate SQL Server 2012 instance.
A generally recommended best practice with Access Services 2013 is to create an isolated app domain where the Access Services databases are created on a separate SQL Server 2012 instance.