
Spark!
You’re About to:
Ask “why, why, why” like a two-year-old child
Mix numbers and words in strange new ways
Predict the future of fashion
Play the architect for a school
Pitch an idea to the shark tank

Did You Know?
Sparks are caused by the friction of two substances, where one has a strong negative charge and the other has a strong positive charge. When you get a shock in dry weather, your hand has a strong enough positive charge to react with the negative charge on that door handle that zapped you.
In the Experience Design process, sparks come from understanding the negative aspects of the current situation (problems, and their consequences) and thinking of creative actions you can take for positive change. This kind of spark will lead to great ideas for solutions to design.
Sometimes an idea can come to you so suddenly that it’s hard to pinpoint all of the elements that went into it. Some wonderful combination of things brewed in your brain until a connection was made.
When you make that new mental connection, your brain rewards you by releasing pleasure chemicals that make you feel good. Did you just come up with a great word to use in Words with Friends? “Well done!” says your brain. “Here, have some dopamine!” Ahhhhh.
Because creating new connections and ideas is so tied to pleasure, it can be easy to get attached to a particular solution. After all, that solution just FELT good so it must be the best, right? That way of thinking can be dangerous for designers, though, because that solution may not be the best one. Maybe it doesn’t fix the real issue that’s causing a problem. Maybe it’s a relatively insignificant part of the problem, not worth the effort you put into it. How do you know?
In this chapter, you’ll focus on sparking great solution ideas (the positive charge) with information about the problems and its consequences (the negative charge). When both sides of that are intense enough to cause a spark, you know you’re on a good path.
In Sponge, you immersed yourself into a situation to gain valuable insights. That will ground you for this adventure–and being grounded is important when you’re dealing with electricity!
So dim the lights. Gather your needs. Start brewing information in your brain. Let’s find out what ignites your imagination!
In this adventure you will SPARK an idea for what you’d like to design by taking the knowledge that you gained when immersing (SPONGE) and applying your skills in problem-solving. By the end of the chapter you will identify the problems that you want to solve for a particular group of people, form questions to help you generate possible solutions, and choose one solution to design as you move on to SPLATTER.

Questions to Ponder:
• How do you figure out which problems you should try to tackle?
• What happens when you solve the wrong problem?
• How can you communicate the urgency of a problem that you want to solve?
• How do you generate ideas that will produce solutions to a problem?
What You’ll Do:
• Dig beyond the surface of a problem to figure out the root needs or issues that may be causing it.
• Discover the impact of the problem you’d like to address.
• Conduct a creative brainstorm session to find solution ideas.
• Create a Spark Frame that describes your chosen solution idea, and why it’s important.
• Pitch your proposal to others!
Introducing: The Spark Frame
So what is a Spark really? A Spark is a question that helps you generate solution ideas for real problems. A good Spark Frame like the one below outlines the overall challenge, the related problems you’ve found, your Spark, and some possible creative solution ideas. Let’s break this down, using this book as an example!

Choosing Improvements
Let’s dig deeper into our original challenge in order to explore elements of your Spark Frame. In Sponge, you chose a type of improvement to explore. A good Spark Frame includes improvements that are ideally measurable, so you can tell if your solution really has made an impact. Two fairly different types are quantitative and qualitative.
Quantitative Improvements
Quantitative improvements are based on numerical data (quantities), and are gathered by tracking and measuring the concrete results of a test. For example, an objective improvement would be to make something:
• More effective (the same amount of effort from the user has a greater impact when the activity is performed). These shoes are more effective than others because they give you a higher jump with no extra push on your part.
Other numerically-driven improvements include making something:
• More efficient, (The activity can be completed in less time, or with fewer resources.)
• More predictable. (Each time you perform the activity, you tend to get the same measurable result.)
• Safer. (Fewer accidents or injuries happen when the activity is performed.)
Qualitative Improvements
Qualitative improvements focus on qualities, such as users’ perceptions of an activity or how they feel during it. They are more word-oriented, and often more inspirational. For example, you could make an activity:
• More luxurious
• More fun
• Less stressful
• More glamorous
These improvements are harder to measure, but there are ways. For example, you could give two surveys to your user group to find out how they felt about the activity before and after using your new design.
You may want to have both a qualitative and quantitative improvement in mind to be sure you’re making an impact - and delighting your users, too. Biking can be safer AND more luxurious for the bald!
Activity: Measure Up: The Object of Your Affection
Ah, Valentine’s Day. It’s a holiday with a lot of commercial appeal. Imagine that you’ve been hired by the city to make the holiday healthier and more affordable for its citizens. You’ve already made a series of pretty specific recommendations to improve citizens’ health and budgets on Valentine’s Day, but now you need to let the city know how you plan to measure the impact of your solutions. How will you gauge whether or not your solutions will be successful? Read the statements below, and then write in your objective measurement after each one.
How would you measure your results if you were trying to make Valentine’s Day treats healthier for children?
I’d measure the number of cavities that kids got in the months after the holiday,
compared with the number of cavities last year at the same time_____________________________________________________
How would you measure your results if you were trying to make valentines cards easier to share for students?
__________________________________________________________________________________________________________
__________________________________________________________________________________________________________
How would you measure your results if you were trying to make mail-order flowers less expensive for women?
__________________________________________________________________________________________________________
__________________________________________________________________________________________________________
How would you measure your results if you were trying to make chocolates less fattening for men?
__________________________________________________________________________________________________________
__________________________________________________________________________________________________________

Game: WORD Herd
Goal
Learn about subjective measurement first hand by assessing a tattoo sleeve as an individual and as a group.
Helpful Hint: The bigger the group, the better the results
What You’ll Need
• Something to write on that everyone can see: A chalkboard, white board, or piece of poster board
Step 1: Sleeve It to Me
Check out the tattoo design on the following page. How does the design make you feel? Would you get this tattoo?
Step 2: Evaluate the Tattoo
Now look at the list of words to the right of the design. Circle the words that you feel describe that tattoo sleeve design. For example, if you think the tattoo is funny, then circle the word “funny.” Circle as many words as you want.
Step 3: Plot out the Cloud
Designate someone to be the Word Herd recorder to stand by the board or poster and record the group’s reactions. Pick someone to start with and have that person read out all the words that he circled. The recorder will write down each word on the board for all to see, leaving plenty of space (around 12 inches) between words. When the recorder has written down all the words that the first person circled, move on to another person in the group and have her do the same.
If the second person circled the same word as the first person, the recorder does not need to write that word down again, he only has to put a circle around the word he has already written. But make sure to write down any words that the second person chose, which the first person did not.
Continue to go around the group, until everyone has has a chance to read their words. Every time someone chooses a word that was already been written down, add another circle around it. Eventually, the most popular words will have many circles around them.
Game: WORD Herd con’t
Step 4: Ya Herd?
What were the results of your Word Herd? Did everyone tend to agree on a few words, or were the results all over the map? Did more popular words tend to relate to each other, or were they opposites? Why do you think some people picked the same words, while other people picked different ones? If you were the tattoo artist, how might you change the design to appeal to more people in your group?
Step 5: Play It Again, Sam
What else can you assess with a Word Herd? Just about anything! Try reviewing a corporate logo with a group. Or, put the visual branding of any of your solutions from this book’s activities to the test.
• Funny
• Cool
• Out of Style
• Impractical
• Painful
• Controversial
• Pointless
• Feasible
• Masculine
• Feminine
• Foolish
• Classic
• Dirty
• Weird
• Enviable
• Beautiful
• Ugly
• Attractive
• Artistic
• Modern
• Unprofessional
• Expensive
• Clever
• Hip
• Trendy

Defining the Problem
Henry Ford, inventor of the automobile, is famous for saying, “If I had asked people what they wanted, they would have said faster horses.”
In other words, people had a need to get from Point A to Point B more quickly, but horses were what they had. Most would have had a hard time imagining something could replace horses completely. People usually describe their behaviors or suggest improvements based on their current understandings and frustrations.
Getting to the root cause of a problem is an excellent way to think bigger when designing. You can do this by asking Why (during an interview, or to yourself) multiple times until you feel that you’ve gotten to the source of a series of problems.
Let’s say you’re trying to decrease the number of morning tardies in a high school. In the example to the right, you could have stopped at the first suggestion that the student made to propose a solution (marked with a star *). Or you could keep going and uncover an entirely different set of problems.
Try it yourself! Ask a friend about a recent time when he or she ran late for class, work, or an appointment.
What problems can you see within this exchange? Which do you think would be the best to solve? Often, you’ll want to create a solution that has a great impact. But how can you anticipate solutions that will?

Let’s say you observe the “dropoff” area mentioned on page 35. If you sketch it, or ask drivers to tell you how they feel about the process, that’s qualitative data.
If you count the number of cars that join the line during a specific half-hour period, or the average time it takes for one car to make it through, that’s quantitative.
Cracked Case Study: The Yolk’s on You
In the fall of 1969, 100 college freshman architecture students - eager to start solving problems - gathered for their first design class at the University of Illinois at Chicago. Among them was Frank Gorski.
The class had three professors, Frank recalls, and they started class with an anecdote. Have you ever opened a carton of eggs at the grocery store and found a broken egg inside? The class muttered consent. The professors went on to assign the students their very first design problem: Every year, millions of eggs are broken in transit. Design a better container to prevent eggs from breaking.
Frank and his classmates came up with some really cool solutions. One guy created a carton that mimicked an egg, itself, in which one egg was suspended with rubber bands in an egg-shaped package. “Not very practical [because it only held one egg],” says Frank. “But it worked really, really well. They threw it down stairs, out of a car window - it never broke.” Frank himself designed a carton that used springs and triangles to distribute the force on the egg and leveraged the egg’s vertical strength. Other students wrapped eggs in foam and wire. One student put eggs in dense foam-rubber softballs. Weeks and weeks were dedicated to creating these solutions. The final exam consisted of students dropping their egg cartons off the roof of the college to see if the eggs would break or not.
During the final class for that project, however, the professors revealed that, in relation to the number of eggs that are shipped nationwide every year, very few are actually broken in transit. The students had assumed that the professor’s word, backed up by a personal anecdote that they could relate to, constituted a real problem. It did not. They’d spent weeks solving a problem that didn’t exist!
Today, Frank is a licensed architect and Chief Plan Examiner for the Cook County Department of Building and Zoning in Illinois. He still uses the lesson he learned in that class every day.
“Make sure you are solving a problem that’s really a problem,” Frank says. “Question all your assumptions. When you go to solve a problem, you can’t preconceive what that outcome’s going to be. Do research and find good data that supports your problem, and illustrates a real need.”
Understanding Impact
You can figure out some of the impact of an existing situation by gathering data about the results that it produces. Situations that have a lot of negative results and little to no positive results are often good to focus on when looking for new, high-impact design ideas. Let’s look deeper into quantitative and qualitative data.

Quantitative Data
As we mentioned earlier when discussing improvements, results that are quantitative focus on numbers and can be measured, counted, or precisely defined. The findings are often expressed with tables of numbers, or more visually, with graphs or infographics.
You can gather quantitative data by measuring or counting things yourself, or by using data tracked digitally (such as online tools that track how many people have viewed a particular website).
If you don’t have the ability to measure something yourself, see if you can find good secondary resources for the information, such as studies completed by relatively objective research organizations. (See the sidebar on page 52.) Good outside resources can show you trends among a larger group of people, or the impact of a certain situation over time.
Qualitative Data
If you completed the interview challenge in Sponge, you’ve already gathered some qualitative data! You can gather it through observation and interviews; and your findings can be expressed using sketches, photos, or quotes that describe people’s feelings, behaviors, and motivations.
Interviewing people is not the only useful way to gather this data. In fact, if you only talk to people, you may not come up with some of the most distinctive and amazing design ideas!
Watching people performing an activity will give you great first-hand information about what they’re struggling with. You can ask them to show you, or even better, watch them in a public space (or any place where you’re invited) as they try to do something. You’ll also gather inportant information about the environment around them.
Game: Fashion a Plan
Goal
Learn the difference between quantitative and qualitative research. Try to predict what you’ll wear next week!
What You’ll Need
• Pen, paper, and an envelope
• Camera
Step 1: Set Up
Check out the chart on the next page. You are going to record both qualitative and quantitative data that you think will affect what you will wear every day next week.
Step 2: Quantitative = By the Numbers - Week 1
Write down three quantitative facts that you think will affect what you will wear for each day next week.
Step 3: Qualitative = Feel it Out - Week 1
Think about all the social and emotional influences that will affect your outfit choices next week, then write down three qualitative facts that will affect how you dress each day next week.
Step 4: Fashion Your Plan - Week 1
Based on the data that you’ve recorded for each day, write down on a separate piece of paper what you think you will wear each day next week. Be as specific as you can! Then, fold up your paper, put it in your envelope, and seal it up. No peeking at your predictions!
Step 5: Selfie Heaven - Week 2
Go about your next week as normal. Each morning, just before you step out the door to start your day, take a picture of what you are wearing. If you’ve got a coat, jacket, or other top layer on, make sure to open it up so you can record what you’re wearing underneath.
Step 6: The Envelope, Please - Week 3
Compare what you actually wore (take out those pictures!) with what you predicted you’d wear. What influenced the differences from your prediction? Was there an unpredicted change in the weather? Did you get sick, or land a hot date that made you want to wear something different? Did you have more quantitative or qualitative changes? Which changes were harder to predict, and why?
Game: Fashion a Plan: Data Collection Worksheet

Game: Bark vs. Purr: Which Do You PreFUR?
Goal
Put your new research skills to the test by taking a stand for either cats or dogs. Which would you rather own? Pick your fave furry friend, and design the ideal toy for it. Then, convince an “investor” that your pet toy is the best bet for their funding.
What You’ll Need
• Internet and/or library access
• Markers and a poster OR a collaborative space, such as a whiteboard or chalkboard
Step 1: Divide and Decide
Divide the group evenly into two teams. Designate one as Team Dog and the other as Team Cat. Choose one person to be the “investor.” That person will not be a part of either team.
Step 2: Find Your Furry Focusing Statement
Referring back to the Sponge activity on focusing statements, come up with an improvement for your team’s pet toy, by finishing this statement:
Team Cat: “I want to make play more ____ for cats.”
Team Dog: “I want to make play more ____ for dogs.”
Hint: Take a look at the current pet toys out there, and pick one aspect you’d like to make better.
Step 3: Spark Up a Solution
Spark three Solution Ideas for your Challenge statement. For example, if you wrote: “I want to make play more healthy for cats,” perhaps you considered a tunnel with cat hair brushes on the inside walls. Pick just one Solution Idea for the next step.
Step 4: Make a Group Data Date
Research both qualitative and quantitative facts to support your solution. Consider the quality of your sources: A quote from a dog walker who works with different dogs all day long will be more convincing than a quote from a single-dog owner. Remember, you are collecting these facts to convince an investor to help turn your idea into a real product!
Step 5: Presentation Creation
Compile all your facts in one place. Add some fun visuals.
Step 6: Make Your Pitch
Each team must then present its solution to the “investor,” who will pick one winning solution. Only one team can present at a time, without any interruptions from the other team. After the investor decides, discuss why that team won. Did they have more quantitative or qualitative data? Which type of data was more convincing?
Sparking a Solution Idea
You can Spark a good Solution Idea by asking a good set of thought-provoking questions that explore possibilities (with an understanding of the problem to ground them). In its IDEATE mixtape, Stanford’s d.school came up with a great set of explorations they called HMW questions, for “How-Might-We?”
So, How-Might-We:
Amp up the good?
List the elements that are good in a situation and think of ways to make them even more positive. You could flip this and also ask, “How might we remove the bad?”
Use unexpected resources?
List the people, items, environmental factors, and other aspects of the context around your situation. How could they be used differently to help solve the problem?
Challenge an assumption?
In Sponge, we talked about assumptions that you may have about an activity, need, or group of people. List those on paper. Are there ways to challenge those assumptions, or work around them?
Your answer to these questions could be in the form of a creative action you that propose. and the thing you intend as the solution (more on those “things” in a moment). Some good action starters include:
Build, create, design, redesign, write, devise, compose, fabricate, fashion, form, invent, and produce.
Taking an example from page 35, if your problem is:
The track team’s path crosses a busy roadway.
You could ask:
How might we amp up good?
Your exploration might lead to this thought:
Track practice is good in that it provides exercise. Can we find a solution that moves the path and provides more exercise?
And your Solution Idea may be:
Build an exercise obstacle course that directs track team members up and over the road rather than requiring them to cross it by walking. This leads to additional exercise and a clearer roadway.
Let’s look at a case study that shows one path to a solution.
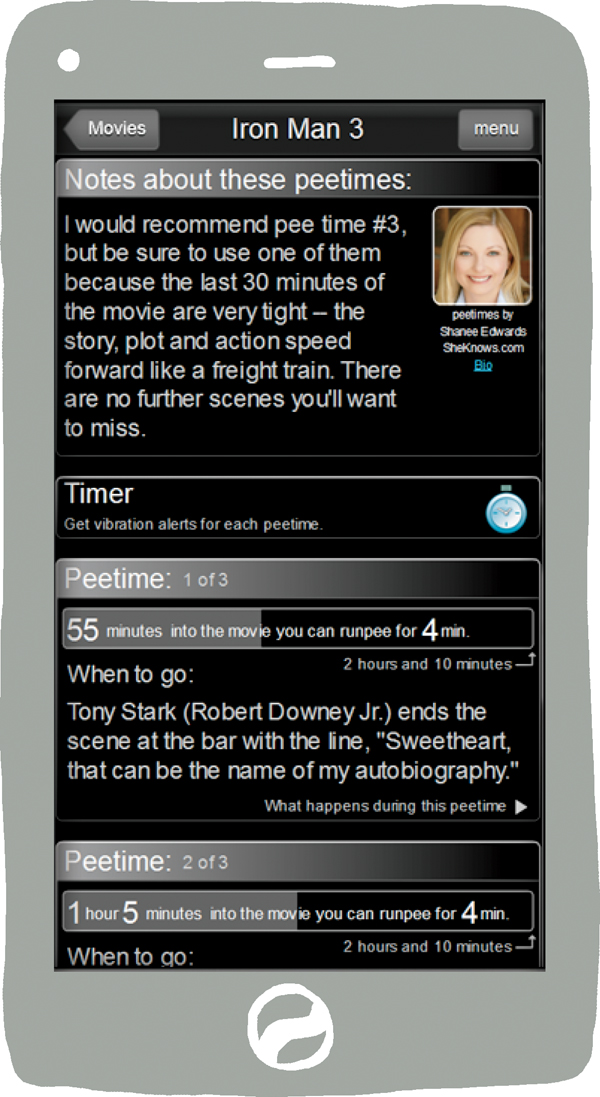
Spark Case Study: RunPee.com
In 2005, Dan Florio jumped out of his theater seat as the credits rolled. He had just spent over three hours watching Peter Jackson’s movie King Kong, and spent the last 20 minutes of it urgently wishing that the ape would just die. Boy, did he have to pee.
As he passed the line of people waiting for the next showing, clutching their 64 oz. drinks, he wished he could tell them about a specific long, less-important scene in the middle of the movie. It was a perfect time to go pee, without missing anything they’d regret.
From this moment of urgent need and empathy for those people in line, Dan had a Spark. How might he remove the bad in watching movies in the theater? The bad was a full bladder. The solution: Find and share the best times to go to the bathroom. RunPee was born.
RunPee is a website and mobile app that provides suggested peetimes for blockbuster theatrical movies. Dan, his mother, his sister, and a movie reviewer watch new releases on Thursday and Friday nights and note the 3- to 5-minute sections of scenes that are missable, so that those who need to GO can do so without anxiety.
Are the plot developments easily summed up and low on the emotional scale? Peetime. Is this one of three car chases in the movie, and the least interesting? Peetime. Lots of exposition for things that you may already know from the first movie of the series? Peetime.
Dan and his team write up notes for those missable minutes and provide them to you, so you can catch up if you’re using your phone during your short trip.
Dan recognized a need, felt empathy for others with that need, and proposed a solution that over 350,000 movie- (and restroom-) goers have used. The Solution Idea wasn’t enough on its own, though. The design of the solution was key.
How They Do It: Design and Content
Knowing that a bright mobile phone screen is not welcome in a dark movie theater, Dan designed the mobile app with a dark screen, and uses vibration to alert users to upcoming peetimes so they wouldn’t have to constantly look at their phone.
As for the peetimes, and content such as the notes themselves, Dan and his team realized something else early on - the peetime expertise they provide is hard to copy.
You see, Dan originally thought to make the peetime information crowdsourced - meaning that users of the app could submit peetimes that others could refine and validate. More movies could be covered that way. But Dan found that the quality of user-generated information just wasn’t high enough. He realized that there’s a craft to choosing a good peetime.
Small children may be more willing to miss plot points than to miss action sequences, for example. An adult may not mind skipping part of a long action sequence as long as she doesn’t miss major plot twists. Peetimes must be chosen wisely to have the right ones for the right movies and provide a good mix for different types of watchers.
Now, Dan and his team watch and enter all the movie information themselves. They realized that their understanding of the movie genre and audience is important to the value and quality of their solution.
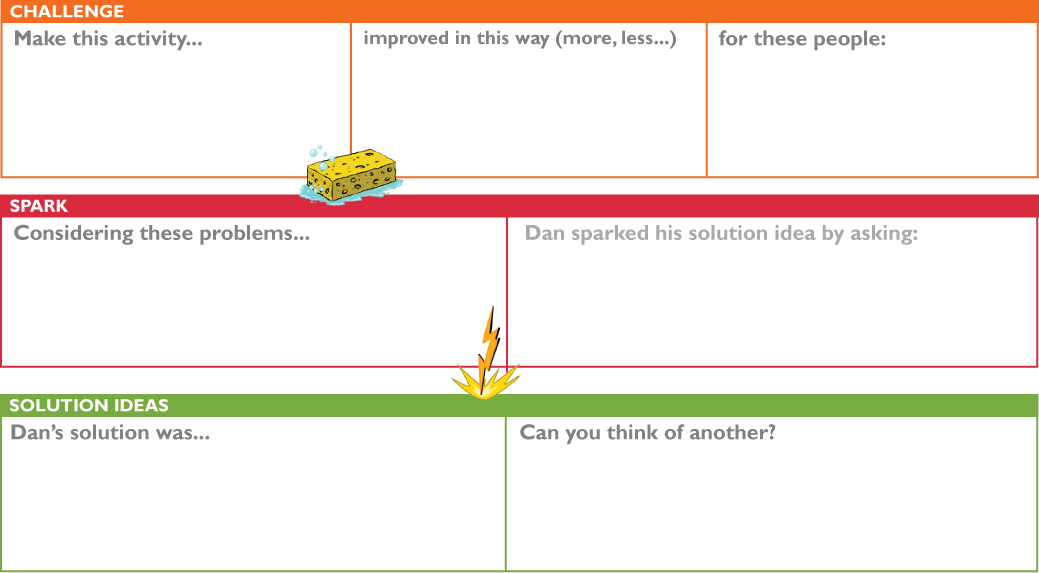
Activity: Striking a Spark
Using the case study you just read, fill out the rest of the Spark Frame below. Sketch if you’d like!
Exploring Solutions
In our RunPee example, Dan chose to solve his problem by creating a digital product. That’s a common type of solution, but it’s not the only one. Let’s use our dropoff problem from page 36 to illustrate different approaches.
Process solutions change the way people perform an activity. You could change the order of steps involved, add or remove steps, or change the timing. For example, maybe track practice could start earlier, or return to the gym for cooldown exercises to avoid the heaviest traffic.
People solutions add or subtract particular people or roles from a situation. Practice is over, so the track coach could act as a supervisor, temporarily rerouting traffic through the fire lane.
Product solutions add new products into the mix, which could be physical, digital, or both. (After all, digital products rely on a physical element, like a mobile phone.) This could include a bridge, catapult, digital signage, or something that tracks traffic patterns and sends an alert to an app when there’s a backup.
Context solutions add changes to elements in the environment, like walkways or signs. Sometimes these involve product or process solutions, but with the characteristic of being fixed to a particular place at a particular time.
Some of the best overall solutions consider more than one of these solution types, because they often impact each other.
For example, if you add a product like a digital sign, you’re affecting the context of the problem. What is the impact of that?
Also, if you decide to have the coach direct traffic, she may need a new process to help her determine when and how to direct the cars, and what to do if the fire lane is suddenly needed.

Activity: Striking a Spark
Try using different sparks for the dropoff problem on p. 35 (combined with sketch on p.36.) Come up with three to five solutions to improve the situation. Consider changes of context, people, process, and product (or a combo). Challenge your assumptions. For example, maybe every parent doesn’t need to drop off their own kid. Design a better carpooling process!
How might we amp up the good?

How might we use unexpected resources?

How might we challenge assumptions?

The SPARK Challenge!
For your final chapter challenge, Spark some Solution Ideas for the project you explored in the Sponge challenge. You can create a new Challenge statement, as long as you get out in the field to sponge up information about the people you’re designing for!
Use the two worksheets you’ll see next, fill out your Challenge and Spark, and try to generate at least three possible Solution Ideas. Then, create an infographic or poster that represents your proposal and highlights your favorite idea of the three. The infographic on the facing page was created by Sprk’d (sprk-d.com) to explain the value of infographics. We like to go meta!
When you’re done, you’ll have a nice sketched or digital infographic that tells the story of your proposed solution, and the reason it’s so important.
Level Up
If you’re completing these activities with a group, use your infographic as the basis of a pitch for your solution.
Choose an impartial judge who has to choose to invest in one of the pitches! He or she should listen to each pitch and determine which one to invest in (with an explanation as to why).

Activity: The Spark Frame
Fill out the Spark Frame below for your Challenge. You can fill out the Solution Ideas after brainstorming Sparks on the next page.

How might we amp up the good?

How might we remove the bad?

How might we use unexpected resources?

How might we challenge assumptions?

The Debrief
Are you proud of your poster?
It represents a lot of work and thoughtfulness! It’s easy to underestimate the effort that can go into a grounded Solution Idea.
Sometimes people generate ideas based on gut instinct, but often they don’t have the context to make a really great solution. If you just go with your gut, it can also be easy to ignore the positive results that come out of the existing situation and only focus on the negative. You want to keep the positive! (Or replace the positive with another kind of positive).
Now you not only have a great idea for something to design in the next step - you’ve also gained important context about the issue, insight into the people who encounter the problem you’re solving. All that AND the data to show how important it all is!

In the next chapter, we’ll talk about taking a solution idea and generating a lot of design concepts for it in a short period of time. This is called Splatter because at this point you should just get them up on the wall (or in your notebook) without judging them too quickly. Let’s mix the paints and get started!