
Chapter 11. Validating your architecture
In this chapter, you will learn about:
You have finally installed and started to set up your Microsoft SharePoint Server 2013 environment, but is it set up correctly? Is your farm functioning within your expectations? Are there hiccups in your network infrastructure? This chapter is about different methods for monitoring and stress-testing your SharePoint 2013 environment(s).
You want to make sure that your environment is ready to handle more than the group of test users and administrators by really taxing your environment and making sure that your SharePoint Server 2013 environment and applications are running on the correct ports. SharePoint is a very robust tool; it can handle a couple of hundred users without slowing down; the problem is that SharePoint can handle that workload even with imperfections on the back end. However, if you start increasing your farm utilization, the imperfections will start to have dire consequences on your farm, as your performance will decrease and potentially crash your environment. This chapter will help you find those issues before they happen and verify your architecture and your installation.
If you are upgrading from SharePoint Server 2010 to SharePoint Server 2013, you should have a spot-on idea of your farm load, and if you are doing a fresh installation of SharePoint Server 2013, you should have a rough idea of your user utilization. In your capacity planning, you should already have come up with the values for your farm metrics; if not, spend some time researching so that you have an idea of the values for your user utilization metrics before testing your environment. This chapter assumes that your Active Directory (AD) and ability to log on can handle your SharePoint traffic and is robust enough to handle the load and stress testing described in this chapter.
Verify farm contentment
You have installed SharePoint, opened up Central Administration, and created the required service applications. Everything seems to be working okay through the browser, but how can you be sure that everything is working behind the scenes? As discussed in Chapter 8, SharePoint Server 2013 outputs in a Unified Logging System (ULS) standardized format, which means that you can now use different methods to monitor your environment. In Chapter 9, you learned what to monitor on a daily basis to maintain a healthy farm, and that keeping up to date with your logs will help you achieve the goal of a happy and healthy farm. There are many ULS viewers available; this section explores one viewer to monitor your farm and one viewer to monitor your webpages.
Microsoft ULS Viewer
With the amount of data that gets written by SharePoint into its ULS logs, it is easy to miss errors, especially if you are running more than one SharePoint server. Try to minimize the amount of errors that you are receiving before putting your farm into production, and once your farm is in production, make sure that you stay ahead of the errors by monitoring your farm logs. The best way to validate that your farm is not outputting any errors is to review your farm’s ULS logs. One way to track errors in the ULS logs is to use Microsoft ULS Viewer (http://tinyurl.com/PCfromDC-ULS). ULS Viewer will allow you to do things like sort, filter, and highlight log entries based on what you are trying to accomplish. The added bonus is that you can monitor remote machines’ logs and open log files from multiple machines at the same time. To monitor log files from a remote machine, create a share for the root LOGS folder. The default folder location is located at
C:Program FilesCommon Filesmicrosoft sharedWeb Server Extensions15LOGS
Set the folder share for either the SharePoint Administrator account (spAdmin) or a specific security group (spAdmins) and assign the group read permissions. Do not share the folder with Everyone because you do not want to grant everyone access to your SharePoint servers. Remember to write down the share name, as it will be needed to set up the ULS Runtime Feed.
Another server that you can grab the ULS log files from would be your Microsoft Office Web Application Server 2012 (WAC server, formerly known as OWA). Enable sharing of the Logs folder as well, and its default folder location is
C:ProgramDataMicrosoftOfficeWebAppsDataLogs
Remember that the ProgramData folder is a hidden folder. In Windows Server 2012, enable viewing of hidden files and folders by going into File Explorer (formerly known as Windows Explorer), selecting View on the ribbon, and selecting Hidden Items from the Show/Hide section. Write down the share name, as it will be needed to set up the ULS Runtime Feed.
Setting up ULS Viewer
There are two options when it comes to where to install your ULS Viewer: locally on your client or somewhere on your server farm. You should install the ULS Viewer on your local client, not on any of your SharePoint farm servers. There is no reason to be logged on to your production environment if you do not have to be there.
This demonstration sets up the ULS Viewer in a Windows 8 Enterprise (x64) environment. ULS Viewer requires the “.NET Framework (includes .NET 2.0 and 3.0)” Windows feature to run. After granting read access to the ULS LOGS folders for your environment(s), and after installing the ULS Viewer, point the ULS Viewer at all the LOGS folders for your farm.
Start by Shift + right-clicking the ULS View icon and selecting Run As Different User (see Figure 11-1). Start the program as the user (hopefully the SharePoint Admin Account) that you gave the read-only permissions for the LOGS folders.

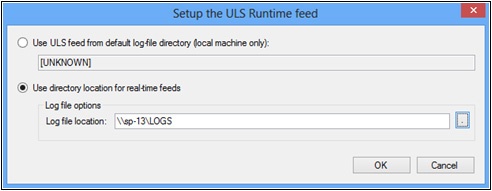
You are then going to start adding the ULS LOGS folder locations that you want to monitor (see Figure 11-2).

Put in the location of the LOGS folder into the Log File Location text box, as shown in Figure 11-3.
You should have one tab for each log file location entered.
As shown in Figure 11-4, select the level of severity of the messages that you wish to see for each server, enable the correlation tree, verify that you have the Show Notifications option turned on, and then save your workspace.

You can create several versions of workspaces to make it easier to track what is important to get your task completed.
The ULS Viewer from Microsoft is a fantastic tool to start the validation process of your installation through the tracking of critical errors. While some might be tempted to leave the viewer running all the time to find critical errors, it is best to just use the tool when needed.
Developer Dashboard
In SharePoint Server 2013, you now have the ability to monitor page load issues found within the ULS files through the use of the Developer Dashboard. The improved Developer Dashboard in SharePoint Server 2013 is a fantastic tool that now has several troubleshooting tabs on one page. As stated back in Chapter 9, the ULS Log tab displays the ULS log entries for the particular page, but there is also a SQL tab that shows you the SQL queries that SharePoint has performed for that request. If you are having page-loading issues, the Developer Dashboard is a great starting place for troubleshooting. Just make sure that you have the Usage And Health Data Collection Service application created. Once your farm is up and running, it is a good idea to enable your Developer Dashboard and log your baseline page load and SQL execution times. Over time, as your farm grows and as you customize your pages, you will need to know the impact that the new features added to your farm. Without baseline numbers, you will not have any clue as to what your branding has done to your page load times or what that change to SQL has affected. Let’s take a look at Figure 11-5 and Figure 11-6 and review some of the data returned.
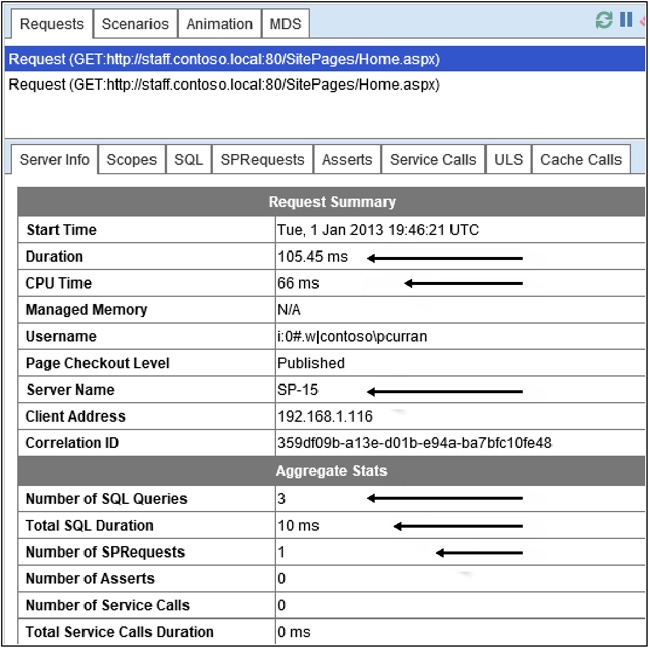

As you can see, the Requests tab in both Figure 11-5 and Figure 11-6 is requesting the same page. However, the page load times are different. Reading through the dashboard a bit more, notice that the pages are coming back from different servers. Even if these screenshots were from the same server, the timed duration would not be identical, so it is best to refresh the Figure 1-4 times or more to get a good average before you determine your estimated page load time. If these numbers were indicative of the mean page load time, then you would have a good starting location for troubleshooting why one server takes four times longer to load than the other.
Another thing that you should be aware of is that the times returned are measured in milliseconds (ms), which is equal to 1/1000 of a second (that is, .001 of 1 second). Before spending too much time on troubleshooting the issue of one server loading four times slower than another, you might want to justify why you are trying to solve a 3/10 of a second page load issue. Developer Dashboard will also help with the issue of users telling you that a page is “slow to load.” “Slow” is a subjective term, so the best way to determine the truth is to compare the actual page load measurements of the “slow” page to the baseline numbers that were first recorded when you stood up the farm.
Verifying port allocation and web requests
The ability to monitor your farm is important, but making sure that your web requests are going to the correct place on the correct port is just as crucial. For example, if one of the custom applications from the SharePoint App Store is not returning data or if you just want to verify that feeds within your webpage are accessing the data from the correct URL, then you will need a tool to capture your network traffic.
Fiddler
Having the ability to look at the captured HTTP(S) protocol is very important when trying to debug or troubleshoot SharePoint, as not everything is written into the ULS logs. One of the industry-standard tools is Fiddler (http://www.fiddler2.com), which is used to capture HTTP and HTTPS traffic and allows the user to review and even “fiddle” with the HTTP traffic as it is being sent. Fiddler currently has two versions. The first version, Fiddler2, is for machines that use .NET 2.x, and the second version, Fiddler4, is for machines that use .NET 4.x. The version that you download depends on the .NET version you have running on the machine that will be running Fiddler, not what .NET version SharePoint is running. You should not need to install this on a production server, but on your local client or on a server in your test farm.
Setting up Fiddler
If you are installing Fiddler on a Windows 8 client, you should download Fiddler4 from http://tinyurl.com/PCfromDC-Fiddler4. After downloading the program, run the installer as the Administrator, click Next a couple of times, and finally close out the installer; your default browser should pop up and tell you that your installation was successful.
There are add-ons that you can install for Fiddler to help with a variety of tasks. You can review the add-ons at http://tinyurl.com/PCfromDC-Extensions. With Windows 8, you have the ability to capture the app traffic as well, so make sure that if you are using Fiddler for only capturing your SharePoint HTTP traffic, keep the tracking of Windows 8 apps functionality disabled to keep your web session traffic capture as clean as possible.
Internet Explorer Developer Tools
Like Fiddler, Windows Internet Explorer Developer Tools (IE Dev Tools) is used to help debug webpages. With IE Dev Tools, you have the ability to read through, and even modify, the HTML and Cascading Style Sheets (CSS) of the page. While Fiddler is known for its network capturing ability, IE Dev Tools also has that ability.
From within Internet Explorer versions 8, 9, and 10, you can access IE Dev Tools by pressing F12. If you are still running earlier versions of Internet Explorer (either Internet Explorer 6 or Internet Explorer 7), you can download the IE Developer Toolbar from http://tinyurl.com/PCfromDC-DevToolBar.
You’ll learn more about how to utilize some of the functionality of IE Dev Tools in the Performance-testing your environment section later in this chapter.
Verifying Kerberos with Klist
You may believe that you have set up your delegation of authentication correctly, but because authentication happens behind the scenes, how can you be sure? With the release of Windows Server 2003, you had the ability to use a product named Kerbtray to help troubleshoot Kerberos tickets. Since Windows Server 2008, there is now the ability to use a built-in tool called Klist, and you can even access Klist from the command prompt in Windows 8. Klist is used to help manage the Kerberos ticket cache and will allow you to view and even delete (purge) all the Kerberos tickets for the specified logon session. You can read about Klist and its parameters at http://tinyurl.com/PCfromDC-Klist.
Klist will be utilized to help validate a Kerberos implementation in the Putting it all together section at the end of this chapter.
Inspecting your network packets
Why in the world would there be a section about network troubleshooting in a SharePoint book? The servers are talking, and the service accounts are authenticating, so it all must be working correctly, right? While SharePoint is a reliable product, there are standards that need to be met to make sure that your environment is running correctly. SharePoint requires a fast network, and your fast network will give a distributed SharePoint farm faster inter-server communications. This faster inter-server communication means that your clients have the ability to access their data faster. The speed of communication and return of data are especially important when you distribute your services across multiple servers or federate services from other farms. The network round trip between the client and server(s) has the single biggest impact on webpage performance and can have a larger impact than server response time.
There is significant traffic in a SharePoint farm across the web server tier, the application server tier, and the database server tier, and your network can easily become a bottleneck under heavy loads, especially if you are dealing with large files. Web servers and application servers should be configured to use at least two network interface cards (NICs)—using one NIC to handle user traffic and the other to handle the inter-server communications. Network latency between servers can have a significant effect on performance. Therefore, it is important to maintain a network latency that is equal to or less than 1 millisecond between the web server and the SQL Server–based computers hosting the content databases. Not only is it important, it is a requirement! The SQL Server-based computers that host each service application database should be as close as possible to the consuming application server, and don’t forget that there should be less than a 20-millisecond latency for your SQL Read/Write. The network between farm servers also requires that you use at least 1 Gbps of bandwidth for your NICs. The validation of 1-Gbps NICs, switches, and cable is pretty simple, but how can you be sure that the electrons are flowing fast enough? How can you be sure that the latency of your network is within specifications? It might not even be possible for you to have a latency of less than 1 millisecond or even ping other servers based on your switch configuration. Once you have exhausted the use of Fiddler, there are a couple of options to help you dive deeper into inspecting your network, as described in the following subsections.
Microsoft Network Monitor
One of the tools created by Microsoft to help you determine the health and speed of your network is called Microsoft Network Monitor (Netmon). The current version is 3.4 and was last published back in 2010. You can download version 3.4.2350 from http://tinyurl.com/PCfromDC-Netmon. There are add-ons available for Netmon, including Parser Profiles. Parser Profiles provide even more useful information about every packet because they are prebuilt profiles to help you set up Netmon for what you are trying to monitor. For example, you can download the Office and SharePoint Products Network Monitor Parsers to extend the functionality of Netmon by filtering packets based on the rules defined within the parser for Office and SharePoint. You can download the parser from http://tinyurl.com/PCfromDC-SPParser. Another fun add-on for Netmon is TCP Analyzer (http://tinyurl.com/PCfromDC-Analyzer), and for tracking heavy network traffic culprits there is Top Users Expert for Network Monitor (http://tinyurl.com/PCfromDC-TopUsers).
After you install Netmon, log off the machine and then log on again before you try to start capturing network packets using Netmon.
Microsoft Message Analyzer
Microsoft Message Analyzer (MMA) is the successor to Netmon. At the time this chapter was written, MMA was still in beta, and the Test Suite was at Beta 4.0.5494.0. You can download MMA from http://tinyurl.com/PCfromDC-MMA. MMA is a fantastic troubleshooting tool, not just for network traffic but for any kind of communication such as USB, Bluetooth, and wireless local area networks (LANs). Out of the box, you have the ability to monitor all network LAN traffic on your client or select the Web Proxy trace scenario and monitor only the web traffic.
Just like Netmon, after installing MMA, log off the machine and then log on again before attempting to start capturing packets.
Testing your environments
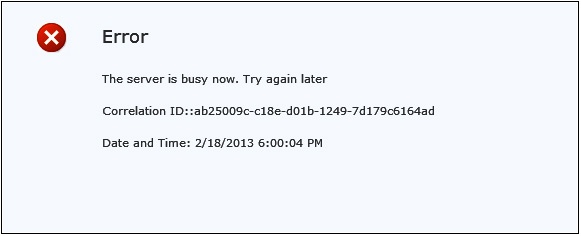
You have your farm set up, the user acceptance testing has gone swimmingly, and all that is left is for the Domain Name System (DNS) team to update the Host-A record to open your site to the world. Unfortunately, the marketing team put out a press release telling the world about your new site and offering a free $200 gift card to the first 100,000 visitors! Nobody likes to be caught off guard, especially by a phone call from the boss asking why, when he browses to his brand-new SharePoint environment, he keeps getting an error message that tells him that the server is busy and that he should try his request again later.
The servers that host your SharePoint farm are tools, and it is important to know the limitations of your tools so they don’t break when you need them the most. Maybe you have a service-level agreement (SLA) that requires your farm to handle 100,000 users simultaneously with a maximum page load time of 1 second or that the CPU percentage and RAM utilization is less than 85 percent when under maximum load. If you do not load-test your environment before going live, you have the potential to run into server failure issues without fully understanding why. Knowing that your farm can handle your day-to-day workload is not enough; you want to see what your environment can handle so that when you start to reach the threshold of your farm, you can add, expand, or upgrade hardware to handle the growth. You need to know the limitations of your environment because telling your boss, “Theoretically, the farm should be able to handle 200,000 simultaneous users,” should not be an acceptable statement at any organization. Having the ability to tell your boss, “Currently, the farm can handle 200,000 simultaneous users,” is great, and it’s even better if you know that you only have 10,000 people that hit your farm simultaneously. On the flip side, it is great to have that level of detailed farm knowledge, especially if you are expecting 500,000 simultaneous users, because you caught it before going live (however, you should probably review Chapter 3).
Inspecting your IIS logs
Knowing where you have been is critical to the understanding of where you are going. By looking through your existing Internet Information Service (IIS) logs (SharePoint or not), you can gather a lot of information required for testing your new environment (SharePoint or not). If you have logging enabled within IIS, then you will be able to come up with actual numbers for your load- and stress-testing scenarios. As shown in Figure 11-7, you can validate IIS logging or start your IIS logging by going to the web server that is hosting IIS, selecting the server name from the connections section, and selecting Logging under the IIS features.

If you have had your logging disabled, try to start collecting data for at least two weeks so that you can get a minimum set of site utilization statistics. Also, you might want to start researching why logging was turned off before you re-enable it. If IIS is handling a lot of traffic, your log storage might exceed your hard drive free space and cause other issues (possibly to the extent of taking down the server). Please use extreme caution when enabling your IIS logging.
To enable logging, with the Logging feature open (as in Figure 11-7), review the settings and browse to the IIS Logs Directory. The default directory is %SystemDrive%inetpublogsLogFiles; and, as shown in Figure 11-8, you will notice that when you browse to your log file directory, you will see one folder per IIS site (web application). Depending on which site’s information you are trying to gather, find the appropriate log file under the ID of the folder.

By adjusting your log files to be multiplexed into one log file per server, IIS log setup is another area of potential server resource savings. For example, if your IIS is hosting 20 web applications, the server is processing a lot of formatted information and writing it into 20 separate IIS site logs. By creating a centralized, server-based, unformatted binary log file, you will save on server resources because the service will have to write to only one file.
Microsoft Log Parser
Now that you have figured out where your logs are located and have seen that you actually have log files to review, what is an efficient way to comb through the data? Microsoft has created a program called Log Parser to help you solve that problem. At the time of writing this chapter, Log Parser is at version 2.2, and was published in April 2005. You can download Log Parser 2.2 from http://tinyurl.com/PCfromDC-LP22.
Log Parser is a powerful tool that can handle several types of input file formats, including:
Log files generated by IIS.
Text files such as XML, CSV, TSV, NCSA, and W3C.
Windows Event Logs.
NetMon capture files (.cap).
Custom objects. If you find that Log Parser cannot parse the information that you want to go through, you can create a custom input file format plug-in.
Running queries against log files that might have millions of records is a daunting task, and not something that you want your web server to manage along with the web traffic. So just like you did previously in the Setting up ULS Viewer section, you are going to share the IIS LogFiles folder with read-only permissions for the SharePoint administrator so that you can run Log Parser from your client desktop and not from the server.
While Log Parser is an invaluable tool, there are a couple of problems with using Log Parser. One problem is that Log Parser is a command-line executable, so there is no GUI. The second problem is that you need to be able to write SQL queries to return the data that you are interested in finding. For those of you who do not want to spend the day looking up queries on Bing and are tired of command-line operations, there is an add-on from the Exchange Gallery of Microsoft TechNet called Log Parser Studio (LPS). You can download LPS from http://tinyurl.com/PCfromDC-LPS. Once you have set up your folder share and you have installed Log Parser, you can install LPS.
Setting up LPS
With your LogFiles folder permissions set for only the SharePoint Administrator, Shift+ right-click the LPS icon and run LPS as the SP Admin. Once LPS opens up, familiarize yourself with the program layout (see Figure 11-9). Notice that there are 117 queries already created for you, along with descriptions and the actual query as well. This should be enough to help you create your own queries and add them to the library.

To start getting back information, assign a log file or folder to have LPS query against. Press Log Folder to open up the Log File Manager window. Next, add the folder and the files that you want to query. When you go to select a folder, you will actually have to select a file to open, but once you click Open, notice that the saved file is marked like all the files within the folder (see Figure 11-10).

Out of the box, LPS does not give you the ability to query how many requests are made per second, but there is an out-of-the-box query to return the number of requests per hour. Look for the IIS:Request Per Hour query, and double-click the row to open up the query window, as shown in Figure 11-11.

After you run the query, the number of requests per hour for that site will be displayed. Click the green arrow to export the .csv file so that you can work with the numbers in Microsoft Excel. To get the number of requests per second (RPS), you take your total amount of requests for the hour and divide by 3,600. Another important thing to keep in mind is that if you have a network load balancer (NLB), and your total requests per hour are dramatically different for each web server, then you have some research to do into why your NLB is not distributing calls evenly.
Performance-testing your environment
Performance testing is used to help make the user experience better. Performance testing is done to reduce bottlenecks and establish your baseline numbers for future testing. Without performance testing and recording baseline values, how do you know if your site is running slow or if the page load times have degraded over time or degraded after the last branding enhancement? Running performance tests, and then finding and fixing any bottlenecks prior to going live, will help reduce the chance of accidentally tarnishing your corporation’s web presence. Not having your bottlenecks addressed in the performance testing stage will become evident as you go through load testing and stress testing.
Performance-testing your environment is not an activity that should be taken lightly. You should put as much time as required into preparing for your testing, and not just rush ahead to get to the pretty graphs at the end. To create a valid performance test for your environment, you must know how your organization uses SharePoint. You will probably create several performance tests based on your user utilization (also known as a Transactional Mix) to help with finding bottlenecks and pain points for the users.
Creating your test plan
There are lots of questions that will need to be answered and a lot of work that will need to be done before moving on to load testing. As with any plan, you should know ahead of time what your goal for testing is going to be. You should understand the objectives and how to reach them consistently and reliably. If you create a test plan and cannot re-create the results, then you do not have a valid test plan. Your tests need to be reliable, consistent, and repeatable.
What is your objective? If your objective is to measure throughput capacity, then pay close attention to the RPS and page latency. If you are testing search performance, you might be looking at your crawl times and indexing rates. If you want to measure hardware performance, you might look at % Processor Time and RAM utilization. If you are testing pages that have custom code, conduct your performance testing of the code in isolation before bringing it into SharePoint for testing. After your isolation testing, compare the performance of how well your custom code worked in isolation compared to how your code ran within SharePoint. You really need to know and understand your objective so that you can create a valid test model before starting your performance testing, especially if you are planning on conducting load testing as well.
After you have determined the metrics that will tell you if your performance is acceptable, and you have completed a metrics table that also tells you what is marginal and what is not acceptable, it is time to start doing performance tests.
The odds are good that you are interested in creating an environment that loads a webpage quickly, uploads documents quickly, and allows you and your users to view documents quickly. To help with determining the baseline numbers, there is a tool created by Microsoft called Visual Round Trip Analyzer (VRTA). This is another tool that was built upon Netmon (previously discussed in the Microsoft Network Monitor section) and is downloadable from http://tinyurl.com/PCfromDC-MSVRTA.
The VRTA helps you visualize the download of webpages and identify best practices, and it will even recommend changes to your environment that will help improve web performance. VRTA examines the communications protocol, identifies the causes of excessive round trips, and recommends solutions.
Test your environment over a variety of scenarios. For example, you might test the following:
Cold page load (uncached, first page load of the day), as shown in Figure 11-12
Fresh page load (uncached, browser closed then opened), as shown in Figure 11-13
Refreshed page load (cached), as shown in Figure 11-14
Refreshed page load (browser cache cleared), as shown in Figure 11-15


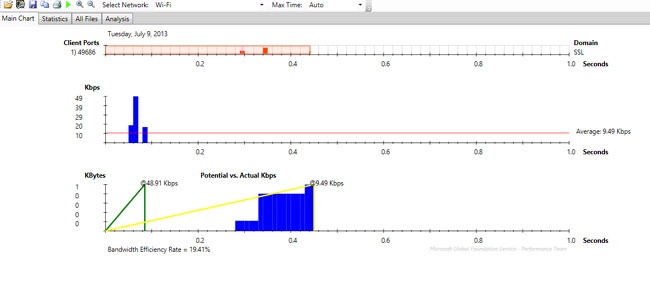

The things that you should notice are not just the load times, but also the bandwidth efficiency and how many different items and item types (different colors) are being loaded. After you have your data captured, you can click the Analysis tab and have VRTA tell you how to improve your performance.
One way to clean up your environment and increase the performance of your pages is to look at your network’s bandwidth efficiency. Another way to improve your performance is to look at how you have your CSS files, JavaScript files, and image files loading. To track down your speed issues, you should consider using IE Dev Tools. You can use these tools to create a waterfall presentation of your network traffic and troubleshoot your performance issues. With IE Dev Tools, you are going to focus on page loads after your browser cache has been cleared and page loads when you refresh a page.
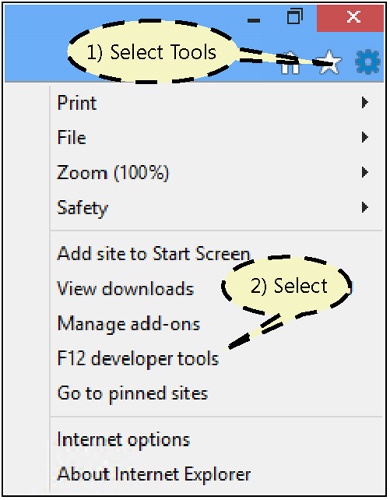
As shown in Figure 11-16, there are two ways to get to your IE Dev Tools: either by pressing F12 or selecting Tools (Alt + x) | Developer Tools.
Next, as shown in Figure 11-17, select Network | Start Capturing. Once you are capturing your network traffic, either go to one of your pages or refresh a page that you have open. When your page starts to load, the summary waterfall will start to appear.
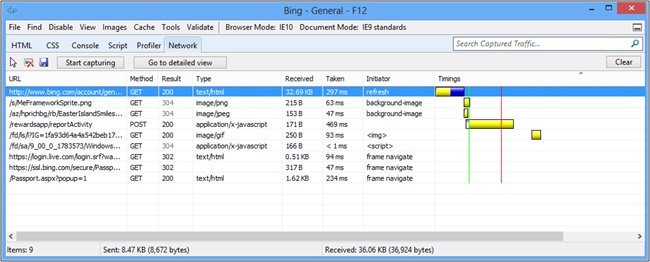
There is a ton of information on this chart. You can see that this page load has 13 items downloaded, and that Bing.com was sent 9.8 KB of data and in return received 32.6 KB of information. For each item requested, you have the ability to look at the URL and view the method used for the request (GET, POST, PUT, and so on), the size of the item received, and how long the item took to download. Understanding the protocols for the results will help you improve your performance. Table 11-1 shows three result codes as defined by W3.org.
Code | Title | Meaning |
200 | OK | Request has succeeded |
302 | Found | The requested resource resides temporarily under a different Uniform Resource Identifier (URI). Because the redirection might be altered on occasion, the client should continue to use the Request-URI for future requests. This response is only cacheable if indicated by a Cache-Control or Expires header field. |
304 | Not Modified | If the client has performed a conditional GET request and access is allowed, but the document has not been modified, the server should respond with this status code. |
You can read through all of the status code definitions by going to http://tinyurl.com/PCfromDC-w3.
It is important to understand the codes returned because you need to know how your requests are getting returned. If your branding team has decided to change your site’s look and feel, and you get bombarded with complaints about how slow things have become, you should know why. You do not want your branding team to say that your environment cannot handle their modifications, when the problem is actually the 30 JavaScript calls that they added.
To drill down into the network information a bit further, double-click the top URL, which should be the URL of the page that you requested. If you click the Timings tab, as shown in Figure 11-18, you should see the detailed view of the page request for the URL.
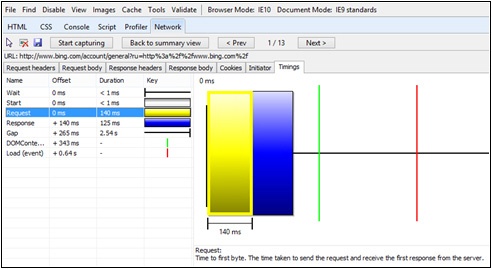
Every request that you send has a standard set of processes that it goes through, as shown in Figure 11-19 and described in the following list. The Timings window will be a very useful tool when you are trying to fine-tune your page load performance.
Wait. This is the amount of time spent in a sending queue. There are only so many connections allowed by a browser into one domain at the same time.
Start. This is the amount of time it took to create the request and send it.
Request. Also known as time to first byte, this is the amount of time from when you send the request to when the first byte is returned by the web server.
Response. This is the time taken to receive the response data from the server. It would be the time from the first byte returned to the last byte of the web server response to your request.
Gap. This is a critical number. It is the amount of time between the response and when the page is finished loading.
DOMContentLoaded This is represented by a green vertical line. The DOMContentLoaded event is the same as document.interactive, which means that JavaScript can now run on the page. DOM stands for Document Object Model, which w3 defines as follows:
“...platform- and language-neutral interface that will allow programs and scripts to dynamically access and update the content, structure, and style of documents. The document can be further processed and the results of that processing can be incorporated back into the presented page.”
Load. Represented by a red vertical line, load is the amount of time taken to finish your page load from start to finish.
It is possible to have items loaded, or deferred until after the page load, which means that the client can interact with the page while objects are still being loaded. If you want to see an excellent example of how Microsoft cleaned up their files on page load for their SharePoint.Microsoft.com site, read “How we did it: Speeding up SharePoint.Microsoft.com” at http://tinyurl.com/PCfromDC-spPerformance. This blog post was written by Tony Tai when he was the senior product manager for SharePoint Server.
Remember that performance testing is not just about your page layouts and design. You could have NLB issues, improperly set-up NIC teaming, or a bad switch that could impede page response time as well. Another way to increase performance would be to enable Kerberos authentication. This would help by reducing the amount of network traffic used for authentication and by reducing the number of times users get authenticated down to one.
Load-testing your environment
While performance testing affects your clients’ experience, load testing is mostly done to see how your clients’ experience will affect your server operations. Load testing is done to find the highest level of utilization that a system can handle and still function properly without error, while still maintaining the standards that you established in your acceptable response time matrix.
For example, if 1,000 users hit your home page at the same time, a page load time of 2.5 seconds or less is acceptable, while anything over 3.5 seconds is a failure. Another example would be when there are 200 requests per second, an average CPU percentage utilization of less than 75 percent is acceptable, while spikes over 90 percent utilization for more than 30 seconds are not acceptable. From a load-testing scenario, start your testing at a basic level and keep increasing the number of users and simultaneous requests until you have reached an acceptable threshold, and keep the load test running for a period of time to really hammer your servers. The top-level threshold should be for a given period of time. If you are not likely to be hit by 50,000 simultaneous requests per second for 48 hours straight, don’t test for it. You should make your load test as close to real life as possible. Load- and stress-testing your environment beyond what your farm is designed to handle can do real damage to your environment, so do not test for 50,000 simultaneous users when your environment is not designed for it—especially if your environment will only ever see 1,000 simultaneous users.
Test environment options
When it comes to building out your test environment, the first thing to determine is the type of environment that you want to create. If you will be testing a brand-new SharePoint Server 2013 environment that has not been signed off and approved to go live, then you are probably only looking to build out a client test machine and a load agent. If you are trying to test the performance of your current live production farm, consider creating a duplicate farm to run your tests against. You will not get good baseline numbers from a live production farm if there are fluctuations in simultaneous requests to the server that you are testing, and if you do take down your farm or destroy a server, you do not want to do it to your live production environment.
There are three common types of environments used in on-premises testing web servers. One environment runs everything off one client, as illustrated in Figure 11-19.

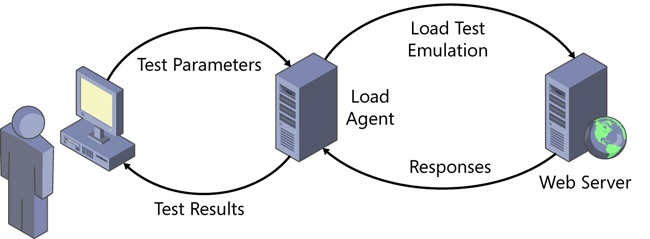
The other two environments separate the load agent from the client. This is done because you might have more than one load tester or because you have only one server with enough RAM and CPU processing power to handle load testing. It may also be the case that your client does not have the hardware required to run the load test scenario successfully, as shown in Figure 11-20.
By separating the load agent from the client, it also affords you the opportunity to run multiple load agents to help load-test your environment, as shown in Figure 11-21. Eventually, after you scale out your load test, you will run into a simulated user threshold for each load agent, and you will need to add another load agent to help with your simulation. You do not want your load agent to become a bottleneck for your testing environment. Your load agent should not exceed 75 percent CPU utilization, and you should not go below 10 percent availability of your physical RAM.

Setting your load test standards
The first steps for creating your load test are to understand what you are trying to accomplish and how you are going to accomplish it, and know what results are acceptable or not. The goal for a load test is to find out the number of users that your environment can handle while they perform everyday normal activities, with enough headroom for service applications of SharePoint to do their job without causing errors within the farm. To help accomplish this goal, you will need to understand the following terms:
RPS. The number of requests received by a farm or web server in 1 second. RPS is an industry standard used for determining server and farm utilization and load.
Total user count. The maximum number of people who are accessing your site. This number could be the total number of unique users in AD.
Peak concurrent user percentage. What the highest percentage of total users actively surfing your site at any given time. This could be when everyone gets in on Monday, after having coffee....
Green zone. The performance envelope that your servers should be within while load tests are underway, or during normal business utilization.
Server Latency (Avg. Response Time): < 0.5 second.
CPU Utilization (% Processor Time): 50 percent or less. This will allow for spikes in the farm caused by services such as Search Crawls and User Profile Synchronization and leave you enough headroom in CPU utilization before you enter the red zone.
Available Memory (Available Mbytes): > 4 GB.
Red zone. The acceptable peak for system performance. This is an area that your server can spike into momentarily, as to not create an adverse experience for the user or do permanent damage to the server itself. (Yes, this is a bit overly dramatic, but consider yourself warned.)
Server Latency (Avg. Response Time): > 1.0 second.
CPU Utilization (% Processor Time): 75 percent or less.
Available Memory (Available Mbytes): < 2 GB.
Average Page Load Time (Avg. Page Time): > 3.0 seconds
Next, you need to take a look at real numbers for how you are going to load-test your environment. If you already have an environment, pull out real numbers by using Log Parser, as discussed in the Inspecting your IIS logs section earlier in this chapter. If you do not have an established environment, there are some best-guess ratios that you can use so long as you know the number of users that will be using your SharePoint farm.
Determining your farm’s capacity
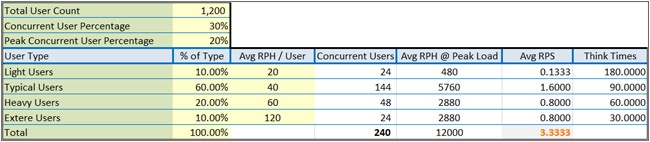
By now, you should have a farm deployed and be ready to test to see if your theory and reality for farm load are anywhere close to being equal. SharePoint is a powerful tool, and the improvements within SharePoint Server 2013 to handle requests make SharePoint a resourceful tool that can handle more than you would expect. The question is, “How much can my farm really handle?” Figure 11-22 is an example of user utilization profiles. The chart shows how you can determine a rough estimate of the minimum RPS that your environment will need to be able to handle while staying within the green zone.

Knowing your estimated user count and peak percentage will allow you to determine how many users will be making requests, while knowing the estimated requests per hour for each user will help you determine an estimated RPS at your farm’s maximum load. It is very important to know your minimum RPS figure so that you will know if you pass or fail your load test. Odds are good that you will not hit your average RPS number during your load testing, so it will be important to be able to figure out exactly how many users your farm can actually support. As shown in Figure 11-23, your farm not only needs to be able to handle your users, but also handle the SharePoint requests as well.

After you run your load test, you will be shown the average RPS that actually occurred. This number will never be the same as the one from the RPS worksheet because SharePoint makes its own requests to web services, such as the farm topology service, to get information about the rest of the farm before displaying content. So your RPS will not only vary depending on what you are trying to accomplish with your load test, but also depending on your distributed cache and your request management service.
You can download the RPS worksheet from http://tinyurl.com/PCfromDC-RPSWS.
Setting up Visual Studio Ultimate 2012
There are several tools available to conduct load tests, including web-based companies that you can use to hit your external sites. Most of these tests will work to provide your RPS and page load times but will not be able to tell you if your servers are running in the green zone or how close you are to exceeding your farm’s capacity to even respond to requests. Microsoft Visual Studio Ultimate 2012 is built with presets to inspect your servers based on the server functionality in your farm. Not enough organizations have Visual Studio Ultimate as a resource, so to show your bosses a demonstration of how amazing the product is, you can download a test version from http://tinyurl.com/PCfromDC-VS2012. Also, be sure to install any updates associated with Visual Studio 2012. If you are not notified automatically about available updates, you can download update 1 (KB2707250) from http://tinyurl.com/PCfromDC-SP1, and don’t be surprised if there is a second update available by the time you read this paragraph.
The first step after downloading Visual Studio is to install the program. For most administrators and/or architects who have never touched a bit of code in Visual Studio, installation might be a bit intimidating. Don’t worry, you will click Next a bunch of times, clear a bunch of check boxes, go get a cup of coffee, and you will be done (probably after you are done with your coffee). In this installation walkthrough, Visual Studio was installed from the downloaded .iso file.
After starting your installation, you will be greeted by a warm contractual warning and a couple of check boxes. If you are using the free download trial version, consider sending the Customer Experience Improvement Program a bit of usage information. If you are doing a demonstration on a client’s environment, that is their choice, and it is safer for you to not check this option and simply click Next when you are ready to continue. In the next window, if you are only going to be doing testing on your environment and not any coding, you can clear all of the optional feature boxes, or clear the Select All check box, and then click Install.
After you have completed the installation of Visual Studio and the installation of the updates, it will be time to start VS and begin creating a Visual Studio load test project.
From the Visual Studio Start Page, create a New Project, as shown in Figure 11-24.

Once you click the New Project link, a New Project window will open, as shown in Figure 11-25. You are going to create a Web Performance project.

Creating your Performance Web Test
Your load test will encompass many moving parts. The first thing you are going to create is a Performance Web Test (.webtest file). This file is the actual script that Visual Studio will use when it runs the load test. It is usually very easy to create a .webtest file, as all you have to do is click around within your website using Internet Explorer, and perform the functions that you want to test. By default, when you create your Visual Studio Project, a WebTest1.webtest file will be created and opened for you to start your script. For example, you might want to test Search by actually doing a search, or clicking around within your top-level site to test site functionality and response, upload a document that starts a workflow, or view a Microsoft Word document with your WAC server. You can create test sections that will not just test your farm, but are created to test different parts within SharePoint itself. Another test that should be tried, especially before you consider yourself finished with testing, is that you should start a full crawl and user profile synchronization while you are load-testing, and eventually, while you are stress-testing, your environment.
Before starting the creation of your Performance Web Test script, think about what you actually want to test. Once you think you know what you want to do, type your ideas into a spreadsheet and adjust as necessary. If you are going to be testing the upload of files, especially large files such as videos, create a script to back up your content databases and a script to restore your content databases after you have completed your test. You always want to have your test bed be exactly the same for each run of your testing; otherwise, you will never get valid results.
After you have documented your test, open up your Visual Studio solution and open your .webtest file. After opening the file, press Record, which should open Internet Explorer, as shown in Figure 11-26. You are now going to create the web test that the load test will use to see how many RPS your farm can handle. To keep the math simple, to help determine the number of RPS, this test is going to create a web test that is going to make only one page request.

When you have completed recording your Performance Web Test, Visual Studio will run a test to make sure that your Performance Web Test parameters are actually valid. When Visual Studio has compiled your performance test, delete everything that is not a request to a URL. That means, for this example, keep only the requests to .aspx pages. For other testing scenarios, there may be a need to keep other requests, like client object model calls.
If your web test is failing, double-clicking within the Error Message cell will open a new WebTest tab and Visual Studio will execute your .webtest solution. This will show you where your web test has failed so that you can go back into your .webtest solution and fix the outstanding problems. After you have fixed all the failing issues, your test results should show Passed, similar to Figure 11-27. Save your web test and rename the WebTest1 to something more useful.

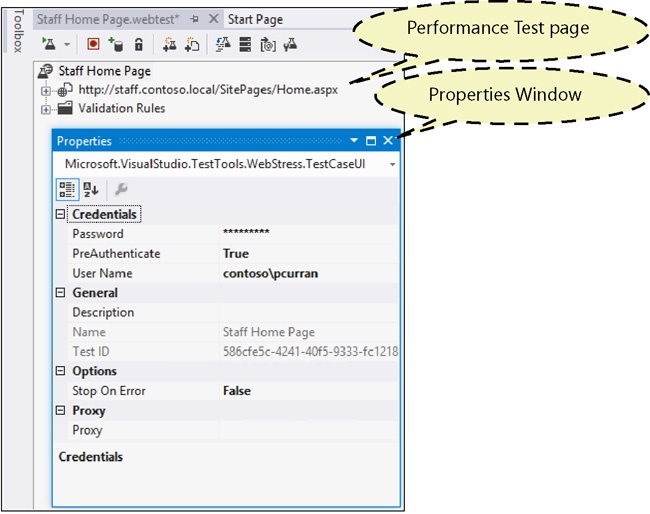
Once all the issues have been verified as resolved and you have changed the Performance Web Test name, it is a good idea to give your performance test one last run because you will be using your performance test in your load test. As shown in Figure 11-28, after you select the properties of the Performance Web Test, you can add a specific user to impersonate while running the web test.
Creating a valid performance test is the foundation for your load testing and stress testing. If you do not create a performance test that matches how your organization or clients will be using their farm, then you are not testing for a valid scenario and your load and stress testing will not be accurate representations of the real load. You must know how the farm will be used and what people will be doing to access their information to help you build out successful performance-, load-, and stress-testing plans. There is more on this topic in the Putting it all together section at the end of this chapter.
Creating your load test
After completing the build of your performance test, you can now build your load test. The load test solution will allow you to set various parameters to test in your environment, such as the number of simultaneous users and what servers to monitor. Remember that the purpose of the load test is to determine the RPS that your environment can handle while staying within the green zone, of how many RPS your environment can handle before entering the red zone.
Based off the RPS requirements from the RPS worksheet, you are going to copy and paste the Performance Web Test that you created three times and rename each one based on the nomenclature in the Excel document. Your Solution Explorer should look similar to Figure 11-29.

Next, add a new load test solution to the project. To create an empty load test, choose Add Load Test from the Project menu, as shown in Figure 11-30.

From here, the New Load Test Wizard opens to help you with creating your load test. Click Next to start the fun!
In the second screen (shown in Figure 11-31), the wizard will ask you for a load test scenario name and to select the Think Time Profile. This test is going to use the Do Not Use Think Times option. The think time is the amount of time the Visual Studio will use to pause between requests; for example, after your home page loads, this is the amount of time you spend thinking about where to click next. A zero think time maximizes the RPS for your performance test; think of it as a potential self-inflicted denial of service attack. This is another reason why you do not want to do load testing on a live production environment.

In the next window, where you determine the Load Pattern, this test is going to use a Constant Load of 1 concurrent user (see Figure 11-32). As you will see shortly, your one virtual user is going to be a very busy person. This is a workaround to the limits of using the demo version of Visual Studio 2012 Ultimate, which can have only up to 25 concurrent users. There is a demonstration of how to do a load test for more than 25 concurrent users in the Putting it all together section at the end of this chapter.
The next window (shown in Figure 11-33) allows you to select the Test Mix Model, meaning how you want your performance test to run. The first test mix model is a test mix based on the total number of tests for each virtual user. For example, you could create performance tests based on specific job functions and then assign a utilization percentage for that test. If the project management team spends 20 percent of their time uploading documents, 50 percent of their time updating lists, and 30 percent of their time reviewing dashboards, then you would create three separate performance tests (one test for uploading documents, one test for updating lists, and a final test for going between dashboard pages). This test model would be used when you are basing your test mix on transaction percentages from IIS logs. The second test mix model, based on the number of virtual users, would be used when you are basing the load test on the percentage of users running a specific test. The third type of test mix model is the Based On User Pace test mix model. This model will allow you to perform specific tests for a specific number of requests per hour until the load test is complete. The final test mix allows you to have the users conduct their performance tests in a specific order.


The next page is the Test Mix page. The test mix allows you to select the performance tests that you have already created for your load test. This demonstration will be using the tests created in the previous section, Creating your Performance Web Test. Refer to your RPS worksheet once again to determine the numbers that you will need to enter.
Click Add, select your test from the Available Tests section, and move it to the Selected Tests section, as shown in Figure 11-34.

After you have added your tests to the Test Mix, enter how many requests per hour each type of user will require. As shown in Figure 11-35, take the values from the RPS worksheet and enter them into Visual Studio.

Basically, this test consists of having one virtual user make a request to the Staff home page 36,000 times an hour.
For the Network Mix (see Figure 11-36), select the appropriate network that your users will be employing to surf to your web server(s). You have the option to distribute the network load between different types of networks, in case your environment is used by remote offices on a T1 line and mobile users along with your local network users. If you are going to do any testing outside of LAN network testing, Network Emulation will have to be configured. You can read about how to set up Network Emulation in the article “How to: Configure Network Emulation Using Test Settings in Visual Studio,” at http://tinyurl.com/PCfromDC-Emulation.

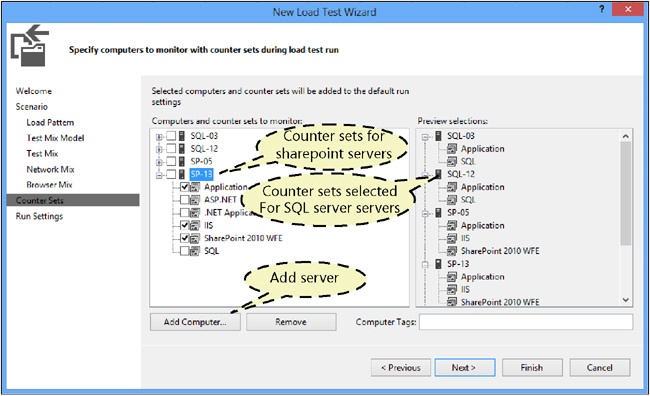
The next window for setting your Browser Mix (shown in Figure 11-37) should be pretty self-explanatory, especially after filling out your Network Mix. However, setting up the Counter Sets window is a bit trickier. The Counter Sets window is where you add all the servers that you want to monitor during the load test. If you do not have all of the Visual Studio updates installed, you will not have the same options available to you as presented here. By default, you will see only the local machine groupings of Controllers and Agents in the Preview section. For this example, you want to monitor the effects of the load on the servers in your SharePoint farm, and if you were doing a simulation that passed actual user names and passwords, you would want to monitor your authentication servers as well. To start, you will need the server names of the servers in your farm. Click the Add Computer button on the bottom of the monitor window to add a computer, and then add a SQL Server server name. There are predefined counter sets to monitor your servers. Select SQL, and because SQL is an application server, select Application as well. Continue to add all your SQL servers in the same manner. After you have added your SQL Server servers, add all your SharePoint servers. For the SharePoint servers, select the SharePoint 2010 WFE counter set because the counter set contains prebuilt filters to monitor specific criteria within SharePoint. Also, select IIS and Application counter sets because SharePoint servers use both of those server roles. Click Next to continue.
This test is going to be timed. If you have not run through your site(s) using your performance test multiple times, and you are worried that your pages might return slowly, you would set the warm-up test duration to something that would allow your script to hit all of your webpages so that everything is ready for the load test. A warm-up test would also be a good idea if you want to bring up your CPU temperature slowly for the load test so that you do not shock the system too much, but primarily you add a warm-up test to load components into cache and memory before the actual test starts. A 5-minute warm-up time is usually a good starting point for most load tests.
In the Run Settings window (shown in Figure 11-38), set your Run Duration to 20 minutes. A 20-minute run time gives Visual Studio enough sampling data points of your environment, and running tests over 20 minutes will not provide any worthwhile changes to your test data. So don’t waste your time—keep your load tests to 20 minutes.

After you have finished filling out your time parameters, click Finish to complete your load test solution. After clicking Finish, the Load Test tab should open. Now it is a good idea to go into your Solution Explorer and rename the LoadTest1.loadtest file to something a bit more practical and descriptive.
At this point, you can go ahead and click Start Test to begin your new load test, but you have not set your green and red zone thresholds. You should have your green and red zone limits already documented, so take your thresholds and put them into the Counter Sets so that you will receive a notification when you have breached a threshold.
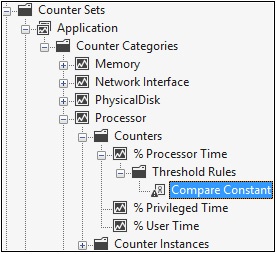
The first threshold to set up will be the availability of RAM. Since you have added the Application type counter set to all the servers, modifying only the Available MBytes within the Memory counter category of the Application counter set (as shown in Figure 11-39) will set a rule that will be monitored for all the servers. Expand the tree to get to the Compare Constant that has already been created. Right-click Compare Constant and select Properties to set the Threshold Values. Set the alert so that you will be notified when the data point goes under your available memory threshold numbers, so keep the value of the Alert If Over set to False, and set your Critical Threshold Value to your red zone threshold value. Set the Warning Threshold Value to the upper end of your green zone threshold value.

After setting up your memory thresholds and warning, follow the same procedures for the Server Latency (Avg. Response Time), CPU Utilization (% Processor Time, as shown in see Figure 11-40), and Average Page Load Time (Avg. Page Time).
The settings for % Processor Time and Available MBytes have threshold rules by default. To create the threshold rules for Avg. Response Time and Avg. Page Time, right-click the appropriate counter, as shown in Figure 11-41, and select Add Threshold Rule. Set the Compare Constant values to the appropriate threshold value. The option to use Compare Counters is used when you want to compare the current counter against other performance counter values.

Now that you have set up parameters for your test, it is time to run your load test. While the load test is running, remember that eventually you will want to kick off a search crawl and start a User Profile Service (UPS) synchronization. While you are load-testing your farm, open an Internet browser and take a look at the sites for yourself. Open Developer Dashboard (this will take up CPU utilization), and the other tools mentioned earlier in the chapter and see for yourself what your load test does to the performance of your farm. Once your load test is complete, address the errors that were found and then run the test again. If you are running the test with an NLB, make sure that there is actually a balanced load between all your web servers. As you review the test results of this demonstration, notice that the farm had an RPS of approximately 25.5 (see Figure 11-42).

Taking a look at the results, the RPS is equal to 25.5, while according to the RPS worksheet, there should have only been 10. As previously depicted in Figure 11-23, while the load test is going on, SharePoint is making its own requests as well, and over the period, SharePoint increased the RPS by 150 percent.
After completing the load test, it will be time to draw up the plans for how to attack the reallocation of your server resources. In a physical world, you will not be able to do too much when it comes to adding processors, but there is always the option of adding web servers or an NLB to help distribute the workload. One thing to be aware of while testing with multiple web servers that are load balanced is that depending on how you have the Affinity of the NLB cluster set up, your load test might hit only one of your web servers. To get around this, you can either change the settings of your NLB or create a Performance Web Test that uses server names instead of URLs. There is more information on load testing in the Putting it all together section at the end of this chapter.
Stress-testing your environment
At this point, you have maximized your throughput and reduced your bottlenecks with performance testing. You have established green zone threshold values and know what utilization your farm can sustain without error by doing load testing. Now here comes the fun part! It’s time to determine where things break. Remember that this is not dealing with your ordinary .NET IIS website. You are required to run with at least 12 GB of RAM and at least 4 CPU cores for a reason, and it is because SharePoint is so much more than an ordinary IIS website. Having such high hardware requirements makes for a very robust farm and makes it very difficult to break.
The purpose of stress testing is to try to overwhelm the server farm resources (or even the network or NLB). This type of stress testing is also known as negative testing. The major point to understand about stress-testing your environment is that is not just about knowing where things break, but how they will break and how they will recover. Having the knowledge that if you exceed your farm’s threshold, that the NLB will need to be physically unplugged and reset to get it to start working properly again is very important. Will exceeding the threshold of your farm create a nice message window, or will you have a catastrophic failure? Knowing what will happen on the negative or destructive side is necessary, but also knowing how your farm will recover is just as important—especially if your farm does not recover and requires a reboot to start functioning again. It is better to have an understanding of your farm’s nuances and document the solutions on how to recover from issues before going live, then after everything has shut down.
Through stress testing, think about where you want your environment to fail first. During stress testing, as different parts of your environment fail—such as your web server’s lack of ability to respond to web requests or your SQL Server’s inability to handle the input/output (IOPs) requirements from your web servers—then you will have to address different solutions. If you are having issues with recovery, attack this area of testing first.
Creating your stress test
You have already determined your red and green zone envelopes, so you know where your farm is happiest. Now slowly increase the load on your environment until parts of your environment start to fail (see the example in Figure 11-43).
In the Creating your Performance Web Test section earlier in this chapter, you created a web test for conducting your load test. For the sake of consistency, you are going to use the same Performance Web Test for your stress test as well, but instead of using one concurrent user, you are going to add users to the test until your environment is stressed beyond capacity.
Just like before, you are going to create a new Load Test Project (Project | Add Load Test). Once the New Load Test Wizard has opened, click Next. Give your scenario a useful name, and select Do Not Use Think Times.
Now this is where things will start to differ from the creation of your load test in the previous section. Because this demonstration is using the demo version of Visual Studio 2012 Ultimate, you can have a maximum of only 25 concurrent users. This is fine because you did your stress test using only one, very busy, concurrent user. The problem with this method is that you are doubling your RPS for every user added, so adjust the requests per hour accordingly in the Test Mix window. As shown in Figure 11-44, this example will increase the load on the servers by 10 percent every 2 minutes to a maximum of 25 users or a 250 percent increase in RPS.

In the next window (shown in Figure 11-45), create a Test Mix Model based on user pace. For the test mix, break down your numbers from the Creating your load test section earlier in this chapter and only use 10 percent because you are starting the stress test with 10 concurrent users.

Finish up the rest of the settings the same as in the Creating your load test section, except increase your Test Run Time from 20 minutes to 32 minutes to test all the increases in concurrent users.
Other load test options
Visual Studio 2012 Ultimate is a great tool for load testing, but the ability to handle only 25 concurrent users with the trial version is a bit limiting. Hopefully, you will be able to show your boss the benefits of having Visual Studio 2012 Ultimate for running tests on your environment, and your boss will purchase a copy of it for you. If you are not that lucky and need to show your boss options, Microsoft still has older versions available for testing as well. Maybe your boss will like one of these products.
Visual Studio 2010 Ultimate
If the requirement for demonstrating a load test for your boss is below 250 concurrent users, then you should try using Visual Studio 2010 Ultimate. The maximum number of concurrent users for the Visual Studio 2010 trial version is 250.
Download the .iso file from http://tinyurl.com/PCfromDC-VS2010iso, and install the service pack from http://tinyurl.com/PCfromDC-VS2010-SPiso. If you are going to run this setup on a Windows 8 or Windows 7 environment, install the Forward Compatibility Update from http://tinyurl.com/PCfromDC-VS2010CU. To export documentation from your test sessions, you should have Office Professional Plus 2010 installed (http://tinyurl.com/PCfromDC-Office) as well as the service pack for Office 2010, which you can get through Windows Update.
Visual Studio Team System 2008 Team Suite
If your oss wants you to demo a load test for more than 250 concurrent users, you can download a 90-day trial version of the Visual Studio Team System 2008 Team Suite from Microsoft to run your load tests. You can download the Visual Studio Team System .iso file from http://tinyurl.com/PCfromDC-VS2008. Download and install the service pack after you install Visual Studio Team System 2008. You can download the .iso file from http://tinyurl.com/PCfromDC-VSTSsp1.
The installation of Visual Studio 2010 and Visual Studio Team System 2008 is very similar to the installation performed for Visual Studio 2012 Ultimate in the “Setting up Visual Studio 2012 Ultimate” section earlier in this chapter, except that you just want to install the product using the default settings.
After you create a web test, Internet Explorer should open and allow you to start recording your web session. If you are using Visual Studio Team System 2008 and the recording window does not pop up as it did for Visual Studio 2012, some troubleshooting will be required. To use Visual Studio Team System 2008 with Windows 8, close all instances of Internet Explorer, and then go into the registry and delete following entries located at
For more Visual Studio Team System 2008 troubleshooting help, visit http://tinyurl.com/PCfromDC-Recorder and read “Diagnosing and Fixing Web Test Recorder Bar Issues” by Michael Taute.
If you decide to run Visual Studio Team System 2008, there is one more modification that might be helpful to avoid a System.OutOfMemoryException error. Try modifying the VSTestHost.exe.config file, which by default is located in the C:Program Files (x86)Microsoft Visual Studio 9.0Common7IDE folder. Remember to make a backup of the file prior to modifying the .config file. Within the <runtime> tag, add <gcServer enabled=”true” />.
Putting it all together
You have been given the tools to go out and start testing websites and their environments to help you validate your SharePoint architecture. It is now time to take that knowledge and run through a very common scenario.
Scenario
Another consulting firm has implemented SharePoint Server 2013 at Contoso, but it did not supply Contoso with any farm documentation. You have been called in by Contoso to do a review of its environment and verify that its farm can handle the estimated user load and that Kerberos has been implemented correctly on the staff site.
As a guest in the Contoso environment, you will not be able to use the existing software on your laptop because you will not be allowed to plug in to its network. You have received the only paperwork that Contoso had on file, along with its current user web utilization. You have received a copy of the farm layout (Figure 11-46), and a spreadsheet of the server hardware layout (Figure 11-47). (Remember that this is a demonstration on load testing and troubleshooting the Contoso environment, and you should deploy your farm based on your infrastructure and planning design documentation, not the Contoso farm in this section.)


Read through Figure 11-47 and notice that the original consulting group had put the farm into an unsupported state by installing only 4–6 GB of RAM, and when questioned, Contoso said that the structure was designed based on the ability to handle the current user load.
Contoso would like load test documentation for the current farm state, as well as additional load test documentation for any farm configuration modifications. Contoso would also like the load test to hit the home page of every site collection and perform a search from the Search Center using the Everything, People, Conversations, and Videos tabs. Contoso would like to load-test the WAC server as well.
Contoso has given you a Windows 8 desktop with 6 GB of RAM and a single four-core processor. The Contoso utilization profiles are shown in Figure 11-48. Contoso does not have Visual Studio installed and does not have a full-blown license to any of the Visual Studio Ultimate products.
Verifying sites
The first thing, and hopefully the easiest thing, to do is to click through the sites that Contoso wishes to have load-tested. Starting with the Staff site, go to the rest of the company’s sites, such as Projects, Search, and My Sites. While you are surfing around, verify the functionality of the WAC server. To get started, open up Internet Explorer, enable the Developer Tools, and start capturing your network traffic for the page loads. Because Contoso has asked for before- and after-modification documentation, it would be a good idea to save the page data as a .csv file as you go through the different sites (see Figure 11-49).

As you go through your sites and record your findings with IE Dev Tools, also verify the functionality of the WAC server, as shown in Figure 11-50.

It is great news that the WAC server is rendering the Word file, but when you go to review the page load network capture, you notice that the WAC server is being called over HTTP (see Figure 11-51). The WAC server should be used over HTTPS, and even Contoso has asked for it to be over HTTPS, but things do not appear to be that way. Make sure you save this page’s output!

Verifying Kerberos
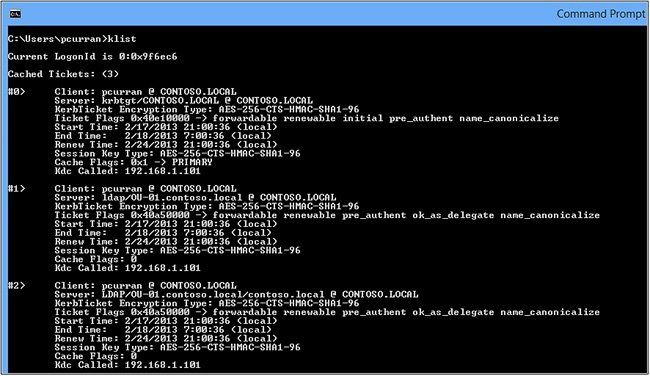
One of the great things about Windows 8 is that it has the ability to run Klist out of the box. To verify that Kerberos is functioning correctly for Contoso, open a command prompt window, type klist, and press Enter. You should see a Kerberos ticket similar to the one shown in Figure 11-52.
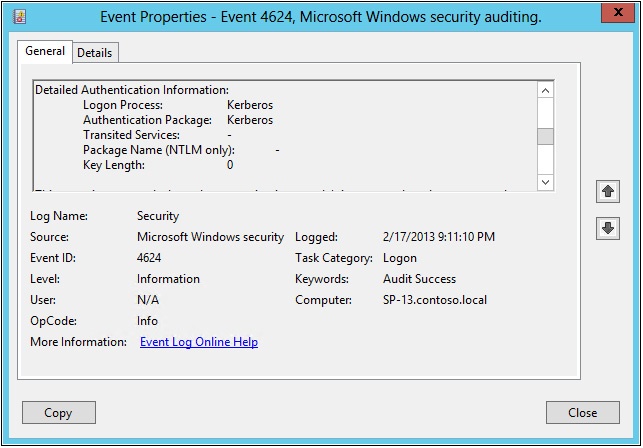
As you can see, ticket #0 has the Kerberos ticket information, but if that is not good enough, you can always go to the SharePoint server itself and open the Security Logs in the Windows Event Viewer and check the logons, as shown in Figure 11-53. You should be able to find an Event Property that shows the logon process as Kerberos.
Setting up Visual Studio Ultimate 2010
Contoso has asked that all changes be documented, which means that before anything is done to set the farm back into a supported state, a load test should be done on the before side so that Contoso can see how the changes affected their environment. As you know, the big problem with the Visual Studio 2012 Ultimate trial version is that you are able to test for only up to 25 concurrent users. As previously shown in Figure 11-48, the requirements for Contoso put this test at just below the 250 concurrent user maximum for the Visual Studio 2010 Ultimate trial.
Create the performance test
The next step is to create your performance test by creating a web test, and then going to the sites that Contoso has specified in its instructions. By surfing through the company’s sites and recording the URLs, you will be able to not only grab the URLs to test but also the parameters passed through the URLs. Once again, when you are done with creating your web test, delete all the extra posts so you are only sending requests to the .aspx pages, as shown in Figure 11-54.
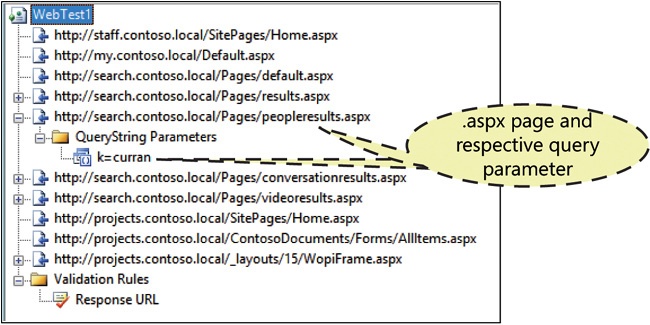
One thing to be aware of is the number of requests that the performance test is making. It is not a coincidence that there are 10 requests for this; when it comes time to create the load test, it will be easier to do the math.
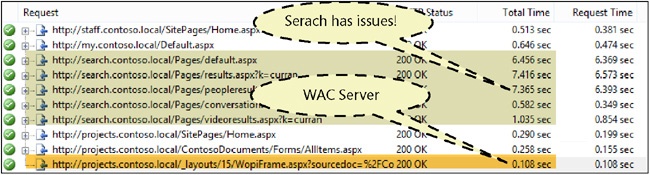
After you create your performance test, run it and have your test validated. The validation is useful because you do not want to run 20 minutes of invalid web testing, but it also allows you to look at the performance numbers returned from your test. After running the initial web test, Figure 11-55 shows that there is a huge discrepancy in total time between the search farm and the rest of the farm. After running the test 10 more times just to be safe, the issue still remained.
After going through the Search Farm event viewer, there were issues with the SharePoint server communicating with its SQL server. While running a ping test between the two servers, one of the NICs on the SQL server would turn off and on at random intervals. So after replacing the NIC and rerunning the performance test, our numbers improved to within expected times, as shown in Figure 11-56.

Create the load test
According to the statistics, Contoso has 1,200 total users, but only 20 percent of them are on at a given time. That means that you really only need to worry about the requests for 240 concurrent users. The good news is that those users are all doing different jobs and are sending requests at a different rate. That is why the users are broken into different utilization categories and assigned an estimated requests per hour (RPH) value. This test is going to use the same web test that was created in the last section. After creating a copy of the web test, create your load test by going to Project | Add Load Test.
After the wizard page opens, click Finish, as you will be creating your load test manually. Under Scenarios, delete the default Scenario1, then right-click the name of your load test and select Add Scenario, as shown in Figure 11-57.

Name your scenario based on the type of users that you are creating. For example, you might call the first group Light Users. Once again, you are going to want to work with zero think times, but this time, instead of working with only one very busy user, you are going to enter 24 for the User Count based on the RPS worksheet (1,200 x 20 percent x 10 percent). You are going to use the Based On User Pace, and then select the appropriate web test and enter the data off your RPS worksheet for the Tests Per User Per Hour (Avg RPH/User). Now remember that the web test is actually using 10 requests for its test, so you can either really tax your farm or adjust the numbers accordingly. This initial test will be testing the environment and not adjusting the numbers for the extra requests. If you wanted to adjust for the number, just drop off the trailing zero. So the Light Users would be two requests per user per hour. Setting up the rest of the test will involve using the default settings, except this test will be using Internet Explorer 8 for the test’s browser compatibility. After adding the first set of users, add the rest of the other user groups. When you have finished adding your user groups, your Scenarios should look similar to Figure 11-58.

The next step is to set up the Counter Set Mappings by assigning the counter sets to the servers that are running within your SharePoint environment. Use the same procedures that were demonstrated in the Creating your load test section earlier in this chapter. To add the counter sets manually, expand the Run Setting and right-click Run Settings1 [Active], as shown in Figure 11-59.

As shown in Figure 11-60, configure your Counter Set Mappings to the Contoso farm layout from the Scenario section.

Under the properties of Run Settings1 [Active], adjust your Run Duration to 20 minutes and set your Warm-Up Duration to 5 minutes. Once you have completed all your adjustments, such as setting your Threshold Values and getting your load test parameters set, it will be time to run the first test.
Remember to surf through the pages of your test to verify how this type of load would be experienced by a user. Also, surf through the sites that were used in the load test after the test is finished. If there were errors/failures during your test, you will want to see how the farm bounces back.
Once your test is completed (see Figure 11-61), document and keep the baseline numbers to compare against the next load test after making changes to your farm.

It is now time to make all the appropriate changes to get the SharePoint farm back into a supported state, and then run the same load test again. Document the changes and results from the changes made (see Figure 11-62 to see the results).

Documentation
Contoso’s final requirement was to document the effectiveness of all changes. Luckily, Visual Studio gives you the ability to export reports and actually run comparison reports containing charts for comparing baseline numbers against other load tests that you have run.
This load test used Visual Studio 2010 with SP1 and Office Professional Plus with SP1. If you run into issues with the Create Excel Report button being dimmed, open Excel and make sure that all the COM add-ins are selected, especially the Load Test Report add-in.
After you have run more than one load test, the first thing to do, from either the Summary page or the Graphs page, is click Create Excel Report, as shown in Figure 11-63.

This should open Excel with a Generate A Load Test Report window. Select the Create A Report option and click Next to continue.
In the report type window, select Run Comparison, and then click Next. In the Load Test Report Details window (shown in Figure 11-64), add the Report Name.

In the next window (shown in Figure 11-65), select the load tests to compare.
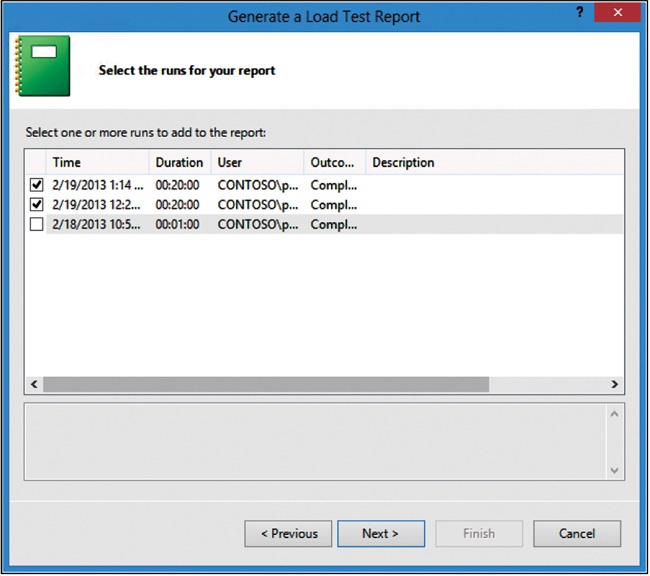
If you wish to have more counter sets to add to the report, select them in the next window.
When you have finished making your selections, click Finish to generate the first report to give to Contoso. As you can see from Figure 11-66, by adjusting the hardware to bring the servers back into a supported state, there has been a fantastic improvement in speed for most of the users.

Finally!
You have documented the issues found within the Contoso environment, you have created the performance tests, and you have executed the load tests. You have fixed the outstanding issues and were able to document the effect that your changes had on the Contoso environment. You have successfully met all the requirements that Contoso put upon you as a consultant. (The next step would be to convince your boss to purchase you a copy of Visual Studio 2012 Ultimate.)