
CHAPTER 12 Incident Analysis
Introduction
In the last chapter, we saw an overview of the incident handling process. We looked at the different phases:
- Preparation: Laying down the infrastructure to resolve an incident when it occurs.
- Analysis: Figuring out and documenting as much of the incident as possible.
- Containment: Given the results of the analysis, determine what is the best way to process and remove any lingering effects of the incident.
- Lessons learned: Apply the newfound knowledge to remediate any issues found during the process, going back to the preparation phase.
The cycle of incident handling never ends. As new vulnerabilities come about, new technologies are deployed, new challenges appear. If something is missed during the preparation phase, when the organization tries to be proactive about its vulnerabilities, it will inevitably lead to adverse events.
In this chapter, we take a closer look at phases 2 and 3, analysis and containment. We will:
- Look at sources of information within the Linux and Windows operating systems.
- Learn how to extract information from those systems specific to the event we are reviewing.
- Learn how to create timelines indicating the pattern of the event.
- Look at examples of evidence of attack on multiple applications.
Log analysis
Most software applications and operating systems provide some sort of logging mechanism to record status information. The purpose of logging the tasks on an application varies.
- Software developers use logging to ensure the application is behaving as expected. For instance, the software developer may decide to dump the output of an internal command to the screen in certain situations. This is commonly known as running the application in debug mode.
- System administrators use logging information to do performance analysis on the production instance of the application. For example, SAs may monitor the logs to make sure the application has enough memory and disk space to run properly.
- Security administrators use logs during the analysis stage of an incident. In fact, access to system logs is likely the first item a security admin will request as part of an investigation.

In this section, we will take a closer look at logs in general, both operating system logs and application logs.
Windows logs
Windows logs are also referred to as “event logs.” Figure 12.1 depicts the interface Windows provides a user to peruse the logs. The program is known as Event Viewer. There are other tools, open source and commercial, that can be used to dig into the event log files in Windows. A simple web search will come up with hundreds.
The left pane on the Event Viewer is the navigation pane. It provides the administrator the means to look at the different logs that exist in this system. On this pane, the administrator is able to create custom views, focusing on specific targets.
Event Viewer Home Screen
The Home screen of the Event Viewer, depicted in Figure 12.1, consists of three panes with different information on the log files.
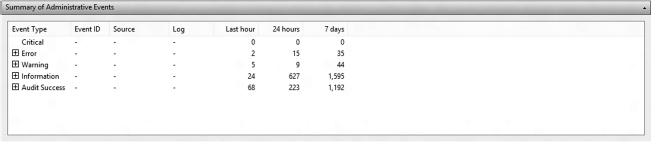
Summary of Administrative Events pane This pane contains a breakdown on the number of events per event type. If the administrator expands the event type by clicking on the “+” button next to the type, the number of events under that particular event type is further broken down by Event ID. Event IDs are classes of events under a specific type (Figure 12.2).
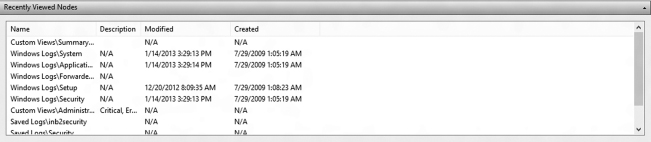
Recently viewed nodes pane This pane contains the latest event log files viewed. It contains a description of the view (when available), the date the log file (node) was last modified (in other words, when something was actually written to the file), and when the file was originally created. Blank date lines indicate that the file was never created or log entries have never been appended to the file (Figure 12.3).

Log Summary The last pane on the Home page is the Log Summary pane. It describes the attributes of each of the log files Windows is currently keeping. The Size/Maximum Column tells the administrator how much space is left for growth in the log file. If you see files that are nearing or at the maximum, it is likely that the records stored in those files are rotating and therefore being lost (Figure 12.4). This begs the question: how many days’ worth of logs is the machine able to store before records are lost?
Usually you will notice that the Security Log will fill up the fastest, requiring rotation more often than the others. This is particularly true on Windows Servers. Depending on the user population of the server, extracting useful information from the Security Log files may be useless.
Also, note two more columns displayed on the Log Summary pane. At a glance, you can confirm whether a particular logging service is enabled, and you can also find out if the service is set to overwrite the existing information when the log file is full or discard new entries when full.
Types of event log files
By default, a few event log files are common to Windows OS since XP. You can see the Windows log files displayed on the left pane on Figure 12.2.
- The application log contains logging information from third-party applications and Microsoft applications not considered part of the operating system core distribution. For instance, video game log information, Microsoft Office logs, all these messages are logged within the application event log file.
- The security file is largely a repository of login and logout attempts by default. Its configuration can be adjusted so that it would log the creation and opening or closing of data files within the system.
- The system event log file holds operating system log messages. For example, network connection problems and video card driver errors are logged to the system event file.
Windows 8 has two more standard log nodes:
- The Setup node, which stores logging information regarding the installation of software applications.
- The Forwarded Events log, which we will be discussed in a few moments.
Windows forensics example
Here is a quick, real-life example of using Event Viewer to gather data for analysis. At times even events classified as “informational” may carry important information for a security analyst. Take the screenshot from a compromised machine on Figure 12.5.
This computer had a McAfee antivirus installation running on it. Browsing through this log file, a few words should pop up immediately. In the general description, we see “Event ID 5000.” This is not the original machine the log was exported. Therefore, Windows cannot tell which event generated the event. However, the included information points to “VirusScan Enterprise” as the culprit. If you were familiar with the organization you would know that the AV engine version at the time of this incident was 5.4.1 (compared with the 5.3.0 text found) and the virus signature version was 5700, leading to the conclusion that the virus scanner was not up to date on this particular machine. An Internet search on “Event ID 5000” in connection with McAfee reveals that this could be an error raised if the On Access protection, the piece that keeps the machine from getting infected real time, did not start up successfully.

All of this information is from a single, simple informational event log message. At this point, the question on your mind should be: was the antivirus software application running on this machine at all?
Event criticality
Log messages are also tagged with labels indicating their level of urgency. When looking at the Event Viewer, you will notice that the Custom View folder contains the “Administrative Events” Custom View. This view comes installed by default with the Windows 8 installation and provides a view of all the “Critical,” “Error,” and “Warning” events from all administrative logs. These are the top level, most urgent log messages on a Windows system. Figure 12.6 shows a typical output of the Administrative Event view. According to Microsoft,1 Windows has the following levels of criticality:
- Information: An event that describes the successful operation of a task, such as an application, driver, or service. For example, an information event is logged when a network driver loads successfully.
- Warning: An event that is not necessarily significant, however, may indicate the possible occurrence of a future problem. For example, a Warning message is logged when disk space starts to run low.
- Error: An event that describes a significant problem, such as the failure of a critical task. Error events may involve data loss or loss of functionality. For example, an Error event is logged if a service fails to load during start-up.
- Success Audit (Security Log): An event that describes the successful completion of an audited security event. For example, a Success Audit event is logged when a user logs on to the computer.

- Failure Audit (Security Log): An event that describes an audited security event that did not complete successfully. For example, a Failure Audit may be logged when a user cannot access a network drive.
UNIX have similar levels of criticality, but not quite the same. We will see those in the next sections.
When “Event Viewer (Local)” is selected on the left pane, the administrator is taken to the Overview and Summary page.
Unix logs
Now let's take a look at Unix logs. What we will see in the next few sections uses Linux but the idea, and very often the file locations and configuration files, also apply to other flavors of Unix, such as Solaris and AIX. For instance, one of the files we will look at is /var/adm/messages (Solaris) or /var/log/messages (Linux). The same file, with the same type of content, but in a slightly different location.
Syslog logging facility
Unix has a process especially designed to handle messages for programs that are “syslogaware.” As such, any programmer can use the facility to store log information on a location specified in the syslog.conf configuration file.
The syslog service is used by specifying what is known as selectors. Selectors are composed of two parts:
- Facility specifies the service that produced the error message. Some of the available facilities are auth, authpriv, cron, daemon, kern, lpr, and mail. Log messages produced by the email subsystem, for instance, would be logged using the mail facility. Syslog also provides facilities for locally developed code to use. These are known as local0 through local7.
- Priority is one of the following: debug, info, notice, warning, warn (same as warning), err, error (same as err), crit, alert, emerg, panic (same as emerg). Priority classifies the message by criticality. Priorities are additive, meaning that when a priority selector messages with that priority and all higher priorities will be logged. For example, the selector mail.warn will match messages with the priority warn, err, crit, and emerg.
The configuration file is composed by combining a selector coupled with an action. The action could be:
- A filename, such as /var/adm/messages
- A forward to the syslog service on another host, such as @hostname
- Write the log information to the user's screen by specifying the username (or * for all users)
Here are some examples:
*.info;mail.none;authpriv.none;cron.none   /var/log/messages
authpriv.*                               /var/log/secure
mail.*                                  /var/log/maillog
cron.*                                 /var/log/cron
*.emerg                                *
On line 1, all messages classified as info or higher priority regardless of facility (*.info) will be written to /var/log/messages. The only exceptions to this rule are messages with the facility mail, authpriv and cron. In lines 2–4, all messages with those facilities are written to their respective log files. Finally, all messages with the priority of emerg (typically only used if a system shutdown is eminent) are written to the screen of all users currently logged into the server.
Sidebar
There is a lot more to syslog configuration. There are also many syslog replacements, open source, and commercial, with improvements such as logging to databases. Unfortunately, these are beyond the scope of this book. The intent of approaching this subject, on Windows as well as Unix, is to give you enough background to be able to understand where to start looking for the logs. If you are involved in an investigation, you look at the /var/log directory and all files are empty does not mean someone removed them. It could be that the administrator simply put the logs in a different location.
Standard log files
When investigating an incident, the analyst should probably look at all files on the /var/log directory. Here are some of the most important.
messages or syslog Most Unix implementations will include a messages file although some versions of Unix use /var/log/syslog instead. The information it stores, however, is essentially the same as the standard /var/log/messages file. Any and all informational messages using the syslog service goes to these files. As such, it is the first stop for an administrator looking for possible problems or a security analyst looking for traces of a break-in.
One of the nice things about Unix log files is that you can quickly dissect them using some of the tools we have learned so far. Take the snippet shown in Figure 12.7, for example. That chunk of log file was dumped to the screen with the following command:
zcat syslog.?.gz | grep -v snort | grep -v AptDaemon | grep -v dbus | less
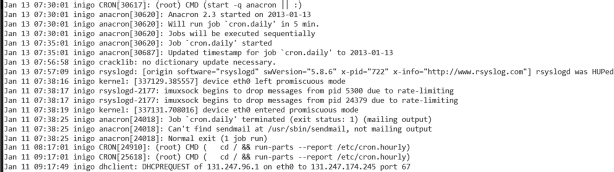
which essentially directs the system to uncompress the contents of all files on the current directory from matching the pattern above, where “?” expands to any letter or number. Then remove any line containing the words “snort,” “AptDaemon,” or “dbus” and display the results through the pager command less. This was done to declutter the log file. In the Windows event log, this would be the equivalent of asking the program to hide any “Audit Success” messages for starters. This simple command line reduced the number of lines of interest from 3,600 to 1,000.
The reasoning behind the decluttering is simple. When you first start examining the log files, you want to look at abnormalities, odd events. Look at Figure 12.7 again. About half way through the picture, the following log line appears:
Jan 11 07:38:16 inigo kernel: [337129.385557] device eth0 left promiscuous mode
All log lines using the syslog service follow the same pattern: first a date, then the military time, the host name, the service logging the message, and finally the actual message. On this particular line, at 7:38 a.m. on January 11, the eth0 interface, the wired network interface that connects the host to the network, “left promiscuous mode.” Ordinarily this would be a concern. An interface in promiscuous mode is essentially able to capture any and all data traffic it sees, including data packets that do not belong to it. In a switched environment, that may not be a problem. But in a shared environment, such as unprotected wireless access points, all traffic from all machines connected to this access point would be visible to this computer while in promiscuous mode.
Authentication log The next stopping point for the security analyst should be the authentication log, /var/log/secure or /var/log/auth.log, depending on the operating system. As the name implies, this file holds authentication and authorization information for the system. Figure 12.8 has a small sample.
This file was extracted from a desktop Linux box, containing no particular appealing data for a hacker. This box is what is known as a “crash and burn” station. It is set up, then destroyed, then set up again, and so on. Its purpose is to test new forensics tools. Look at the log file. Within a period of 6 hours, overnight:
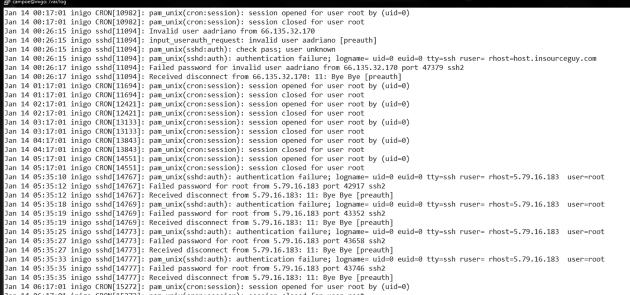
- Someone using the login aadriano tried to login using ssh from 66.135.32.170.
- Someone tried to login multiple times, probably with multiple passwords, to the root account from 5.76.16.183.
Since there is no aadriano user on this box, we can only assume that this was an automated script, perhaps using a known password obtained somewhere for the user aadriano. A quick web search on the IP and the account brings up a web page from a honeypot site, a site which deliberately leaves itself open to attract and record intrusion attempts. The honeypot site has the actual passwords used on the attempts against it: admin, aadriano123, and aadriano. All attempts recorded on the honeypot site happened around the same date as our incident.
The next bullet is actually a bit more concerning. The IP belongs to a communications company in Russia. A search on the address reveals no records, no traces anywhere. While the first attack leaves clear tracks of being automated, the second may have been a targeted exploratory probe. The next step on the analysis process would be:
- Check if the same IP hit any other computer on your organization
- Check the full log, without the filtering, for the same IP
- Check other log files on the same machine
Sidebar – Standard operating procedure for hackers
Once you get used to analyzing incidents, you will notice a pattern. Organized criminal hackers doing mass attacks usually split up their activities in three different phases, with three different teams working from three different locations:
First, comes the discovery phase. These are soft touches on your infrastructure in order to detect and analyze possible weaknesses. Port scans, limited login attempts like we've seen in this section, web server scans looking for specific vulnerable applications, all of this looking for the low hanging fruit.
After discovery, the penetration phase starts. The goal of the penetration phase is to use the information discovered on phase one to actually gain a beach head on the target organization. The discovery phase team turns in the information to the penetration team for the actual break in. Even if your systems were smart enough to block the connections from the first set of IPs involved in discovery, this new phase will use a brand-new set of address as the point of origin for the attack. The penetration phase activity would not be blocked.
Finally, we hit the exploitation phase. In this phase, some data may be extracted from the hacked machines. A few machines may be used to exploit other organizations. And a few may be left dormant in the hopes that it will not be discovered and contained.
wtmp The wtmp file is not a text file, but a binary file which stores historical login and logout information. The Unix who command reads the /var/log/wtmp file and displays on the screen a list of the last logged in users. In addition, last will also report any reboots of the system recorded on /var/log/wtmp. If you are looking for reboot times, the last command is always the easiest command to run and get a quick answer. The assumption is, of course, that the logs have not been altered. Figure 12.9 shows a sample output of the program last on a little-used desktop Linux box. It shows the user name, the pseudo terminal number associated with the login, the hostname, and the period of time the users was logged in. The “-a” switch at the end of the command tells the system to display the hostname at the end of the line. If that switch is not used, the hostname is shown on the third column and truncated as needed. That often makes it difficult to read the full hostname.

The wtmp file is rotated periodically. You may notice several wtmp files in /var/log, appended with a .1, .2, etc. These older files can be accessed by using the last command with a –f <filename> flag.
Sidebar – Admin's Best Friend
You can always find out more about Unix command and all the switches and options available by using the man command. For instance, man last will give you a complete description of the command, as well an indication of where in the system its log file resides. The man pages also cites related commands you may find useful.
utmp file While the wtmp file stores historical information about logins, the utmp file indicates who is logged in to the system at the present moment. In some Unix systems, utmp is kept on the /var/adm directory. Most Linux distributions keep the file in /var/run.
Similarly to wtmp, the utmp is a binary file. Its contents are examined by using the “who” command. This command reads the utmp file and displays the username of those logged in, as well as some information about where they are logging in from.
Another, perhaps a bit more useful command is the “w” displayed on Figure 12.10. This command displays a bit more information about the system and it is usually one of the first things an analyst will run as soon as logged in. The w command shows:
- How long the computer has been up since the last reboot.
- Which real or pseudo terminals are being used.
- When the users logged in.
- Whether they are active or not.

- Load information.
- Command running by the user.
The output of w may not be very impressive on Figure 12.10, but it becomes quite useful on multiuser systems, where hundreds of users may be logging in and working at the same time. Let's assume that while executing the command. you see a user running the following command:
nmap 192.168.1.0/24 > ˜/.out/.output.pscan
Even if you do not know what the command nmap does, the fact that you have a user in your system who is storing data on a hidden file in a hidden directory should raise warning flags. A quick web search reveals that nmap is a powerful port scanner. The host specification indicates this user is scanning the entire 192.168.1 subnet. Even if this is not against policy, it warrants a check. If the FROM column displays a hostname that is not known to you, it may be time to enter incident response mode.
Web server logs
The majority of the incidents in the past few years involve some sort of web-based event, whether it is exploiting a Java vulnerability, downloading a tainted PDF file, or the ever so common SQL injection. In order to analyze this event, we need a sample of the web server log.
The following box shows a few lines on a log file of an application server running the PeopleSoft application. PeopleSoft uses a custom configured Apache web server as its front end.
xxx.2xx.89.16 - -  [09/May/2012:11:41:37 -0400] “GET /login HTTP/1.1”
404 338
xxx.2xx.89.16 - -   [09/May/2012:11:41:37 -0400] “GET /sws/data/sws_
data.js HTTP/1.1”  404 353
xxx.2xx.89.16 - -  [09/May/2012:11:41:37 -0400] “GET /wcd/system.xml
HTTP/1.1” 404 347
xxx.2xx.89.16 - -   [09/May/2012:11:41:37 -0400] “GET /js/Device.js
HTTP/1.1” 404 345
xxx.2xx.89.16 - - [09/May/2012:11:41:37 -0400] “GET /ptz.htm HTTP/1.1”
404 340
xxx.2xx.97.183 - -  [09/May/2012:11:41:37 -0400] “GET / HTTP/1.1” 200
14257
xxx.2xx.97.183 - -  [09/May/2012:11:41:37 -0400] “GET /authenticate/
login HTTP/1.1” 404 352
xxx.2xx.97.183 - - [09/May/2012:11:41:37 -0400] “GET /tmui/ HTTP/1.1”
404 339
xxx.2xx.97.183 - -  [09/May/2012:11:41:37 -0400] “GET /admin/login.do
HTTP/1.1” 404 348
xxx.2xx.97.183 - -  [09/May/2012:11:41:37 -0400] “GET /dms2/Login.jsp
HTTP/1.1” 404 348
xxx.2xx.97.183 - - [09/May/2012:11:41:37 -0400] “GET /login HTTP/1.1”
404 339
xxx.2xx.97.183 - - [09/May/2012:11:41:38 -0400] “GET /sws/data/sws_
data.js HTTP/1.1” 404 354
xxx.2xx.97.183 - - [09/May/2012:11:41:38 -0400] “GET /wcd/system.xml
HTTP/1.1” 404 348
xxx.2xx.97.183 - -  [09/May/2012:11:41:38 -0400] “GET /js/Device.js
HTTP/1.1” 404 346
xxx.2xx.97.183 - -     [09/May/2012:11:41:38 -0400] “GET /ptz.htm
HTTP/1.1” 404 341
xxx.2xx.89.16 - -   [09/May/2012:11:41:38 -0400] “GET /robots.txt
HTTP/1.1” 404 343
xxx.2xx.89.16 - -  [09/May/2012:11:41:38 -0400] “GET /CVS/Entries
HTTP/1.1” 404 344
xxx.2xx.89.16 - -        [09/May/2012:11:41:38 -0400]   “GET   /
NonExistant1380414953/ HTTP/1.1” 404 355
On the sample above, the host 97.183 seems to be performing some sort of probe on the web server. Each line seems to be searching for a different application. Again using a web search, we find that “ptz.htm” is the front end for an AXIS security camera. The sws_data.js file belongs to the web statistics package Awstats. In addition to these findings, it seems like 97.183 is also attacking 89.16, which in turn is forwarding the attacks to this web server. Indeed, after further investigation, we determine that 89.16 is a proxy server for Peoplesoft.
Netflow logs
Netflow is a network protocol developed by Cisco to collect network IP traffic information. Through the years, it has also become supported by other network equipment vendors as the standard for this type of logging.
Here's a sample of information available from netflow. The lines were decomposed to facilitate the reading.
Date       Time         Source        Port   Destination     Port
Packets
2011-12-01 00:11:19.285 66.2xx.71.155 34340  1xx.2xx.222.243 443
TCP 1 60
2011-12-01 00:11:46.659 61.1xx.172.2  35590  1xx.2xx.222.243  80
TCP 1 48
2011-12-01 00:18:58.992 71.xx.61.163  55194  1xx.2xx.222.243  80
TCP 3 152
2011-12-01 00:18:59.594 66.2xx.71.155 36614  1xx.2xx.222.243 443
TCP 3 180
Network logs such as this netflow log are key to being able to establish relationships between activities in multiple computers on the network. Besides the timestamp, the netflow logs indicate the source and destination of transactions. The port number is useful to determine the type of service running on the source and/or destination IPs. Finally, the number of packets is a good indication of the amount of information exchanged during that connection. From the snippet above, we can already determine a few things:
- 222.243 was probably running a web server on port 80. This is traditionally the port number for an unsecure (non-SSL) web server.
- The same IP was running a secure (SSL) web server on its standard port, 443.
- The amount of traffic on these ports is an indication of whether this was a popular web server or not. An out of the ordinary amount of connections could indicate that questionable content (such as porn, music, or movies) being distributed illegally.
- Since there was a web server running, it also means that there should be a log file somewhere on 222.243. If we want to find out what was transferred at a specific time we could find out, assuming the clocks on the netflow device and the web server were in sync.
As you can see, we can obtain quite a bit of information from four lines of netflow logs.
Other logs
Depending on the applications running on your system, you may have more logs to investigate which working on the analysis of the incident. The following are messages extracted from a server running WordPress, a Content Management System. It shows the WP application being attacked by a SQL injection attack.
[07-Dec-2012  02:40:49] WordPress database error You have an error in
your SQL syntax; check the manual that corresponds to your MySQL server
version for the right syntax to use near ‘WHERE id = —1‘’ at line 1 for
query SELECT text, author_id, date FROM WHERE id = —1’
[07-Dec-2012 02:40:50] WordPress database error You have an error in your
SQL syntax; check the manual that corresponds to your MySQL server version
for the right syntax to use near ‘WHERE id = 999999.9 UNION ALL SELECT
0x31303235343830303536--’ at line 1 for query SELECT text, author_id,
date FROM WHERE id = 999999.9 UNION ALL SELECT 0x31303235343830303536--
General log configuration and maintenance
Operating systems and software applications come from the developer with default settings for log capture, but those default settings do not always fit the desired outcome. Like we mentioned in the beginning of this book, different IT personnel want to extract different things from logs, and what the user may want is not necessarily what the security analyst desires. For instance, the user may not care about records of login and logout to the desktop at all. Obviously, from the security analyst's perspective, that information is quite valuable. Therefore, the first task to accomplish when dealing with log configuration and maintenance is to determine the audience. Who will be interested in seeing the logs? Is there a compliance issue that requires the logs to be set up and record a specific activity? For instance, is my organization required by Federal Auditors to record any and all access to Social Security Numbers stored in my database? Is my organization required to maintain log information for a certain number of days? What information is the organization required to maintain?
These are all compliance questions, and compliance is not necessarily the same as security. Let's look at some baseline configuration changes and again ask the question “What should I be keeping?” with our eyes on the security aspect. Figure 12.11 is a screenshot of the entries on the security event log with default settings, from a Windows 8 Early Release installation.
We previously discussed the fact that the Security Log is usually the one that will fill up and rotate the fastest. And here is the reason: repeated, successful logins from users. In this case, we have a couple of options.
- Increase the maximum log file size. This would buy us some additional time and may be enough on personal computers to allow for a decent number of days retained. However, it is not a “one-size-fits-all” solution and may not be practical in an enterprise environment. The administrator may have to determine different log sizes for different computers depending on usage pattern.
- Do not log “Audit Successful” messages. This may sound like an acceptable answer, at least at first. However, it should not be option A for a security analyst. If you remove all successful logins from the logs you would also miss all the times when a hacker logged in to the computer using a stolen password at 4 in the morning! See the sidebar on the next page for a practical example.
- Rotate and archive the old file. Another option would be to archive the file and start a brand new log. This is appealing because you can keep log files down to a short, more manageable size and keep a longer history. The drawback is the disk space usage. Let's say you'd like to keep the log files down to 20MB, keeping the last five copies. That would be 100MB for the security logs. What about the other log files? Usage may start creeping up.

The best option, if possible, is to transfer log files away to another machine dedicated to keep log information. Windows has added this option as of Windows 8. These exported events will show on the Forwarded Events log node.

The act of exporting logs from the original machine to a central box dedicated to log collection is known as log consolidation. From the security perspective, and compliance as well, exporting the logs is the best option for a variety of reasons. For starters, it allows for easier correlation of logs between different computers. With all applicable logs in one location, the security analyst does not have to go around gathering things. It is particularly difficult to collect logs if you do not know which hosts have been compromised. In a consolidated situation, the analyst could be looking on all access files for all connection attempts from one particular IP, for instance. The process is much quicker and simpler. And simple is good when you are in the middle of an incident. Minutes of downtime could translate into millions of dollars (Figure 12.12).
One of the very first things experienced hackers will do when they break into a computer, especially in an enterprise environment, is to clear and disable all the logs in an effort to cover their tracks. If the log entries are exported as they happen, in real time, to another machine, even if the local logs are corrupted, the security analyst will still have access to a pristine copy.
Exporting the logs also offers protection against the threat of abuse of privilege by administrators, since the server administrator can easily cover his or her tracks in a fraud situation by modifying logging information. Of course, here's the caveat: the logging machine, if set up, should only allow access on a need to know basis. Common practice is to only allow security personnel to access this computer, with read-only access handed out as needed to other administrators.
Live incident response
One of the first rules of forensics is to recover as much data as possible while the system is up and running if at all possible. At times, depending on the damage being caused, administrators have to shoot first and ask questions later, pull the plug on the machine, or disconnect it from the network.
However, if the situation allows, an analysis of the live, compromised system may provide investigators with more data. Live incident response involves the collection of both volatile and non-volatile data which the system is up. Volatile data is the data that would be lost on a reboot of the system: running processes, volatile memory content, current TCP and UDP connections, etc. Non-volatile data is the data stored in permanent storage devices, such as hard drives. Once collected, the data must be shipped off the machine through whatever means necessary. Popular applications used to send this data to another workstation (normally known as the forensics workstations) include netcat and cryptcat. Netcat creates a TCP tunnel between the computer under investigation and the forensics workstation, and it includes a MD5 hash checksum capability, which is desirable to ascertain the integrity of the data. Cryptcat is the encrypted version of netcat.
One such a program is the native systeminfo command. Figure 12.13 shows the output of systeminfo on a desktop Windows 8 computer. Interestingly, this is usually one of the first commands a hacker will run on a compromised computer in order to find out how powerful the machine is and how much storage is available. Systeminfo also specifies which patches have been applied to the system.
Sidebar – Hackers and patches
It is not uncommon for hackers to patch machines after they are compromised. This is not done out of the goodness of their hearts. They will patch the machine to ensure that no other hacker group gains access to the same machine.
In general, hackers prefer command line utilities so they can easily read the output and evaluate it from another system. It is common to find log files containing the output of these utilities all nicely wrapped up in one convenient package when investigating a compromised host.

Restoring files
Hackers generate logs. They also have payloads that are usually transferred to compromised systems, including the system profiling tools we have just discussed. These logs and tools are often removed from the system once the beachhead is established, but getting ahold of these files is usually a big plus for an investigation. Restoring files is also particularly beneficial on a personnel investigation, in a fraud situation, or irregular use of company resources.
There is a difference between deleting and erasing a file. Users normally think that by hitting the delete button on a Windows machine, they will effectively remove the file from the system. Other more sophisticated users realize that they must also “empty the trash.” But few users know that even by taking both of these steps, the data associated with this file could still potentially be restored.
Here's a simplification of the process of file storage. When a file is stored on a computer, the data is sliced off into multiple pieces. The first piece will hold the information on where physically on the disk the other pieces are stored (also referred to as metadata). When a file is deleted, the operating system will delete the first piece, the address pointer, and leave the actual data pieces untouched but marked “usable.”
In order to avoid data loss, the address pointer is replicated, sometimes in multiple locations on the system. If this first piece is rebuilt based on the backup pieces before the pieces marked available are reused, the entire file can be retrieved. Another method of file reconstruction is called file carving. With file carving, the carving application attempts to rebuild the file based on the contents of each data piece, and not based on the metadata.
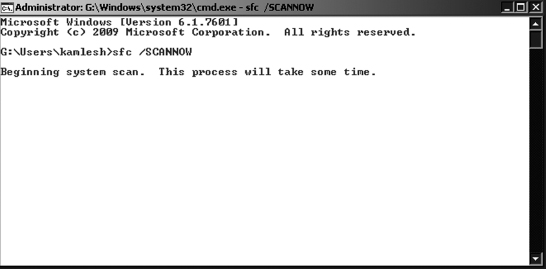
Figure 12.14 shows the System File Check command being run on a Windows 8 machine. This command is usually run when the metadata for certain files are missing at boot time.
Sidebar
Based on the current conversation, how does one effectively “erase” a file? The simplest way is to overwrite the data pieces with random content. This removes all the actual information from each of the data pieces, making the file unable to be restored by carving or otherwise. Unfortunately, hackers have this information as well.
MAC times
We already looked at timestamps for events found on log files of all varieties. Now we will talk briefly about timestamps associated with data files.
Every file, whether on Unix systems or Windows, have at least three timestamps associated with them. These timestamps are known as MAC times, and they are:
- Modification Time – indicates the time the file was last modified.
- Access Time – points to the time the file was last accessed or read.
- Creation Time – the time when the file was created.
Usually the Access Time is not very trustworthy, since it will change often. A virus scanner, for instance, may access all files on the system on a nightly basis when scanning for viruses. A disk defrag application may access the data snippets on hard drives in order to improve performance by removing “empty” spaces between data. Both of these activities could potentially affect the Access Time of files in the system. The tracking of Access Time may have even be disabled by the system administrator to improve file system performance.
The Creation and Modification Times, however, are a bit more reliable. While they can be changed programmatically, they are usually not touched by hackers.
So, let's assume that using the netflow logs, we find a suspicious SSH connection to a server we are investigating. Using the netflow log, we find the timestamp associated with the connection. Netflow also indicates a large number of packets being transferred into the server: some sort of payload was dropped into the system. However, the netflow logs would not tell us “what” was dropped. In order to find out what was the payload we have to examine the system in question. We could go blindly investigating directory after directory, trying to find out what looks out of the ordinary or we could build the server file timeline and determine which files were created around the time found on the netflow logs.
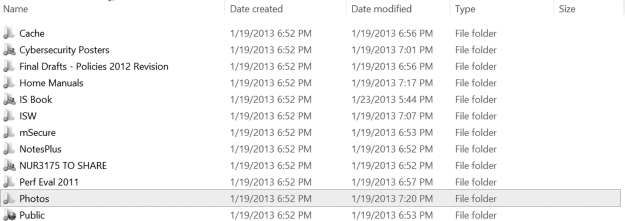
Figure 12.15 shows one way to look at MAC timestamps on a file in Windows. Simply select the file, right click, and then select Properties. You can also display the different dates on a whole directory by using File Explorer and displaying the appropriate column, such as in Figure 12.16. That would work for a quick look at a live system. However, if you need to examine an entire drive, it would be easier to use a tool that investigates directories in a recursive manner, such as mac_robber or another forensics tool.
Timelines
Once all the information has been gathered, it is time to build the incident timeline. Timelines are an essential part of the analysis process. Developing timelines on multiple machines and correlating them with each other and with network logs are a big part of forensics work.
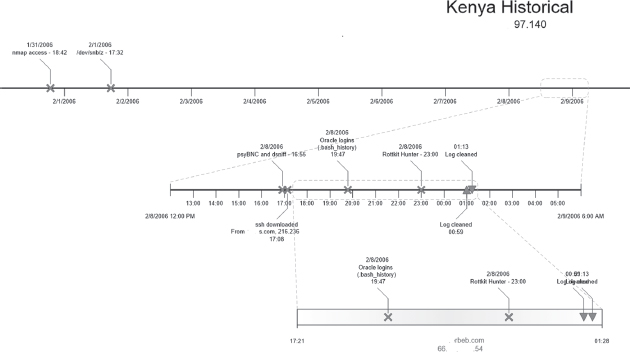
Figure 12.17 shows a sample timeline for one of five different servers involved in an incident in 2006. The resulting report was 15 pages long and questionable activities on the Kenya server were often corroborated on the other servers. Scans initiated on Kenya were detected on Server A and vice versa. The entire timeline was built based on examination of a variety of log files found on the five servers.

Other forensics topics
IT forensics is an extremely broad topic that would require an entire semester to discuss. Proficiency only comes with experience in the area. Training is a constant, since computerized devices with network ability expand constantly, from smartphones to smart thermostats. More and more sophisticated electronic devices become “smart” and start taking a more integral part on the world we take for granted.
Some new developments are worth mentioning, as they bring major challenges to forensics. One such development is cloud storage. Take an application such as Dropbox, for instance. This is brand-new territory for security in general, as well as forensics. For instance, files stored with Dropbox are almost immediately shared with multiple computers in the accounts' Dropbox network. Also, files “deleted” on a computer Dropbox folder are not deleted on the Dropbox web portal and can easily be restored, as shown in Figure 12.18. How much access does an investigator have to Dropbox logs? Would it require a subpoena?
Smartphones and personal tablet devices also raise issues. We discussed the idea of BYOD before, employees using their personal devices for business, often times with access to proprietary, restricted company data. Forensic tools are now being developed that allow an investigator to analyze disk images and files from a smartphone. Most of these tools work on backup copies of the device, not on the device itself. This would imply either possession of the device in order to generate a backup or access to existing backup copies. Internal investigations are out, since gaining access to either one of these options would require the employee's cooperation (which is not always the case) or a subpoena.
Much like the rest of IT security, forensics has to keep up with the pace of technological evolution. Every time there is a new operating system revision, a new device with new filesystem types, forensics tools have to evolve and adapt to the new situation. There will always be a lag, and investigators need to be able to find alternative, creative answers when the situation requires.

FIGURE 12.18 Information Security and IT Risk Management is not affiliated with or otherwise sponsored by Dropbox, Inc.
Example case–backup server compromise
Some time back, a computer housed in the information technologies department of a university was compromised. The machine was used as backup for credit card handling systems and was in the process of being rebuilt when hackers broke in. It is suspected that the intrusion exploited a known vulnerability in an outdated copy of the MySQL database server installed on the machine. The major cause for worry was that a critical file containing sensitive data was transferred from the machine prior to detection of the break-in. However, as a result of the organization's policies and their implementation, the file was heavily encrypted and therefore unreadable by the hackers without knowledge of the private key. This key was only possessed by two people within the organization.
The timeline of the incident is very instructive as it illustrates the blistering pace of these attacks and the need for prompt response by IT. All events listed happened on 1 day.
| 8:00 a.m. | Computer with IP address 1.2.3.4, registered to http://www.example.com, located in Tampa, FL, scans the entire university, gathering information on MySQL servers |
| 10:21 a.m. | Computer with IP address 2.3.4.5, registered to Big ISP in Belgium successfully compromises the local computer |
| 10:53 a.m. | Backdoor created on port 3000. This backdoor was used to run diagnostic programs on the machine and transfer data files |
| 10:57 a.m. | Diagnostic tools uploaded to the server by hacker |
| 11:01 a.m. | First diagnostic program (getallinfo.bat) finished. The program outlines the hardware profile of the machine, including
|
| 11:03 a.m. | Second diagnostics program (speed.bat) finished. It gathers some new information, including
hardware information list of current processes running on the machine list of services information on user currently logged in |
| 11:14 a.m. | File containing sensitive credit card information (datatodate.zip) was transferred from the machine. This file was heavily encrypted. The private key needed to decrypt the file is not housed on the hacked machine and is not believed to have been compromised |
| 12:05 a.m. | Compromise detected and ticket created. Local administrators contacted |
| 12:49 p.m. | File transfer backdoor restarted on the compromised server |
| 1:00 p.m. | Machine removed from network by local administrators |
The installation of the FTP server suggests that the hackers who compromised the server intended to make it part of a network of compromised computers used to distribute pirated software. What is surprising is that although this was not a targeted attack on machines containing financial information, the attackers nevertheless were able to instantly locate the file containing financially sensitive information. However, the information within the stolen file is safe due to encryption.
The following lessons have been learned and implemented following this analysis of the incident.
Access control list
The access control list is the first line of defense against attacks. The list is placed in the network and controls which machines are allowed to access services on the target machine.
Update MySQL server
This seemed to have been the source of the vulnerability that allowed the hackers to compromise the system. Therefore, simply patching the operating system does not solve all security issues. The local system administrator must be aware of all applications running on the computer and resolve critical security updates promptly.
Additional steps taken
- Full and complete review of operations and set up to assure secure environment.
- Program put in place to review IP access list and functional user system access to assure entries are necessary.
- Significant documentation on security measures and business recover plans have either been created or updated.
- Unnecessary open shares removed on production and backup servers.
- No longer storing these files on either server. If something is sent to our vendor, it is then deleted.
CHAPTER REVIEW QUESTIONS
- What is incident analysis? What is the goal of incident analysis?
- What is log analysis? What is the goal of log analysis?
- Open up the Event Viewer on your computer. What is the most recent event in the Administrative Events pane?
- What is the most recent entry in the recently viewed nodes pane?
- What are the different levels of log criticality typically reported by Windows systems?
- How can event criticality information in the Windows logs be useful?
- What are the common locations of log files on Unix-based systems?
- What is the syslog service?
- What are syslog selectors?
- What are the parts of a syslog selector?
- What is the authentication log in Unix? How can it be useful?
- What is the wtmp file? How can the information in the file be useful?
- What is the utmp file? How can the information in the file be useful?
- What information is commonly available from web server logs?
- What are some of the benefits of log consolidation?
- What is live incident response? Why is it important?
- What are some basic principles of live incident response?
- Why are timestamps important in incident analysis?
- What are MAC times?
- What is an incident timeline? Why is it useful?
- What incident analysis issues are raised by popular cloud storage services such as DropBox?
The following questions relate to your analysis of a faculty members hacked Windows laptop. You know this machine was hacked 3 days ago.
- What tool can you use to view the event logs of the computer?
- Which pane holds the Creation date of the log files?
- What assumptions could you make if the Creation date of Application, System, and Security Logs are the same, 4 a.m. this morning?
- Is there a way to have an educated opinion about the last time the hacker accessed the laptop?
EXAMPLE CASE QUESTIONS
- How much time elapsed between the start of the scan and the theft of the file containing credit card information?
- Had the attack gone unnoticed, what potential harm could have happened to the university?
- What are some ways in which the detection of the incident could have been expedited?
HANDS-ON ACTIVITY–SERVER LOG ANALYSIS
In this exercise, you will analyze the server logs from a production web server.
To begin, let's look at the format of the log:
[alice@sunshine ~]$ cd /opt/book/chptr_12
[alice@sunshine   ~]$ head -1 apache_
server.log
The file is the Apache “combined” log format and is made up of the following columns:
- IP address of the client (e.g., 127.0.0.1).
- The identity of the client according to inetd – this is a legacy field and is almost always set to “-”
- The username of the person requesting data if HTTP authentication is used, if authentication is not being used, this field will be set to “-”.
- The time the request was processed (e.g., [16/Jan/2013:10:14:02 -0500]).
- The HTTP request sent from the client (e.g., “GET / images/gtalk.png HTTP/1.1”)
- The HTTP status code (e.g., 200).
- The size of the transfer in bytes (e.g., 1506).
- The “referrer.” The page that directed the client to request this resource (“http://www.sunshine.edu/”).
- The “User Agent,” which gives you information about the web browser and operating system used on the client (“Mozilla/4.0 (compatible; MSIE 7.0; Windows NT 6.0)”).
Of these fields, there are only a few that we need to be concerned with. We will discuss why each of these pieces of data are important and demonstrate how to extract them using the cut command that you learned about in Chapter 10.
Client IP address
If there is a possible incident, you must know where the client is coming from. Note: this data was taken from a production web server, so the IP addresses were modified to protect user's privacy.
[alice@sunshine ~]$ head -4 apache_server.
log | cut -d“” -f1
YX.224.59.134
YX.224.59.134
YYP.63.193.132
YAY.247.53.103
Timestamp
Just as important is the client IP address, you need to know when a request was made to the web server.
[alice@sunshine ~]$ head -4 apache_server.
log | cut -d“ ” -f4,5
[16/Jan/2013:10:13:55 -0500]
[16/Jan/2013:10:13:55 -0500]
[16/Jan/2013:10:13:56 -0500]
[16/Jan/2013:10:13:58 -0500]
HTTP request
The HTTP request is broken up into three parts:
- The method: GET is used for requesting data and POST is used for submitting data.
- The resource (HTML page, image, PHP script, etc.) that is being requested.
- The version of the HTTP protocol used. This is normally HTTP/1.1.
[alice@sunshine ~]$ head -4 apache_server.
log | cut -d“ ” -f6,7,8
“GET /favicon.ico HTTP/1.1”
“GET /favicon.ico HTTP/1.1”
“GET / HTTP/1.1”
“GET / HTTP/1.1”
HTTP status code
The HTTP status code the server sends back to the client. “This information is very valuable, because it reveals whether the request resulted in a successful response (codes beginning in 2), a redirection (codes beginning in 3), an error caused by the client (codes beginning in 4), or an error in the server (codes beginning in 5).”2
[alice@sunshine ~]$ head -4 apache_server.
log | cut -d“ ” -f9
404
404
200
200
User Agent
The User Agent string gives you important information about the client such as browser type and version and operating system version. Note: this string is generated by the client's browser and can be modified, so don't assume this data is 100% correct. This is often used in analyzing overall usage, such as determining the percentage of users accessing a web page with a mobile device.
[alice@sunshine ~]$ head -4 apache_server.
log | cut -d‘“’ -f6
Mozilla/5.0   (Windows   NT   6.1;  WOW64;
rv:21.0) Gecko/20130115
Firefox/21.0
Mozilla/5.0   (Windows   NT   6.1;  WOW64;
rv:21.0) Gecko/20130115
Firefox/21.0
Mozilla/4.0   (compatible; MSIE 7.0; Windows
NT 6.0)
Mozilla/5.0   (Macintosh; U; Intel  Mac OS X
10_6_8; en-us)
AppleWebKit/533.21.1    (KHTML,  like Gecko)
Version/5.0.5 Safari/533.21.1
Notice that we've used a quotation mark (‘“’) instead of space (‘ ’) as the delimiter for cut. This was because the User Agent contains variable number fields separated by spaces, but it always begins and ends with a quotation mark, making the quotation mark a more reliable delimiter.
Questions
Use the knowledge you've just learned on extracting the data from the file with grep, sort, and other string manipulation commands you learned throughout the hands-on activities in the text to answer the following questions:
- How many unique IP addresses submitted requests?
- What IP address sent the most requests? Were the requests successful? How do you know?
- What is the most popular User Agent?
- How many User Agents contain the words “iPad” or “iPhone” versus “Android”?
- You've just been notified that there is suspicious activity on a machine in your network, YAY.247.114.164. Generate a list of all the resources (if anything) that were requested using this system.
- Another web server on campus has been compromised through a vulnerability in the admin utility (wp-admin) of the Wordpress blogging application. It is not known what IP address the attackers used, but you expect that they are scanning other web servers to find vulnerable copies of Wordpress. Search the web server log for any scans and determine what IP address or addresses they are coming from
CRITICAL THINKING EXERCISE–DESTRUCTION AT THE EDA (CONTD.)
Much of the incident analysis at the EDA was performed by the external contractor. Here is what the OIG report has to say about the work:
Within 2 weeks of beginning its incident response activities, EDA's cybersecurity contractor found the initial indications of extremely persistent malware were false positives – not actual malware infections. However, EDA's CIO sought guaranteed assurance that the components were infection-free and no malware could persist. External incident responders were unable to provide the assurance EDA's CIO sought, because doing so involved proving that an infection could not exist rather than that one did not exist. By April 16, 2012, despite months of searching, EDA's cybersecurity contractor was unable to find any extremely persistent malware or indications of a targeted attack on EDA's systems. Further, the NSA and US-CERT did not find nation-state activity or extremely persistent malware.
- Do you agree with the standard of defense sought by EDA's CIO – an assurance that no malware could persist on the organization's systems?
- Based on the report, what followed this finding from the contractor?
DESIGN CASE
The following is a summary of an incident you investigated for central IT.
APPSERVER1 was compromised in the evening of February 29, 2013. The hacker had access to the machine for about 1 hour. During his/her time accessing the machine, the hacker tried to access other machines within the Sunshine University network using a set of six different credentials.
The following investigative methods were used to determine the extent of the break-in:
- Extensive forensics investigation using Autopsy and Sleuthkit forensic toolkits to determine timeline of the events, locate and extract log files, backdoors, and possible keyloggers.
- Windows event logs were recovered and examined in detail.
- Inbound and outbound network connections to and from APPSERVER1 were examined as well.
- Special attention was paid to inbound and outbound traffic to the database server DB1, which holds restricted personal data for the university.
The hacker used a known password to Remote Desktop into the APPSERVER1 application front-end server. Further investigation revealed a list of credentials that seemed to have been compromised previously. The credential used by the hacker to access APPSERVER1 was the only one still valid at the time. Password expiration at the university is set to 180 days.
Timeline table
| 2/29/2013
Sunday 7:31 pm |
Initial signs of break-in, extracted from network flow logs. Off campus connection from 67.105.138.194 using Remote Desktop, registered to XO Communications and owned by Peaks and Plains Medical in Spokane, Washington. |
| 2/29/2013
Sunday 7:37 pm |
Machine is rebooted in an attempt to start a backdoor process listening on port 1034. These are usually FTP servers or bot control channels, allowing remote users to control the local machine without the need to use Remote Desktop. Sunshine University administrator is paged due to unscheduled reboot. |
| 2/29/2013
Sunday 7:39 pm |
Hacker attempts to connect to other machines within USF. Attempts were not successful. |
| 2/29/2013
Sunday 8:42 pm |
Hacker logs off the system. No additional logon attempts or hacker activity detected |
QUESTIONS
- When was the incident discovered and how?
- What critical pieces of information are missing?
- Based on what you know, what else would you consider looking into in order to make a better determination of the final consequences of the incident? Be as detailed as you can.
- What would be your recommendations for improvement?
1“How to view and manage Event Logs,” http://support.microsoft.com/kb/308427