1
Introduction
Motivation: Why Experiment?
Statistics is “learning from data.” We do statistics when we compare prices and specifications and perhaps Consumer Reports data in choosing a new cell phone, and we do it when we conduct large-scale experiments pertaining to medications and treatments for debilitating diseases.
Much of the way we learn from data is observational. We collect data on people, products, and processes to learn how they work. We look for relationships between variables that may provide clues on how to affect and improve those processes. Early studies on the association between smoking and various health problems are examples of the observational process—well organized and well executed.
The late Professor George Box (Box, Leonard, and Wu 1983; Box 2006; and in various conference presentations in the 1980s) depicted history as a series of events, some interesting, most mundane. Progress happens when there is an intelligent observer present who sees the interesting event and reacts—who capitalizes on what has been learned. Box cited the second fermentation of grapes, which produces champagne, as an especially serendipitous observation. (Legend has it that a French monk, Dom Pérignon, made the discovery: “Come quickly, I’m drinking the stars!” (Wikipedia 2015).)
Now clearly, as Professor Box argued, progress is speeded when interesting events happen more frequently and when there are more intelligent observers present at the event—“more” in the senses of both a greater number of intelligent observers and observers who are more intelligent. Experimentation—active, controlled intervention in a process, changing inputs and features of the process to see what happens to the outcome (rather than waiting for nature to act and be caught in the act)—by people with insight and knowledge offers the opportunity and means to learn from data with greater quickness and depth than would otherwise be the case. For example, by observation our ancestors learned that friction between certain materials could cause fire. By experimentation, and engineering, their descendants learned to make fire starting fast, reliable, and cheap—a mere flick of the Bic®. Active experimentation is now very much a part of business, science, engineering, education, government, and medicine. That role should grow.

For experimentation to be successful, experimental plans (“designs”) must be well conceived and faithfully executed. They must be capable of answering the questions that drive the research. Experimental designs need to be effective and efficient. Next, the experiment’s data need to be summarized and interpreted in a straightforward, informative way. The implications of the experiment’s results need to be clearly communicated. At the same time, limitations of what is learned need to be honestly acknowledged and clearly explained. Experiments yield limited, not infinite, data, and so conclusions need to be tempered by this fact. That’s what statistics is all about. This chapter provides an overview of the experimental design and statistical data analysis process, and the subsequent chapters do the details.
Steps in an Experimental Program
Planning and analysis
Learning from data: To do this successfully, data must first contain information. The purpose of experimental design is to maximize, for a given amount of resources, the chance that information-laden data will be generated and structured in such a way as to be conducive to extracting and communicating that information. More simply, we need data with a message, and we need that message to be apparent.
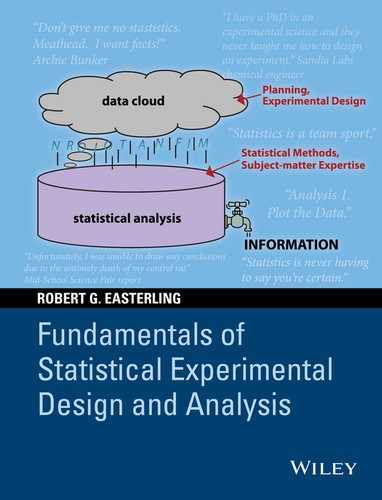
Figure 1.1 is a cartoon view of this process. There is a data cloud, from which information is precipitating. But this information may be fuzzy, indistinct, disorganized, and incomplete. The purpose of statistical analysis is to collect that information and distill it into clear, well-organized INFORMATION. But this process does not work on its own. Intervention is needed. First, if we do some cloud seeding at the start—planning studies and designing experiments—we should increase the amount and quality of precipitating information, and we should facilitate the distillation process. That is, with good planning, it should take less work to extract information from the data. Further, the distillation process needs catalysts—subject-matter knowledge, models, assumptions, and statistical methods. The aim of this text is to provide plans and analysis methods for turning ideas into experiments which yield data that yield information that translates into knowledge and actions based on our improved state of knowledge.

Figure 1.1 Statistics Schematic.
Good experimentation starts with subject-matter knowledge and passion—a strong desire to better understand natural and created phenomena. From this passion flow questions to be answered, questions that can best be posed from a foundation of subject-matter understanding. Statistics provides the tools and framework (i) for translating these questions into experiments and (ii) for interpreting the resulting data. We need to run experiments that are efficient and that are capable of answering questions; we need statistical methods to discover and characterize relationships in the experimental data and to answer whether apparent relationships are real or could easily be random. We need subject-matter knowledge and context to interpret and act on the relationships that are found in the experiments. Subject-matter knowledge and statistical methods need to be intertwined to be most effective in conducting experiments and learning from the resulting data.
Communication
Learning has to be communicated. As mentioned in the Preface, Archie Bunker, of the All in the Family TV show (check your cable TV listings for reruns), once told his son-in-law (approximately, and with typical inadvertent profundity), “Don’t give me no stastistics (sic), Meathead! I want facts!” What he meant was: talk to me in terms of the subject-matter, not in statistical jargon.

Statistics is inherently collaborative—a team sport. Successful experiments require subject-matter knowledge and passion and the statistical tools to translate that knowledge and passion into useful information. Statisticians tend to be passionate about the methods they can use to extract information from data. That’s what they want to talk about. For the collaborative professional in another field, those methods are only a means to an end: revealing and understanding new facts pertinent to his or her area of interest/passion. The experiment and resulting data advance understanding in that field, so it is essential, as Archie said, that statistical results be communicated in this context, not as “statistics” per se.
Subject-Matter Passion
An example that shows the importance of bringing subject-matter passion to the appreciation and interpretation of data is a case study I call “Charlie Clark and the Car Charts.” The statistics group I managed at Sandia National Laboratories in Albuquerque had a small library, and when we got a new addition, I would route it around to the group so they would be aware of it. One new book I routed dealt with graphical methods. Charlie Clark was both thorough and a car nut. He did more than skim the table of contents—he read the book. One chart he came across was a scatter plot of automobile engine displacement versus body weight. This plot (approximately reproduced in Fig. 1.2) showed a slightly curved positive association—heavier cars have larger engines—and a couple of outlying points. The authors made the statistical points that you could not “see” the relationship between body size and engine size, or the outliers in a table of the data, whereas a plot shows these clearly. Then they commented that the outliers might be unusual cars or mistakes in the data and went on to other topics.

Figure 1.2 Car Data: Engine Size versus Body Weight.
Well, the two outlying cars are more than just unusual to a car nut. They would be special: the outlying points are two cars with unusually large engines for their body weights. They would thus be high-performance autos, so Charlie not only noticed the outliers, he got excited. He wanted one of those cars, so he looked up the source data (provided in the book’s appendices). Alas, they were the Opel and Chevette, which he knew were performance dogs—“econoboxes.” He then went to the original Consumer Reports data source and found that transcription errors had been made between the source data and the text. Sorry, Charlie.
The moral of this story is that Charlie found the true “message” in the data (albeit only a transcription error), which is what statistical analysis is all about, not because he was a better statistician than the authors, but because he had a passionate interest in the subject matter. For more on this theme, see Easterling (2004, 2010). See also Box (1984).
Case Study
Integrated circuits (ICs), the guts of computing and communication technology, are circuits imprinted on tiny silicon chips. In a piece of electronic equipment, these ICs are attached to a board by teensy wires, soldered at each end. Those solder joints have to be strong enough to assure that the connection will not be broken if the equipment is jostled or abused to some extent in use. In other words, the wire bonds have to be reliable.

To assure reliability, producers periodically sample from production and do pull-tests on a chip’s bonds. (These tests are usually done on chips that have failed for other reasons—it’s not good business practice to destroy good product.) The test consists of placing a hook under the wire and then pulling the hook until the wire or wire bond breaks. This test is instrumented so that the force required to break the bond is recorded. A manufacturer or the customer will specify a lower limit on acceptable strength. If too many bonds break below this breaking-strength limit, then that is a sign that the bonding process is not working as designed and adjustments are needed.
Well, a process engineer showed up at Ed Thomas’s office one day with a file of thousands of test results collected over some period of time. (Ed is a statistician at Sandia National Laboratories, Albuquerque, NM.) The engineer wanted Ed to use the data to estimate wire-bond reliability. This reliability would be the probability that a bond strength exceeds its acceptable lower limit. (Although we haven’t discussed “probability” yet, just think in terms of a more familiar situation, such as the SAT scores of high school seniors in 2014. These scores vary and a “probability distribution”—sometimes a “bell-shaped curve”—portrays this variability.) The initial plan was to use the data to estimate a “probability distribution” of bond strength and, from this distribution, estimate the percent of the distribution that exceeded the lower limit (see Fig. 1.3).

Figure 1.3 Bond-Strength Distribution.
The bars are the percentages of bond-strength measurements in specified, adjacent intervals. The blue curve is a “Normal Distribution” fitted to the bond-strength data. The estimated reliability is the percent of the distribution above the lower limit.
But Ed was inquisitive—snoopy (and bright). He noticed that the data file did not just have bond-strength data and chip identification data such as date and lot number. The file also had variables such as “bond technician” and “test operator” associated with each test result. He sorted and plotted the bond-strength data for different bond and test operators and found differences. Bond strength seemed to depend on who did the bonding operation and who did the test! This latter dependence is not a good characteristic of an industrial measurement process. You want measurement process components, both equipment and personnel, to be consistent no matter who is doing the work. If not, wrong decisions can be made that have a substantial economic impact. You also want a manufacturing process to be consistent across all the personnel involved. A problem with the available data, though, was that the person who did the bonding operation was often the same person who did the test operation. From these data, one could not tell what the source of the inconsistency was. It would not make sense to try to estimate reliability at this point: you would have to say (apparent) reliability depends on who did the test. That doesn’t make sense. What was needed was further investigation and process improvement to find the source of the inconsistencies in the data and to improve the production and test processes to eliminate these inconsistencies.
After a series of discussions, the process engineer and Ed came up with the following experiment. They would have three operators each use three different machines to make wire bonds. That is, chips would be bonded to packages using all nine possible combinations of operator and machine. Then the boards for each of these combinations would be randomly divided into three groups, each group then pull-tested by a different test operator. This makes 27 combinations of bond operator, machine, and test operator in the experiment. For each of these combinations, there would be two chips, each with 48 bonds. Thus, the grand total of bond-test results would be 27 × 96 = 2592. This is a large experiment, but the time and cost involved were reasonable. These are the sorts of issues faced and resolved in a collaborative design of an experiment.

Statistical analysis of the data, by methods presented in later chapters, led to these findings:
- There were no appreciable differences among bonding machines.
- There were substantial differences among both bonding operators and test operators.
A couple of points before we look at the data: (i) It is not surprising to find that machines are more consistent than people. Look around. There’s a lot more variation among your fellow students than there is in the laptops or tablets they use. (ii) Because the experiment was “balanced,” meaning that all combinations of bonding and test operators produced the same number of bond tests, it is now possible to separate the effects of bond operator and test operator in the experiment’s data.
Figure 1.4 shows the average pull strengths for each combination of bond and test operators. These averages are averages across machines, chips, and bonds—total of 288 test results in each average.

Figure 1.4 Average Bond Strengths by Bonding and Pull-Test Operators.
The results in Figure 1.4 have very consistent patterns:
- Bond operator B produces consistently stronger bonds.
- There are consistent differences among pull-test operators—operator A consistently had the highest average pull strengths; operator B consistently had the lowest.
(Statistical number crunching showed that these patterns could not be attributed to the inherent variability of the production and testing processes; they were “real” differences, not random variation.)
Overall, in Figure 1.4, there is nearly a factor of two between the average pull strength for the best combination of operators and for the worst (9.0 vs. 5.1 g). You do not want your production and measurement systems, machines and people, to be this inconsistent.
With this data-based information in hand, the process engineer has a license to examine the production and testing procedures carefully, along with the technicians involved, and find ways to eliminate these inconsistencies.
(A friend of mine tells his audiences: “Without data you’re just another loudmouth with an opinion!” Another often-used statistical funny: “In God we trust. All others bring data.”)
The focus for process improvement has to be on procedures—not people. We’re not going to fire bond operator C because he produced the weakest bonds. We’re going to find out what these operators are doing differently to cause this disparity. It could be that they are interpreting or remembering possibly unclear process instructions in different ways. That can be fixed.
One specific subsequent finding was that it made a difference in pull-testing if the hook was centered or offset toward one end of the wire or the other. Making the instructions and operation consistent on that part of the process greatly reduced the differences among test operators. (Knowing where to place the hook to best characterize a bond’s strength requires subject-matter knowledge—physics, in this case.) Additional iterations of experimenting and process improvement led to much better consistency in the production and testing procedures.
Summary: The process engineer came to Ed wanting a number—a “reliability.” Ed, ever alert, found evidence that the (observational) data would not support a credible reliability number. Well-designed and well-executed experiments found evidence of production and testing problems, and the process engineer and technicians used these findings and their understanding of the processes to greatly improve those processes. Labor and management were both happy and heaped lavish praise on Ed.
This picture is not Ed, but it could have been. The voice-over of this celebratory scene in an old Microsoft Office commercial told us that “With time running out, he took an impossibly large amount of data and made something incredibly beautiful.” May every person who studies this book become a data hero such as this!

Overview of Text
Chapter 2 describes the basic elements of experimental design: experimental units, treatments, and blocks. (Briefly, “treatments” is statistical terminology for the interventions in a process.) Three principles that determine the precision with which treatment “effects” can be estimated—replication, randomization, and blocking—are defined and discussed.
Chapter 3 addresses the fundamentals of statistical data analysis, starting with my recommended Analysis 1: Plot the Data. In particular, plot the data in a way that illuminates possible relations among the variables in the experiment.
Next come quantitative analyses—number crunching. In my view, the fundamental concept of statistical analysis is a comparison of “the data we got” to a probability distribution of “data we might have gotten” under specified “hypotheses” (generally assumptions about treatment effects). Significance tests and confidence intervals are statistical findings that emerge from these comparisons and help sort out and communicate the facts and the statistics, in Archie Bunker’s formulation. Two two-treatment examples from Box, Hunter, and Hunter (1978, 2005) are the launching pads for a wide-ranging discussion of statistical methods and issues in Chapter 3.
Chapter 4 introduces the family of completely randomized designs for the case of one treatment factor, either quantitative or qualitative. Chapter 5 is about completely randomized designs when the treatments are comprised of combinations of two or more treatment factors.
Chapter 6 introduces the family of randomized block designs and considers various treatment configurations. Chapter 7, titled Other Experimental Design s, addresses designs that are hybrids of completely randomized and randomized block designs or that require extending the principles of experimental design beyond the scope of these design families.
And that’s it. This book is meant to be introductory, not comprehensive. At various points, I point to extensions and special cases of the basic experimental designs and provide references. Formulas are minimized. They can be found in the references or online, if needed. I rely on software, primarily Minitab®, to produce data plots and to crunch the numbers. Other statistical software is available. Microsoft Excel® can be coerced into most of the analyses in this text. I think choice of software now is equivalent to choice of desk calculator 50 years ago: at this point in time, it does not matter that much. My focus is on the experimental design and data analysis processes, including the interplay between statistics and the application, between “friendly, local statisticians” and subject-matter professionals. I try to illustrate data-enhanced collaboration as a way to encourage such approaches to the large and small issues students will face when they leave the university and embark upon a career.
Assignment
Choose one of your areas of passionate interest. Find an article on that topic that illustrates the statistics schematic in Figure 1.1. To the extent possible, identify and discuss what that article tells you about the different elements in that process: data, assumptions, models, methods, subject-matter knowledge, statistical analysis, and information generated and communicated. Evaluate how well you think the article succeeds in producing and communicating useful information. Suggest improvements.
References
- Box, G. (1984) The Importance of Practice in the Development of Statistics, Technometrics, 26, 1–8.
- Box, G., (2006) Improving Almost Anything: Ideas and Essays, John Wiley & Sons, Inc., New York.
- Box, G., Hunter, W., and Hunter, J. (1978, 2005) Statistics for Experimenters, John Wiley & Sons, Inc., New York.
- Box, G., Leonard, T., and Wu, C-F. (eds.) (1983) Scientific Inference, Data Analysis, and Robustness, pp. 51–84, Academic Press, New York.
- Easterling, R. (2004) Teaching Experimental Design, The American Statistician, 58, 244–252.
- Easterling, R. (2010) Passion-Driven Statistics, The American Statistician, 64, 1–5.
- Wikipedia (2015) Dom Pérignon (monk), http://en.wikipedia.org/wiki/Dom_Pérignon_(monk).