
CHAPTER 7
How to Think About Behavioral Finance
While Benjamin Graham is considered the “father of value investing,” he had a deep appreciation for the impact human emotions can have on stock prices. For instance, in the first edition of Security Analysis, published in 1934, Graham states, “Investment theory should recognize that the merits of an issue reflect themselves in the market price not by any automatic response or mathematical relationship but through the minds and decisions of buyers and sellers.” He also understood the importance of feedback loops, stating “the investors’ mental attitude not only affects the market price but is strongly affected by it.”1
The Moody Mr. Market
In The Intelligent Investor, first published in 1949, Graham introduces his readers to Mr. Market, an affable fellow who is your equal partner in a private business. According to Graham, “Every day he [Mr. Market] tells you what he thinks your interest is worth and furthermore offers either to buy you out or to sell you an additional interest on that basis. Sometimes his idea of value appears plausible and justified by business developments and prospects as you know them. Often, on the other hand, Mr. Market lets his enthusiasm or his fears run away with him, and the value he proposes seems to you a little short of silly.”2
Graham used Mr. Market to explain the effect he saw that the human emotions of fear and greed can have on stock prices. When the market is functioning normally, Mr. Market’s “idea of value appears plausible and justified by business developments and prospects as you know them.” In turn, the price Mr. Market offers to buy or sell will be close to the company’s intrinsic value. However, there are times where Mr. Market becomes greedy and euphoric, seeing only blue skies ahead, and offers to buy or sell at a price greater than the company’s intrinsic value. At other times, Mr. Market will be fearful, anxious, and depressed, seeing only a dismal future, and offers to buy or sell at a price less than the company’s intrinsic value. We illustrate Mr. Market’s various moods in Figure 7.1.

Figure 7.1 Mr. Market’s Various Moods
Returning to the definition of the value of an asset:
The estimated value of any asset is the sum of the cash flows expected to be produced by that asset, over its useful life, discounted for the time value of money and the uncertainty of receiving those cash flows.
We need to emphasize the word expected in the definition. Investors make their decisions based on their expectations about the future. Using this definition, we can say that under most conditions, Mr. Market’s expectations for the company’s future cash flows will be “plausible and justified by business developments and prospects.” However, there will be times when Mr. Market’s fear or greed unduly influences his expectations of future events and alters the value he places on the company. The overreaction drives the market price away from the company’s intrinsic value producing a mispricing.
Mr. Market’s misperception can affect his expectations for one or more of the four components of cash flow (duration, magnitude, timing and growth), the level of uncertainty he sees in the business, or a change in the time value of money, as we discuss in Chapter 1, and show in Figure 7.2.

Figure 7.2 Value of an Asset—Primary Components
We can use the valuation of Zoe’s Lemonade Stand from Chapter 4 to illustrate this point. As we show in that analysis, we arrive at different per share values when we assume different growth rates for the business, as illustrated in Table 7.1.
Table 7.1 Present Value of Zoe’s Lemonade Stand Under Different Growth Assumptions
| Growth Rate | Present Value of Free Cash Flows | Value Per Share |
| 0% | $1,412 | $9.41 |
| 10% | $1,796 | $11.97 |
| 15% | $2,044 | $13.63 |
| 20% | $2,336 | $15.57 |
Let’s say that the consensus expects Zoe’s revenues to grow at 15% per year, and assume that the stock is efficiently priced, thereby trading at $13.63 per share. Unexpectedly, Paris’s Lemonade Stand, which operates in the adjacent town, announces that it plans on entering the local market currently served only by Zoe. After the information is disseminated and processed, the consensus believes Paris will be successful in capturing market share and, in response, reduces its estimate for Zoe’s growth to 10% per year. Zoe’s stock falls from $13.63 to $11.97 as the market adjusts to fully reflect and incorporate the new information.
However, let’s say that Mr. Market is in a particularly gloomy mood on the day Paris announces her expansion plans and fears that the increased competition will have a significant impact on Zoe’s business, reducing the expected growth rate for Zoe’s Lemonade Stand to zero. Because of this pessimism, instead of repricing the stock to reflect a more realistic 10% growth scenario, the market overreacts and reprices the shares to $9.41.
When the Wisdom of Crowds Becomes the Madness of Crowds
As we discuss in the previous chapter, if the market processes information absent any systematic error, then the stock will be efficiently priced. On the other hand, if we can identify a systematic bias in the market, then there is a reasonable likelihood that the consensus has overreacted and produced a pricing error. However, any apparent error in the market price must be linked to either the dissemination, processing, or incorporation of information because a systematic bias that results in an error can only occur if there is a failure in at least one of the following conditions of the wisdom of crowds:
- Information is either not available or not being observed by a sufficient number of investors.
- There is an insufficient amount of domain-specific knowledge within the collective.
- The crowd lacks diversity.
- There is a breakdown in the crowd’s independence.
- Estimates are not being expressed, aggregated and incorporated into the market price.
- There is a lack of appropriate incentives.
It is important to state up front that behavioral finance can cause mispricings in only three of the six factors just listed: diversity, independence, and incorporation. As we demonstrate with the pen contest, Galton’s ox, Beatles, and Apple examples in the prior chapter, the crowd will arrive at an accurate estimate even if information is available and observed by only a small portion of individuals in the crowd. Interestingly, there are few situations in the stock market where the lack of domain-specific knowledge or insufficient incentives causes significant mispricings.
Therefore, if Mr. Market has allowed his emotions to get the better of him, the systematic bias produces an error if it either reduces the crowd’s diversity, results in a breakdown in the crowd’s independence, or produces a limitation in the crowd’s ability to incorporate its view into the stock price.
While Good for Hunting and Gathering, Evolution Has Left Us Ill-Prepared to Survive on Wall Street
To demonstrate how behavioral finance ultimately impacts Mr. Market, we need to return to the dawn of man. Anthropological data show that anatomically modern Homo sapiens originated about 200,000 years ago. However, behaviorally, we reached modernity only about 50,000 years ago. With new agricultural techniques and domesticated animals, our hunter-gatherer ancestors started to settle into what we call civilizations only 10,000 years ago. We have made great strides in developing new communications-related technologies in the last 150 years—electricity, telephones, radios, television, computers, cell phones, and the Internet—all of which have accelerated the amount of information that is available to us and that we must process. To put this technological progress in perspective, our species may be 200,000 years old, but we have lived in an information-rich society, in its modern form, for only 150 of those years. One could argue that the current volume and velocity of information available in the financial markets, and relevant to investment decisions, started only 40 years ago. Simply put, our minds have not had enough time to evolve to a point that we can effectively process the volume of information that we experience daily in order to invest successfully.
Evolutionary biology teaches us that humans have evolved to conserve energy and avoid exertion. Professor Daniel Liberman, an evolutionary biologist at Harvard University, believes that because food was in such short supply for our hunter-gatherer ancestors, only those who conserved physical energy in hard times and expended only the energy necessary to survive had the opportunity to reproduce and flourish. In other words, we are genetically programmed to be lazy. As with our bodies, we are also conditioned to be lazy with our minds, striving to minimize our mental effort, which is also known by its more academic title—cognitive load. Here, too, we have evolved to rely on mental shortcuts whenever possible.
Evolutionary psychology teaches us that humans developed conditioned reflexes, which were driven by our need for self-preservation. For example, when our ancestors on the savanna heard a rustling in the bushes, they feared for their lives and ran away, driven by fright, confusion, and stress. Those who weren’t afraid and didn’t respond quickly enough were eaten.
To survive, humans evolved different heuristics—mental “hacks” or shortcuts—to help us navigate our ancestral environment, while conserving as much energy as possible. Unfortunately, the heuristics that allowed humans to survive and flourish thousands of years ago are potentially harmful to our health in modern society and specifically our “financial health” in the stock market.
Human feelings fall into two broad categories. When our needs are satisfied, we have positive feelings—we are happy, excited, peaceful, confident, hopeful, and engaged. On the other hand, when our needs are not being met, we have negative feelings—we are angry, afraid, confused, fatigued, stressed, embarrassed, jealous, sad, and vulnerable.
Behavioral Finance Explains the Errors of Our Hunter-Gatherer Brains
These positive and negative feelings often drive individual behavior and can result in any number of cognitive biases, which are defined as mistakes in reasoning, evaluating, remembering, or some other cognitive process. In investing, these biases often express themselves as fear and greed, which can lead individuals to make suboptimal investment decisions.
Behavioral finance has flourished in the 40 years since Kahneman and Tversky first published their research and established its theoretical foundation. It is important to recognize that behavioral finance comprises two distinct, albeit interrelated disciplines: micro behavioral finance, which deals with decision making and the behavior of individuals, and macro behavioral finance, which deals with the behavior of the collective.5 Although actions of the individual can influence the actions of the collective, the relationship is not a direct one, which appears to cause a fair amount of confusion among many people.
Behavioral finance holds that investors may not always act rationally, and investment decisions may be driven more by human emotions than classical economics predicts. This insight leads many people to jump to the conclusion that because men are irrational and markets are made of men (and women),6 markets are also irrational. In turn, many individuals believe that the behaviors of individual market participants (micro behavioral finance) can be scaled up to represent the behavior of the collective (macro behavioral finance).
Individual Behavior Cannot Explain Crowd Behavior
This belief is an incorrect conclusion, however. Just as we cannot predict the direction of the economy (macroeconomics) by predicting only the behavior of individuals (microeconomics), even though the two disciplines are interrelated, we cannot predict the movements of the stock market by predicting the behavior of individual investors. The primary reason why individual behavior does not aggregate to explain group behavior is that the stock market is a complex adaptive system. The most important characteristic of complex adaptive systems is that they exhibit emergent behavior, meaning that when individual actions are aggregated, patterns emerge that cannot be predicted from analyzing individual behavior. Simply put, the whole is greater than the sum of the parts. To reiterate, we cannot predict how the collective will behave by analyzing only individual behavior.
Rather than focusing on the micro and how individuals behave, Robert Shiller, who shared the Nobel Prize with Eugene Fama in 2013 for his work on behavioral finance, focused on macro or collective behavior. In his 1981 paper “Do Stock Prices Move Too Much to Be Justified by Subsequent Changes in Dividends?” Shiller compared the volatility in stock prices to the variations in the underlying company’s dividends and found no evidence that investors acted in accordance with the efficient market hypothesis. In other words, Shiller found that stock market swings were significantly greater than could be explained by any rational economic behavior, and he uncovered a consistent pattern of excess volatility. It would logically follow that if investors’ behavior is not rational, it must be driven by feelings and emotions. Or, in other words, behavioral finance.
Shiller believes there are too many contradictions to the efficient market hypothesis for it to be considered an accurate theory and “that bubbles or other such contradictions to efficient markets can be understood only with reference to other social sciences such as psychology.”7 He defined a bubble as:
A situation in which news of price increases spurs investor enthusiasm which spreads by psychological contagion from person to person, in the process amplifying stories that might justify the price increase and bringing in a larger and larger class of investors, who, despite doubts about the real value of the investment, are drawn to it partly through envy of others’ successes and partly through a gambler’s excitement.8
Shiller believes that market movements are influenced substantially by social psychology. Instead of a crowd of rational decision makers, he sees the crowd as “investors who do not pay much attention to fundamental indicators of value”9 and who are emotionally driven by animal spirits.
It is interesting that Shiller won the Nobel Prize for his work on behavioral finance yet only mentions the work of Kahneman and Tversky twice, and then only briefly, in his 33-page acceptance lecture. Shiller’s apparent disregard for micro behavioral finance is consistent with the statement that one cannot predict how the collective will behave by analyzing the individual behaviors within the collective.
In fact, individual behavior does not matter unless that behavior produces a systematic error in the collective. And, as we discuss at length in the previous chapter, the only way errors are created in the collective is by a reduction in the crowd’s diversity or a breakdown in its independence. Individual errors offset each other if the models individuals use are diverse and will not affect the crowd error if the individuals act independently. Therefore, although individuals can, and will, make errors and may appear to act irrationally, the individual errors will cancel out each other and have no impact on the crowd’s error as long as the individual errors are not systematically correlated.

Crowd Behavior When Diversity Is Lacking
We define lack of diversity within the collective as when investors think the same way because they use the same, or similar, models to arrive at their estimates of intrinsic value. With a lack of diversity, the crowd’s view will reflect nothing more than the view of a select few or a single individual, rather than different views from multiple individuals. Under these circumstances, the crowd produces an answer that often is only a small deviation from the average individual estimate, as we show in the wisdom of the crowd examples in the previous chapter.
On the other hand, a breakdown of independence occurs when a diverse group of investors is influenced by the same external stimuli and sets aside its prior estimate or private information when expressing its views. The individuals may be diverse because they use different models to arrive at their estimate of intrinsic value, but they lose their independence when they imitate or adopt the views of other investors. In other words, diversity is a function of the variety of models used, while independence is compromised if the model outputs are systematically influenced by external stimuli. Building upon Professor Roger Murray’s analogy from Chapter 4, we show the forces introducing error as magnets pulling the consensus away from the correct answer in Figure 7.3.

Figure 7.3 Lack of Diversity and Breakdown of Independence Caused by Mayhem Produces a Mispriced Stock
We can demonstrate how diversity decreases and why it results in a mispriced stock using a simple example from Chapter 3. We show in that discussion that cash flow can be generated from either operating an asset or selling an asset. Liquidation value and Private Market Value approaches are used to determine the intrinsic value when selling an asset. Determining the intrinsic value when operating an asset is comprised of three layers: value of invested capital, value of competitive advantage (no growth), and value of incremental growth, as shown in Figure 7.4.

Figure 7.4 Approaches to Determine Intrinsic Value
Each valuation method (or layer) produces a different range or distribution of intrinsic value estimates, as shown in Figure 7.5. We will let each of the five different valuation types represent a different “model” for the discussion and assume 20% of the crowd uses each “model” exclusively to calculate their intrinsic value estimate.10

Figure 7.5 Distributions of Intrinsic Value Estimates Based on Different Investor Valuation Models
We derive an estimated liquidation value for Sevcon within a range of $0.50 to $3.00 per share in Chapter 3, with the most likely liquidation value being $1.50, as we show in Figure 7.6. As a reference, the stock was trading at $7.60 at the time of this analysis.

Figure 7.6 Sevcon: Range of Estimated Liquidation Values
Let’s assume that Sevcon announces to the market that it lost an important customer. If, based on this news, Mr. Market becomes fearful, anxious, and depressed, he would likely assign a low value to the company, perhaps nothing more than its liquidation value. If the 80% of the market participants using one of the other models to value the company begin to think that the lost customer could be the beginning of a trend and all shift to valuing Sevcon using the same liquidation model, then a systematic bias will have emerged and the stock would fall from its price of $7.60 to its estimated liquidation value of $1.50. The crowd will have lost its diversity as investors are now all using the same model and calculating Sevcon’s intrinsic value the same way.
Assume that you had followed the company for a number of years. You thought the stock was fairly valued at $7.60 based on your estimate of Sevcon’s Private Market Value, which is the model you use in your analysis. You are also aware that Sevcon lost a key customer and incorporate the new information into your valuation model. Your revised estimate of intrinsic value is now $5.45 per share. If you have confidence that your analysis is correct, then Mr. Market’s reaction creates a mispricing and an opportunity for you, as shown in Figure 7.7. Although your estimate of the company’s intrinsic value dropped from $7.60 per share to $5.45 per share, the market price has declined from $7.60 to its current price of $1.50. Given your estimated value of $5.45, purchasing the stock at $1.50 will seem like a bargain.

Figure 7.7 Intrinsic Value Estimate Before and After Customer Loss
However, it is important to note that although the crowd has lost its diversity that alone does not mean that a mispricing exists. The paragraph above contains an important qualifier, “If you have confidence that your analysis is correct.” The implication is that, in your opinion, the consensus is wrong. To you there appears to be a genuine mispricing and the stock seems “like a bargain.” The crowd’s bias may have created a mispricing, but then again, that is not a foregone conclusion just because of the crowd’s lack of diversity.
The extreme price move is also illustrated in Figure 7.8.

Figure 7.8 Mr. Market Overreacts
Although the Sevcon example is overly simplistic, it reflects the fact that the market is comprised of different constituents. In the real world, there are investors who are long-term oriented and others who are focused on the short term. There are investors who focus on technical analysis, quantitative investors, or fundamental analysis. The investors in each of these investment disciplines often think alike and use similar models to generate their estimates of intrinsic value. For example, fundamental investors value companies based on metrics such as price to book or price to cash flow, while investors who practice technical analysis focus on trading metrics such as comparing the stock’s 200-day moving average with its 50-day moving average. Growth investors focus on sales or earnings growth and use metrics such as price to sales or earnings momentum. When the shareholder base is diverse and includes investors following different disciplines, most often the collective is wise and the stock will be efficiently priced. If, on the other hand, the shareholder base lacks diversity and is comprised mostly of investors from a single group, the collective is less wise and the stock less efficiently priced. While this statement is an oversimplification, we can use it to make an important point about investor diversity.
There have been many situations in the real world where crowding or herding among investors exists in an individual stock or market sector, resulting in a lack of diversity among the market participants in that particular area of the market. Because most of the market participants in these situations are using similar models in their analysis, a small, seemingly innocuous event can trigger a stampede, causing Mr. Market to become manic. We want to emphasize that an “appropriate” reaction to an event by an otherwise diversified shareholder base can easily turn into an overreaction to the same event when the shareholder base lacks diversity.
One such incident was the Quant Crisis of 2007. Quantitative investors use computer models to identify patterns in securities prices and then buy or sell thousands of different securities to capture small mispricings. It has been an enormously successful strategy over the years and has made billionaires of investors like James Simons of Renaissance Technologies, Ken Griffin of Citadel, and Cliff Asness of AQR Capital. However, sometimes a successful strategy breaks down and causes pandemonium.
Several large hedge funds and proprietary trading desks on Wall Street began losing billions of dollars over a matter of a few days in early August 2007 and no one knew exactly why. Because the majority of these funds were implementing a similar strategy (using the same models) and employing significant amounts of leverage, many of them received margin calls simultaneously when prices started to decline (the securities they held were the collateral for their loans) and were forced to sell at least some of their holdings. Unfortunately, because many of the portfolios were similarly constructed, the margin calls created a ripple effect, and the selling begat more selling, which resulted in a “death spiral” in many of the widely-owned assets.
In his excellent book The Quants, Scott Patterson describes events during those days in August that seem more fitting for a John Grisham suspense novel than a Wall Street trading desk. The following are a few excerpts:
The market moves PDT and other quant funds started to see early that week defied logic. The fine-tuned models, the bell curves and random walks, the calibrated correlations—all the math and science that had propelled the quants to the pinnacle of Wall Street—couldn’t capture what was happening. It was utter chaos driven by pure human fear, the kind that can’t be captured in a computer model or complex algorithm. This wasn’t supposed to happen! [emphasis original]
The quants did their best to contain the damage, but they were like firefighters trying to douse a raging inferno with gasoline—the more they tried to fight the flames by selling, the worse the selling became. The downward-driving force of the deleveraging market seemed unstoppable.
It made no sense. A true believer in market efficiency who’d studied under Eugene Fama at Chicago, Rothman expected the market to behave according to the strict quantitative patterns he lived to track. But the market was acting in a way that defied any pattern Rothman—or any other quant—had ever seen. Everything was losing money. Every strategy was falling apart. It was unfathomable, if not outright insane.11
Crowd Behavior When Information Cascades: The Breakdown of Independence
While similar to a lack of diversity, a breakdown of independence has subtle but important differences. Although members of the crowd might use different models to arrive at their own independent estimates, thus preserving the crowd’s diversity, a breakdown of independence occurs when some external influence causes them to alter or set aside their original estimate. This phenomenon is known as an information cascade.
This subtlety bears repeating to ensure clarity. When there is a breakdown of independence, individuals fixate on some external factor, set their model aside, and follow the crowd.
In Chapter 6, we defined private information as an individual’s knowledge of facts and experiences that represents their domain-specific knowledge and forms their information processing model, which we show in Figure 6.6 and reproduce in figure 7.9:

Figure 7.9 Domain-Specific Knowledge Is Comprised of Facts and Expertise That Form an Individual’s Processing Model
As we mention throughout the book, each investor has their own unique private information, which impacts their estimate of intrinsic value. If the investor arrives at their estimate without any bias, then their estimate is said to be independent. Absent a genuine informational advantage, however, the investor’s private information is usually imperfect. Consequentially, the investor might not have a high degree of confidence in the accuracy of their estimate.

The classic example of an information cascade involves choosing where to eat when traveling to a city you don’t know well. Imagine you are planning on spending a few days in London on business. You have never been to London before and would like to find a nice restaurant for one of your dinners. Before leaving on your trip, you research options by reviewing the Michelin guide and reading online Yelp reviews. You arrive in London, drop your bags at your hotel, and head out to dinner. As you approach the restaurant you chose through your research, you see that it is empty. When you look at the restaurant next door, however, it is packed and looks like a nice place to eat. At that instant, you change your plans and select the new restaurant for dinner without any additional research or information. What you have done is set aside the private information you obtained from your earlier research in response to observing the actions of other individuals. An information cascade will unfold if other people decide to eat at the crowded restaurant for the same reasons you did when you made your impromptu decision.
We can illustrate how information cascades occur in the stock market with another simple example. Bob is an investment adviser and manages separate accounts for high-net-worth individuals on a discretionary basis.12 Bob closely follows Biotech Inc., a company that is developing a drug for neon nose syndrome. The company is currently waiting for the results of the FDA Phase II trials for their drug. After talking with several doctors and patients aware of the trial, Bob believes the drug is effective and will get Phase II approval. He purchased Biotech’s stock in 20 of his client accounts at an average price of $15.37. A few weeks later the stock price has increased to $17.04.
Judd is a well-known and highly regarded biotech investor. He appears regularly on CNBC and has an impressive investment record. Since Judd is a successful investor, many market participants track his fund’s holdings through its 13G filings.13 Bob notices in a new amended 13G filing with the SEC that Judd’s firm no longer holds a position in Biotech Inc., which shocks Bob because he knows Judd’s fund previously owned 6.2% of the company’s shares.
Bob’s heart sinks as he infers that if Judd’s fund sold its Biotech Inc. stock, Judd must believe that the company will not get FDA approval for its neon nose drug. If the drug is not approved, Biotech stock could easily fall in half to $8.50, or possibly even lower. Since Bob’s accounts own a lot of the stock, he panics and sells the shares for his 20 clients pushing Biotech Inc. stock down from $17.04 to $16.23 in the process. He also notices that there are postings on Twitter also speculating that if Judd’s fund sold its Biotech Inc. position, it signals that the company is unlikely to get FDA approval. Reading the negative Tweets further reinforces Bob’s decision. By the time the market closes a few hours later, Biotech Inc.’s stock has traded down to $13.78 on seven times the average daily volume.
This series of events is the beginning of an information cascade. Bob does not know what private information Judd has, although he infers Judd’s knowledge from the 13G filing. Bob set aside his private information (his estimate) and imitated (what he thought was) Judd’s decision to sell the shares.
Bob’s clients, who have been watching the trading in Biotech Inc. stock, receive trade confirmations in the mail prompted by Bob’s sales of Biotech Inc. Randi, one of Bob’s clients who works at a rival biotech company and is familiar with Biotech Inc.’s neon nose drug, notices Bob sold the stock in her account. Randi hired Bob to manage her money because she thinks he is smart and respects his judgment. She, too, has been following Biotech Inc.’s progress for a while and thought the drug would get FDA approval. She agreed with Bob’s original analysis of the company’s potential, but now has doubts.
Randi also invests her money on her own. She notices that Biotech Inc. declined $3.26 on the day to close at $13.78 on significant trading volume. The next morning, she decide to sell short some Biotech stock in her own account the thinking the price will continue to fall further. The information cascade continues. Randi assumes that Bob has good private information as expressed by the stock sales in her account. This was “confirmed” by the significant decline in the stock price. Randi thinks that “smart” investors must know something that she does not know about the company’s Phase II trial, so she sets aside her private information and imitates Bob and the rest of the traders in the market.14
The only way information can be expressed, aggregated, and incorporated into the stock price is through trading. Therefore, although investors have no way of knowing the private information prompting the stock trades, they see the actions of other investors (as evidenced by the decline in Biotech Inc.’s stock price) and infer that the sellers have better private information. It is important to note that the information conveyed by the stock decline might not have been accurate. As every seasoned investor knows, just because someone sells a stock does not mean they have better information. Paul S. remembers one of Chuck Royce’s comments after witnessing a large move in a particular stock, “Someone either knows something or thinks they know something.”
The price decline in Biotech Inc. stock caused individuals to doubt their independent analysis. Bob and Randi both set aside their private information and imitated other investors. And, as a result, there was a breakdown in the crowd’s independence.
We also saw that there was a feedback loop. As Biotech Inc.’s stock declined in value, the trades reinforced everyone’s conviction that someone must know something to justify the lower stock price. Most investors thought that if the stock was falling ahead of the FDA announcement, other investors must have information that indicated that the company would not get approval. However, as it turned out, the market signal was false—it was noise. Investor selling pushed the price lower, but the lower price conveyed false information to the market participants. The cycle became a positive feedback loop based on noise, not better information. No one really knew anything, although everyone thought that someone must know something.
If Bob and Randi remained independent, they would have ignored the noise and stuck with their original decision, which was based solely on their private information. However, because they lacked conviction in their original assessment, they set aside their estimate (private information) and adopted the actions of other investors they thought had better information, which created the information cascade.
Biotech Inc. announced a week later that it had passed Phase II FDA trials. The stock closed that day at $24.55, up sharply from the prior day’s closing price, and significantly higher than the prices where Bob and Randi sold their shares. Judd happened to be on CNBC that day and the reporter asked why he had sold Biotech Inc. stock prior to the company’s positive announcement. With a look of surprise, Judd exclaimed, “We didn’t sell.” The reporter referenced the amended 13G filing. Judd responded, “Oh. I see the confusion. No, we didn’t sell. My partner and I decided to part ways and we each took half of the assets into our new funds. We did this as an in-kind distribution, so there was no trading involved. Each of our funds now own 3.1% of Biotech Inc., so are we no longer required to file with the SEC since each fund owns less than 5%. We did have to update our filing as the old fund was dissolved and as a result, held no stock. I guess the view from the outside was that we sold our entire position.”
For a brief instant, a look of deep thought was apparent on Judd’s face. Then he said to the announcer, “You know, that explains a lot. I was wondering why Biotech stock fell so much last week. I didn’t even think about our 13G filing as a possible explanation. People must have thought we sold. That’s funny. When I saw that the stock was down a lot, my first reaction was fear. We had confidence in our research and thought that the move in the stock was just noise, but it is hard to stick to your guns when the market appears to be telling you that you are wrong. We used the sell-off as an opportunity to add to our position and wound up making a ton of money.” Judd sat back and laughed, saying, “Wow, if I panicked and sold the stock because of the move, I would have been reacting to the noise my filing produced without even knowing it!”
Is the Crowd’s Apparent Madness Irrational?
The lack of diversity and breakdown of independence are both examples of investor herding or crowding.
It should be noted that herding is not irrational behavior per se. It can be normal and rational for an individual to imitate other people when making a decision if that individual believes the other person has better information.
Back to the example of the restaurant in London. You completed your research and selected a restaurant for dinner. However, as you approach the location you see that the restaurant you chose is empty, while the one next door is packed. As you peer through the window of the packed restaurant you think, “Those people seem normal and they look like me, yet they chose this restaurant over the one I selected originally.” Your instinct is to conclude that they must have better information than you do, and that if you had the same information, you would arrive at the same decision they did. Maybe the chef left the restaurant you chose but that information was unavailable when you did your research? Or, maybe someone got sick eating at the restaurant a few days prior to your visit and there was a story in the local newspaper that you did not see.
Does it seem irrational to set aside your private information and follow the crowd given the possible scenarios described above? No, it does not. Is it the right choice? Maybe, maybe not. The crowd in the other restaurant could be wrong.
The world of investing is no different. In the example with Biotech Inc. stock, we could have altered the storyline slightly and the 13G filing for Judd’s fund could have been an actual sale of stock triggered by new information that Judd received. Bob and Randi made what turned out with hindsight to be the wrong investment decision, but their decision was not irrational.
“Following the leader” is a normal human behavior. Individuals often feel safer in a crowd, a sentiment captured in the classic quote by John Maynard Keynes, “Worldly wisdom teaches that it is better for reputation to fail conventionally than to succeed unconventionally.” It is when imitation is taken to an extreme, or when the imitation is based on noise rather than information, that information cascades can cause a breakdown of independence. Again, this is not irrational behavior.
Shiller also believes that investors are not behaving irrationally in these situations, as he states in his Nobel lecture:
My definition puts the epidemic nature, the emotions of investors, and the nature of the news and information media at center of the definition of the bubble. Bubbles are not, in my mind, about craziness of investors. They are rather about how investors are buffeted en masse from one superficially plausible theory about conventional valuation to another.15
Shiller asserts that the news and information media influence the crowd systematically, and the ensuing herd behavior likely produces an inefficient stock price. In the extreme, the collapsing of diversity or breakdown of independence can cause a mania or bubble, driven by greed, when everyone believes an overly optimistic view of the future, or a panic or crash, driven by fear, when the crowd believes a doomsday scenario is likely to unfold.
How Can Fama and Shiller Both Be Right?
At first glance, it might seem odd that Fama and Shiller jointly won the Nobel Prize despite having radically opposing views on market efficiency. How can Fama and Shiller both be right?

Daniel Richards, chair of Tufts University’s economics department (Fama attended Tufts as an undergraduate), summed up the Swedish Academy’s decision perfectly:
The three-way award combination is brilliant. Fama shows why markets are efficient, Shiller shows why they are not, and Hansen provides econometric tools to show why both are right.16
One must assume that the Nobel committee believed the two theories coexist, which is reflected in Professor Per Krusell’s remarks during the announcement of the 2013 Nobel Prize winners: “The current understanding of asset prices relies in part on rational investors and their concerns about risk and in part on psychology and behavioral finance.”17
The committee elaborated further in the Nobel Prize announcement by stating that under the rational investor model:
Investors rationally calculate what assets are worth. Thus, an asset’s value should be based on the payment stream that it is expected to generate in the future. A reasonable assumption is that these payments are discounted: in other words, payments in the distant future carry less weight than more immediate payments.
The committee also stated that another way is to
Abandon the notion of fully rational investors. Moving beyond this assumption has a new field referred to as ‘behavioral finance.’ Here, mistaken expectations are at center stage: high asset prices may reflect overestimates of future payment streams. In other words, excessive optimism or other psychological mechanisms may help to explain why asset prices deviate from fundamental values.18
These comments imply that the Nobel committee believes assets are priced using a discounted cash flow model, although there will be times when asset prices will deviate from fundamental values driven by human emotions.

The 2013 Nobel award states clearly that the committee believes that Fama’s efficient market hypothesis and Shiller’s views on how human behavior produces inefficiencies are complementary and not mutually exclusive, as many investors and academics alike seem to believe.
The Magnetism of the Efficient Market Hypothesis
Ben Graham discussed this dichotomy in the Intelligent Investor when he stated, “In the short run, the market is a voting machine but in the long run, it is a weighing machine.”19 With this statement, Graham implies that the market can be swayed by human emotion, creating a temporary mispricing, although the market tends to settle at the correct price over time.
Roger Murray discussed the same concept in a slightly different way during his 1993 lectures at the Paley Center20 in New York City when he stated, “It is security analysis,21 after all, that makes the market efficient, and because all of us have worked so hard at that process, we have brought any notion of value, any notion of market pricing together. And you and I cannot possibly improve the market’s capacity to estimate the future profitability of an investment.” Murray thought of the security analysis process “as a magnet—a drawing together of market prices towards some notion of an underlying value which has some real substance to it.” He states further, “If you prefer, you can call it towards intrinsic value or you can call it regression to the mean, which implies, to some extent at least, that the intrinsic value is the true, underlying, central tendency in the valuation of an enterprise, an industry or a class of securities.”22 Murray’s implication is that while stock prices can deviate from their intrinsic value in the short run, they are drawn back to that value by market forces over time.
Intrinsic Value Acts as an Electromagnet
Expanding on Murray’s magnet analogy, we can think of market efficiency as an electromagnet that draws the stock price toward the true economic or intrinsic value of the underlying business, while thinking of behavioral finance as a different magnet, powered by human emotions, that pulls the stock price away from its intrinsic value.23
All one needs to construct an electromagnet is a nail, a battery, and some wire, as shown in Figure 7.10.

Figure 7.10 Homemade Electromagnet
We can demonstrate the magnetic effect market efficiency has on stock prices, and how the efficient market hypothesis and behavioral finance coexist, using a few simple examples. Imagine we place a ferromagnetic emoji ball bearing inside the distribution curve in Figure 7.11 and position an electromagnet at the curve’s apex to represent market efficiency’s pull. The graphic shows that the electromagnet holds the emoji at the top of the curve, where price equals intrinsic value, representing that the market is functioning without error and there is no mispricing.

Figure 7.11 The Electromagnetic Pull of Market Efficiency
The Pull of Systematic Error
However, when the wisdom of crowds is not functioning properly because some type of systematic bias has created an error, behavioral finance has entered the picture, pulling prices away from their intrinsic value. When investors become overly optimistic or pessimistic, their independence and diversity declines and the correlation of their estimates increases, which drives the stock to a premium or forces it to a discount to intrinsic value, as shown in Figure 7.12. It helps to visualize biased investor behavior as strong magnets, pulling the ferromagnetic emoji ball down the curve and away from the electromagnet of intrinsic value.

Figure 7.12 Mayhem’s Bias Pulls Stock Price Away from Intrinsic Value
The pricing error can be corrected in two ways. First, unbiased investors could enter the market to exploit the profit opportunity and correct the mispricing, in effect diluting the biased consensus. We can think of these investors entering the market as the equivalent of turning up the power on the electromagnet at the top of the distribution curve (where the price equals intrinsic value). This action overpowers the magnets representing the behavioral bias and pulls the stock back to its intrinsic value, as shown in Figure 7.13. The other way the mispricing could correct is if the bias dissipates or recedes. In the magnet analogy, this action would be equivalent to the behavioral bias magnets losing their strength. Often mispricings are corrected by a combination of the two forces.

Figure 7.13 Non-Biased Electromagnets Overpower While Bias Weakens and Stock Returns to Its Efficient Price
Albeit overly simplified, the description illustrates how the efficient market hypothesis and behavioral finance together influence the movement of stock prices. A stock will be efficiently priced unless some type of systematic bias, driven by human emotions, pulls the price away from its true value, as shown in the various charts. Again, even if the consensus is wrong, as we discussed previously, a systematic bias does not automatically mean that there is a pricing error.
The Extreme Pull of Excessive Fear and Greed
Mr. Market’s overreactions will result in crashes and bubbles when taken to an extreme. Shiller describes the snowball effect of a bubble by stressing that it starts with a price increase, which spurs investor enthusiasm, and spreads like a contagion from person to person, becoming amplified in the process and sucking in more and more investors. This description echoes Graham’s observation that, “the investors’ mental attitude not only affects the market price but is strongly affected by it.”24
In a mania or bubble, greed overwhelms fear and investors become overly optimistic. Conversely, in a panic or crash, fear overwhelms greed and investors become overly pessimistic. During these episodes, stock prices move away from their true intrinsic value and valuations expand to large premiums or contract to significant discounts, as the stock prices become detached from the business’s underlying fundamentals. Market efficiency is cast aside as the crowd’s fear and greed take over. Effectively, the magnetic pull of these emotions temporarily overwhelms the power of the efficient market electromagnet. At that moment, the biased magnets are stronger than the unbiased electromagnet and pull the emoji far away from the company’s true intrinsic value, down into the tails of the curve, as shown in Figure 7.14.

Figure 7.14 Biased Behavioral Magnet Overpowers Unbiased Electromagnet of Market Efficiency
Overwhelmed by fear or greed in these situations, investors begin to think alike, group intelligence becomes groupthink, information cascades and the wisdom of crowds is lost, as the madness of crowds takes over.
In some extreme cases, such as the Internet bubble in 2000 and the 2008 financial crisis, investors get so carried away that their collective emotions overpower the unbiased electromagnet, preventing the emoji from returning to its intrinsic value. The unemotional traders simply do not have enough capital or fortitude to offset the impulsiveness and strength of the emotional crowd, as shown in Figure 7.15.

Figure 7.15 Underpowered Unbiased Electromagnet Cannot Correct Extreme Behavior Pull
Bubbles Eventually Burst and Crashes Eventually End
Eventually, some event occurs, the bubble breaks, or the panic ends, and investors are snapped out of their manic state. The force of the biased magnets fades, releasing their grip. Investor independence and the crowd’s diversity returns, and stock prices begin to drift (or snap) back toward intrinsic value, as shown in Figure 7.16.

Figure 7.16 Unbiased Electromagnet Ultimately Overpowers the Biased Behavioral Magnets and Stock Returns to an Efficient Price
Despite the Nobel Committee’s decision to recognize both theories in the same year, blending the theories of behavioral finance with the efficient market hypothesis may still appear to be heresy to many academics and most practitioners. However, the merged theory provides us with a more effective mental model to proceed with in the discussion. It is important to note that the overwhelming evidence supports the claim that the efficient market hypothesis is the prevailing force most of the time, although in “normal” market conditions, behavioral finance will skew pricings with some frequency. On the rare occasion, during extreme times of manias and panics, when investor emotions take over and create systematic errors, behavioral finance gets the upper hand.
Between “perfect” market efficiency at one extreme and manias and panics on the other, there is a blending of the two forces. The blue area in the middle of Figure 7.17 represents the efficient market hypothesis at its strongest, while the red area on either ends of the curve shows where behavioral factors have the stronger pull. As we discuss earlier, stock prices rarely deviate far from their intrinsic value; however, on some occasions, investor behavior creates a systematic bias that takes control, causing the discounts or premiums to intrinsic value to go to an extreme.

Figure 7.17 Market Efficiency and Behavioral Finance Coexist
Limits to Incorporation: When the Crowd Cannot Act
The third tenet of market efficiency states that for the stock to be efficiently priced, information must be expressed, aggregated, and incorporated into the market price by a sufficient number of investors, which only happens when investors trade the stock and affect the market price. Investor opinions must be expressed and aggregated without significant impediments for the market price to incorporate the information and satisfy the third tenet.
Even if the first two tenets of market efficiency are met—the information is adequately disseminated and then processed absent any systematic error—an inefficiency can result if the estimate is not incorporated into the price through trading.
What impediments might exist that would prevent an investor from trading? The Nobel committee termed these as “institutional constraints and conflicts of interests.” These impediments fall into two broad categories, which in both cases prevent an investor from taking or holding a position. The first category is referred to as liquidity constraints, which can limit an investor’s ability to execute a trade. The second category relates to anticipated or actual redemptions from clients that prevent an investor from taking a position in the first place or holding a position long enough for the gap between the market price and their estimate of intrinsic value to close.
When making a buy or sell decision, most investors want to execute the trade immediately. The problem is that buyers and sellers are not always in the market at the exact same time, willing to transact the same number of shares, at the same price. A stock is considered liquid when these three factors—time, price, and number of available shares—all line up, allowing investors to fill their order without moving the stock price. Conversely, a security is considered illiquid if filling the order would cause the stock price to move.
With a liquid stock, such as Apple, where there are a large number of buyers and sellers, the bid/ask spread is usually small as we saw when we looked up the stock price on April 28, 2016.
The quote in Figure 7.18 implies that a trader could buy 200 shares at $97.22 or sell 200 shares at $97.21. The bid/ask spread is only a penny, or 0.01% of the security’s price. Apple’s daily trading volume averaged roughly 36 million shares at the time of this analysis, which equals about $3.5 billion worth of stock traded each day.

Figure 7.18 Apple, Inc.: Price Quote
Looking at the market for Associated Capital stock on the same day, the bid/ask spread also does not appear to be large, as seen in Figure 7.19.

Figure 7.19 Associated Capital Group: Price Quote
The quote in Figure 7.19 implies that an investor could buy 400 shares at $30.05 or sell 1,100 shares at $30.02. The bid/ask spread is $0.03, or 0.10% of the security’s price. While this amount is 10 times Apple’s spread of 0.01%, it is still relatively small. However, the average daily trading volume at the time was approximately 21,000 shares, or only $631,000 worth of stock traded each day.
We use Associated’s adjusted book value per share of approximately $40 (at the time of this writing in April 2016) as a proxy of the company’s intrinsic value for this discussion. If an investor could buy the stock at the offer price of $30 and have confidence that it is worth $40, he would be purchasing the stock at a 25% discount to his estimate of intrinsic value.
However, Associated’s stock is not very liquid, as the daily trading volume suggests. For instance, if an investor manages a $2 billion fund and limits himself to 20 individual positions, he would need to own, on average, $100 million of each stock to have it be considered a full position in his portfolio. However, $100 million of Associated stock is over 3.3 million shares, and the stock trades only 21,000 shares per day an average. Considering there are roughly 250 trading days per year and assuming the fund could buy half the daily trading volume, it would take approximately 315 trading days, or a year and three months, for the investor to accumulate a full position. More important, an investor cannot buy enough stock at the offer price of $30.05 to fill his position, as it is highly unlikely that there would be a seller large enough to match his trades. In reality, it is doubtful the investor could buy that much stock at $35, or even at $40 per share.
Therefore, despite the appearance that the stock is trading at a significant discount to its intrinsic value, the typical manager of a $2 billion fund holding 20 positions would not even bother doing research on Associated because he knows he will not be able to acquire a full position in the stock. On the other hand, if the same manager wanted to buy $100 million of Apple stock, he could probably do so within an hour without moving the stock’s price. This example highlights the cost of illiquidity.

The second impediment to incorporation is the ability to take or hold a position. Even if a manager thinks a security is trading at a significant discount and expects the price to eventually converge to its intrinsic value, the path to get there is rarely a straight line.
Most portfolio managers invest other people’s money, not just their own. This situation creates a principal/agent problem.25 The client (the principal) has limited knowledge and understanding about the portfolio manager’s (the agent) strategy. If the manager’s portfolio begins to lose money, significantly underperforming the market, the client will begin to worry that the manager does not know what he’s doing, will not give the manager more money, and will probably begin to consider redeeming his investment in the fund.
For example, say a portfolio manager knows, with 100% certainty,26 that XYZ Corp.’s stock will be worth $26 per share in a year. He purchases the stock at $22 (Figure 7.20), expecting to make an annualized return of 18.2%.

Figure 7.20 Client Invests in Funds
Unfortunately, XYZ stock declines to $17 over the next six months, resulting in an unrealized loss of 22.7%. For simplicity, let’s say that the investment is in XYZ Corp, is the portfolio’s only position. Assuming that the overall stock market has not changed during the same six months, the portfolio will have underperformed the market considerably during the period, losing 22.7% of its value relative to its benchmark (Figure 7.21).

Figure 7.21 Client Sees Fund and Stock Down 22.7%
The manager receives a call from a client who has just reviewed his June quarterly letter reporting the fund’s weak six-month performance. The client proceeds to chew out the portfolio manager and calls him an idiot for investing in XYZ. The manager calmly explains that he knows XYZ stock will be $26 by year-end, which now is only six months away, and tells the client he should give him more money to invest. The manager points out that if the fund could purchase more stock at the then current price of $17, the expected return on these new purchases would be 52.9% over the next six months. Instead, the client panics, gets angry, and demands his money back, threatening to sue if the manager does not comply with his request. To meet the redemption, the portfolio manager is forced to sell, rather than buy, the stock at $17, realizing an actual, rather than a paper, loss of 22.7% (Figure 7.22).

Figure 7.22 Client Redeems Investment
We would say that the client has weak hands because he panicked and redeemed his investment when he should have bought more stock. Conversely, an investor with the fortitude and capital base to persevere is said to have strong hands. Because this story is a common occurrence in the investment business, fund managers rightfully fear redemptions and often limit the size of their positions, or do not initiate some positions at all, with this concern constantly in mind. Even if the manager has excess cash, he will probably not purchase more stock when it hits $17 despite the very attractive potential return. Rather, the manager will most likely husband the cash in case he receives redemption requests from panicked clients.
If capital is controlled by weak-handed investors, when coupled with the fear of redemptions, investors might not have enough conviction and/or capital to close the gap in these situations, even when security prices deviate significantly from their intrinsic value. To repeat the overquoted John Maynard Keynes: “Markets can remain irrational a lot longer than you and I can remain solvent.”
The main takeaway from this discussion is that managers with permanent capital, such as Warren Buffett’s Berkshire Hathaway, Mario Gabelli’s Associated Capital, Bill Ackman’s Pershing Square Holdings, Joel Greenblatt’s Gotham Partners, Michael Price’s MFP Investors, Carl Icahn’s Icahn Enterprises, and Dan Loeb’s Third Point Re, to name a few, have a significant advantage over other fund managers because they can invest without worrying about their investors pulling the rug out from under them at the worst possible moment. With captive capital, these investors are the strong hands in the market.
The Efficient Market Hypothesis Remains “King of the Hill”
To address the question, “Is the market efficient?” we must realize that no model is perfect. Fama reaffirms this insight in his 1998 paper: “Like all models, market efficiency is a faulty description of price formation.”27
The main question we continue to ponder is, “Are the exceptions to the efficient market hypothesis highlighted by academics, in favor of behavioral finance, large enough that it makes sense to reject the theory completely?” We believe the answer is no. In fact, Richard Thaler, a well-known proponent of behavioral finance, had an interesting response when asked the question, “How can behavioral finance help us consistently beat the stock market?” He responded with an unequivocal, “Two words . . . it can’t.”
Even if we ignore Thaler’s comment, we can ask, “If we discard the market efficiency hypothesis, is there a better model of market behavior to replace it?” We believe that the answer to this question is, as of today,28 not yet. Fama raises an excellent point in the next sentence from his article, “Following the standard scientific rule, however, market efficiency can only be replaced by a better specific model of price formation.” Since no such model yet exists, the efficient market hypothesis remains the king of the hill. Nonetheless, the fact remains that there are anomalies in the market that can, and will, persist.
Although we know that Fama’s efficient market hypothesis is less than perfect, we are reminded of Winston Churchill’s famous quote about democracy, “No one pretends that democracy is perfect or all-wise. Indeed, it has been said that democracy is the worst form of government except all those other forms that have been tried from time to time.”29 To echo Churchill’s democracy quote, although the efficient market hypothesis is not perfect, it remains the best overall description of how the stock market functions.

Figure 7.23 Fama and Shiller Are Both Right!
Why Do We Care About Market Efficiency?
We care about market efficiency because, ironically, we need the markets to be efficient to generate alpha. If we can identify an error, such as a temporary inefficiency or mispricing, the only way for that mistake to be corrected is if the market is eventually efficient. The market must realize it has made a mistake and then correct that mistake for investors to generate alpha and outperform. The alternative view would be a market where a mispricing could persist forever. In such a world, no one could reliably outperform.
If we can identify information that has not been properly disseminated, a situation where diversity or independence has been compromised by some type of systematic error, or where there are impediments to incorporation, there is potentially a mispricing we can exploit. For this reason, understanding how market efficiency works and, perhaps more important, when the rules become distorted or even break can help investors determine where to look for mispriced securities, how they might be able to get an edge over other investors, and when to exploit those advantages.
Gems:
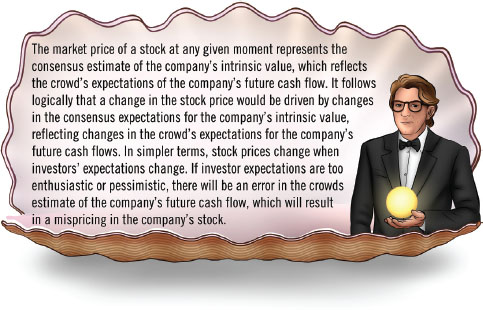
- The market price of a stock at any given moment represents the consensus estimate of the company’s intrinsic value, which reflects the crowd’s expectations of the company’s future cash flow. A change in the stock price is driven by changes in the consensus expectations for the company’s intrinsic value, reflecting changes in the crowd’s expectations for the company’s future cash flows. In simpler terms, stock prices change when investors’ expectations change.
- If the market processes information absent any systematic error, then the stock will be priced efficiently. On the other hand, if there is a systematic bias in the market resulting in an error, then there is a reasonable likelihood that the consensus has overreacted and produced a mispricing. However, any apparent mispricing must be linked to the dissemination, processing, or incorporation of information because a systematic error can only happen if there is a failure in one of the following conditions of the wisdom of crowds:
- Information is either not available or not being observed by a sufficient number of investors.
- There is an insufficient amount of domain-specific knowledge within the collective.
- The crowd lacks diversity.
- There is a breakdown in the crowd’s independence.
- Estimates are not being expressed, aggregated and incorporated into the market price.
- There is a lack of appropriate incentives.
- Although (micro) behavioral finance offers important insights into the potential errors individual investors can (and will) make, those errors will not have an impact on the collective’s (macro) behavior unless the individual errors within the collective are systematic and correlated. Therefore, although individuals will not always make unbiased investment decisions, knowledge and understanding of these errors cannot be used to predict how the crowd will behave. Systematic bias within the collective will exist only when there is a lack of diversity or breakdown of independence within the crowd.
- Therefore, behavioral finance can cause mispricings in only three of the six conditions of the wisdom of crowds: diversity, independence, and aggregation.
- Behavioral finance explains what causes market inefficiencies by showing how systematic errors are formed and prevent market prices from fully reflecting all available information. Behavioral finance is not an alternative to the efficient market hypothesis, it is a part of the efficient market hypothesis.
- In a mania or bubble, greed overwhelms fear and investors become overly optimistic. Conversely, in a panic or crash, fear overwhelms greed and investors become overly pessimistic. During these episodes, stock prices move away from their true intrinsic value and valuations expand to large premiums or decline to significant discounts, as the stock prices become detached from the company’s underlying fundamentals. The efficient market is cast aside as the crowd’s fear and greed take over.
- If investors perceive that a stock has inadequate trading liquidity, they will not spend additional time looking at the idea, which may result in a mispriced security caused by illiquidity. These mispricings are often caused by investor “neglect.”