
CHAPTER 3
How to Evaluate Competitive Advantage and Value Growth
In each example up to this point in the book, we assumed that the business we were analyzing operates as a going concern and calculated the company’s value based on estimates of its future cash flows. While it is most common for a business to operate its assets with the specific goal of generating cash flow, the business can also generate cash flow by selling its assets, as we show in Figure 3.1.

Figure 3.1 Cash Flow is Generated by Operating an Asset or Selling an Asset
Cash Flow Generated by Selling Assets
There are instances when a company may decide to cease operations and sell its assets outright, rather than continuing to operate them, generating cash in the process. The value of the business in this case is calculated by estimating how much cash the company would receive from liquidating its assets. This analysis is referred to as a company’s liquidation value.
There are also situations where a company may decide to sell part or all of its operating entities to a financial or strategic buyer. Valuing the company based on its value to a potential buyer is referred to as a company’s Private Market Value. We show these two approaches in Figure 3.2.

Figure 3.2 Value from Selling an Asset: Liquidation Value and Private Market Value
We can illustrate the distinction between generating cash flow by operating an asset versus selling the asset with a simple example. Mystery Ranch, a backpack manufacturer based in Bozeman, Montana, owns lots of sewing machines. Dana Gleason, the company’s founder, might use one of the company’s sewing machines, perhaps a Juki 1541S, to manufacture backpacks that the company would then sell to customers to generate revenue and produce cash flow. Alternatively, the company could generate cash by liquidating the same sewing machine by listing it on eBay and selling it for cash, as illustrated in Figure 3.3.

Figure 3.3 Operating or Selling an Asset to Generate Cash Flow
To calculate the sewing machine’s liquidation value, we need to perform research to find out how much other used Juki 1541S sewing machines have sold for. From that information, we might conclude that Mystery Ranch could receive approximately $1,300 for the machine, if they elected to sell it.
If a company decides to liquidate all its assets, we would need to calculate the value of each asset separately, just as we did with one of Mystery Ranch’s used Juki sewing machines, to figure out the company’s full liquidation value.
Liquidation Value
To illustrate this process further, we will liquidate Sevcon, Inc., a public company that makes motor controllers for electric vehicles, including motorcycles, cars, and forklifts. To complete this exercise, we need to estimate what we will receive in the liquidation process for each of the company’s different assets. We can value liquid assets, such as cash and marketable securities, at 100 cents on the dollar2 because these assets are generally easy to sell and should be worth approximately their stated value. On the other hand, we will need to discount the value of less liquid assets, such as inventories and accounts receivable, because it is unlikely we will recover 100% of their stated value in a liquidation. For instance, we might collect close to full value for finished goods inventory, although it is unlikely we will get much more than scrap value for any work in process inventory and raw materials such as wire, magnets, and power supplies. Although we would expect to collect close to full value for all accounts receivable as a going concern, we might not be able to convince all the company’s former customers (remember, the company is exiting the business) to pay what they owe in a liquidation without incurring additional costs to force collection. On the other hand, the company will need to honor all its liabilities and obligations, which must be subtracted from the amount we receive from the sale of its assets, giving us an estimate of the final net proceeds, or cash flow, from the liquidation. We show three liquidation values, based on different recovery assumptions, in Table 3.1.
Table 3.1 Sevcon Liquidation Analysis
 |
We can create a distribution of potential liquidation values for Sevcon using the three point estimates we calculated in the analysis in Table 3.1, as we show in Figure 3.4. It is interesting to note that the estimates of net cash we would receive from liquidating all Sevcon’s assets, even under the most favorable assumptions, yield a value well below the market price of $7.60 for the company’s stock in August 2015.

Figure 3.4 Sevcon’s Liquidation Value
It is important to note that carrying out a liquidation analysis is often of limited practical value unless a company is actually going to liquidate some or all of its assets. However, calculating a realistic liquidation value can provide an indication of a minimum level of value for the business if it is no longer viable as a going concern.
Private Market Value
A company can also generate cash flow by selling some or all of its assets to a buyer who intends on operating the assets. This valuation method is referred to as Private Market Value (PMV), a term coined by Mario Gabelli when he started his firm in 1977. A company’s Private Market Value represents the price an informed industrialist (a rational buyer) would be willing to pay to control a company’s assets.

In his first appearance on Louis Rukeyser’s Wall $treet Week, on March 5, 1982, Gabelli stated:
The idea is what is the private market value of the company, looking at a company not from an earnings dynamic but from the point of view of what an industrialist would pay for the company. . . .
My approach is a bottoms-up approach. If we were sitting around this room with ten industrialists, I would say to them, “What would you pay me for this company if I would give you one bid, winner takes all? What would I get for it?” I would take the company apart, piece by piece and try to understand where the private market value of that company is versus the public market.3
Whether they know it or not, investors are referring to a company’s PMV when they say, “The company is a good acquisition candidate.”
Roger Murray provided a more comprehensive definition of Private Market Value during his lecture series in early 1993:
If I say to myself how would I define private market value, I would say it is likely to be intrinsic value plus, potentially, a control premium, because, by definition, being private I can turn over my business . . . to a private entity, and I can use a longer time horizon than if I got those ridiculous analysts and shareholders out there giving me a hard time. So, potentially there can be a control premium of value, and there may be a patience factor. We will talk about this. The greatest deficiency in the market’s pricing of corporate America is its lack of patience. So maybe if we have it private, we have a better ability to exercise patience.
But there is one negative. I always like to be able to maximize the flexibility and effectiveness of a company by public financing of the enterprise, and I like to have access to the capital markets right at hand. I will even register those huge bond issues that I can take down in 24 hours, and I do not have to negotiate, enter into loan agreements or any of those kinds of restrictive features. So, I would take that as a subtraction.4
To paraphrase, Murray defines Private Market Value as the business’s value plus a control premium and a “patience factor,” minus market access.5
There are two different types of private market buyers: financial buyers such as private equity firms like Kohlberg Kravis and Roberts (KKR) and the Blackstone Group, to name two, and strategic buyers, such as Roper Technologies and Illinois Tool Works, two public companies that are active acquirers.
Financial buyers target publicly held companies that they feel are undervalued by other investors and look specifically for situations where they believe they can improve the financial performance to increase the company’s value. These buyers aim to take companies private so that they can employ Murray’s patience factor to focus on implementing potentially dramatic improvements to the company’s operational efficiency, often with a longer time horizon than management feels they have as a publicly held entity. The financial buyer believes that these actions will generate a significant increase in the company’s value, from which the buyer will reap the benefit.
On the other hand, a strategic buyer, which can be either an existing competitor or a company wanting to enter the market, often wants to expand its market position and is faced with a buy-versus-build decision. In these situations, the acquirer must choose either to reproduce the incumbent’s assets or, alternatively, to simply buy the incumbent to gain control of its assets. The potential acquirer must weigh whether it is cheaper to buy the company “as is” or attempt to reproduce its market position, a calculation that needs to balance time to market against the cost to acquire. As most assets can be reproduced over time, the majority of the control premium paid in these deals is driven by the acquirer’s desire to reduce its time to market.
Cash Flow Generated by Operating the Assets: Return on Invested Capital, Cost of Capital, and Excess Returns
Generating cash flows almost always requires some sort of outlay of capital because it is exceedingly rare for a business to be able to produce positive cash flows without some kind of prior capital investment. The capital outlay in business is generally referred to as a business’s invested capital, and the return on that capital is usually referred to as the business’s return on invested capital, or ROIC. Invested capital also has a cost, however, as we discuss in Chapter 2, which is usually referred to as the business’s cost of capital.
A company generates what economists call excess returns when its return on invested capital (ROIC) is greater than its cost of capital (WACC). It is excess returns that attract competition, not a company’s cash flows, because other companies know they will have to invest capital to capture the cash flows. Therefore, a potential competitor will be interested in entering the market only if they are confident that the incremental cash flows generated by the incremental investment will produce a return greater than the incremental cost of capital for that investment.
To determine if a company earns excess returns, we need to know two numbers: The company’s cost of capital and its return on invested capital.

For instance, if Zoe decides to invest money in a lemonade stand, that capital has to come from somewhere, either from her savings or from borrowing. If she has her savings invested in Charlie Dreifus’s Royce Special Equity Fund (that has returned 8.5% per annum over the past 10 years at the time of this writing in March 2017), she would forgo this return to make the investment in the lemonade stand.6 Presumably, Zoe wants to earn the highest possible return on her money. Therefore, she will invest in the lemonade stand only if she expects it to deliver a return higher than her current investment; otherwise, she would be financially better off leaving her savings in Charlie’s fund. The return she forgoes is her opportunity cost and, in this case, also is the lemonade stand’s cost of capital, as we explain in Chapter 2.
Zoe needs to compare the potential return she could earn investing in the lemonade stand against her 8.5% cost of capital to see if investing in the business makes sense. In other words, Zoe needs to calculate the lemonade stand’s expected ROIC to decide whether to move forward with the investment. It should make sense that the lemonade stand’s return on invested capital needs to exceed the cost of capital for Zoe to be better off financially by making the investment.
Calculating a return on invested capital is similar to calculating a return on any investment. For example, if Zoe has $1,000 invested in a triple tax-free bond7 and receives checks for $40 in the mail each year,8 then the return on her investment is 4%, as the following calculation demonstrates:
Similarly, the lemonade stand’s return on invested capital will equal the cash the business generates divided by the capital invested in the business, as the following formula shows:
We define owner earnings in Chapter 2 and, therefore, we will not repeat the explanation here. However, we need to define invested capital in more detail to move forward with the analysis.
Zoe knows how much she has invested in her tax-free bond; therefore, calculating her return on invested capital is easy. Although conceptually similar, determining the amount of invested capital in a real business can be trickier in practice. For simplicity, invested capital is equivalent to the amount of cash invested in the business, which in Zoe’s case is all the different items she needs to purchase to get the business up and running. More formally, invested capital is defined as follows:9
The invested capital of Zoe’s Lemonade Stand is shown in Table 3.2.
Table 3.2 Zoe’s Lemonade Stand Balance Sheet
 |
We show in the previous chapter that Zoe estimates the lemonade stand will produce $120 of owner earnings in her first year of operation, which means the business would generate a return on invested capital of 20.0%, as the following calculation shows:
Zoe can perform a similar analysis on her investment in the Royce Special Equity Fund:
As mentioned above, the expected return from investing in the Royce Fund is Zoe’s opportunity cost and the lemonade stand’s cost of capital, which, as the calculation shows, equals 8.5% on her $600 investment, or $51 per year. The following analysis shows that Zoe would generate excess returns by investing in the lemonade stand, which we can show as both a percent and a dollar amount.
We can calculate the lemonade stand’s excess return as a percent using the following formula:

We can calculate the excess return as a dollar amount by multiplying each percentage in the preceding formula by the amount of capital invested in the business, as the following calculation demonstrates:

We can define owner earnings in terms of its return on invested capital if we rearrange the earlier ROIC formula:

Which, for the lemonade stand, equals:
We can split owner earnings into its two components—excess returns in dollars and cost of capital in dollars—using the following formula:

The dollar amount of the cost of capital is called a capital charge, which equals the company’s cost of capital times the amount of capital invested in the business. The capital charge is the cash flow the lemonade stand must generate to cover its cost of equity capital. The analysis shows that Zoe would expect to earn excess returns of $69 each year by making the investment in the lemonade stand.
Businesses with Excess Returns Attract Competition
The lemonade stand’s return on invested capital of 20.0% will likely attract competitors, however. For example, let’s say that the weather is very nice during the first few weeks of summer and business is booming. In fact, the lemonade stand’s business is so good that Zoe has enough profits at the end of the month to buy a new bicycle. Charlotte, who lives across the street from Zoe’s house, notices Zoe’s newfound riches and thinks to herself, “I want a new bicycle, too. Since Zoe is making so much money, so quickly, I think I will start a lemonade stand as well.”
As the only person selling lemonade in her neighborhood, Zoe has a monopoly on the market. She is providing a product to customers that no one else is offering and has generated an impressive financial return of 20.0% in the process (see Table 3.3).
Table 3.3 Zoe’s Lemonade Stand: Monopoly Returns
| Zoe | |
| Cups sold | 600 |
| Price per cup | $ 2.00 |
| Revenues | 1,200 |
| Costs | 1,080 |
| Owner Earnings | 120 |
| Invested Capital | 600 |
| ROIC | 20.0% |
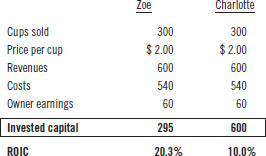
However, long-lasting monopolies are rare because sooner or later competitors figure out how to replicate the product, enter the market, and compete for customers. The uniqueness of the product proves to be temporary over time. Unless Zoe has some way to prevent Charlotte from entering her market, Charlotte will begin selling lemonade, and take revenues and profits away from Zoe, and the reduced profits will decrease the lemonade stand’s return on invested capital. For example, if Charlotte captures half of Zoe’s sales, then Zoe’s return on invested capital would fall to 10.0%, as the analysis in Table 3.4 shows.

Table 3.4 Zoe’s Lemonade Stand: No Competitive Advantage
| Zoe | Charlotte | |
| Cups sold | 300 | 300 |
| Price per cup | $ 2.00 | $ 2.00 |
| Revenues | 600 | 600 |
| Costs | 540 | 540 |
| Owner earnings | 60 | 60 |
| Invested capital | 600 | 600 |
| ROIC | 10.0% | 10.0% |
To prevent Charlotte from entering the market and negatively impacting her profitability, Zoe needs some type of competitive advantage.10
Competitive Advantage Defined
We see from the ROIC formula that the only way for a company to generate a return on invested capital greater than its cost of capital is to command higher prices, achieve lower costs, or use capital more efficiently than its competitors, as we demonstrate in Table 3.5.
Table 3.5 Sources of Excess Return
 |
For instance, we see the benefit of a price advantage in Table 3.6, where Zoe generates a higher return on capital than Charlotte because Zoe charges a higher price for each cup of lemonade sold.
Table 3.6 Zoe’s Lemonade Stand: Price Advantage
 |
Alternatively, we see the benefit of a cost advantage in Table 3.7, where Zoe generates a higher return on capital than Charlotte because Zoe has lower operating costs.
Table 3.7 Zoe’s Lemonade Stand: Cost Advantage
 |
And, finally, we see the effect of using capital more efficiently in Table 3.8, where Zoe generates a higher return on capital than Charlotte because her business uses capital more efficiently.
Table 3.8 Zoe’s Lemonade Stand: Capital Efficiency
 |
Sources of Competitive Advantage
There are four main sources of competitive advantage: customer-facing advantages, production advantages, efficiency advantages, and advantages due to government policy.

Competitive advantages that allow a company to charge a higher price are generally referred to as customer-facing advantages, which implies that the customer is willing to stick with their current supplier and pay the higher price rather than pay a lower price by switching to a new supplier. These advantages exist when the customer is faced with search costs, switching costs, or buying habits.
Customer captivity based on search costs occurs when a consumer cannot or will not take the time to compare competing products or services. This customer behavior is generally found with purchases that are infrequent and involve decisions that are critically important. For example, if your car breaks down on a rainy night, you probably won’t call four different towing companies to see which one is the cheapest.
Customer captivity based on switching costs arises in situations when there is a prohibitively high cost in terms of time or money to switch from one product to another. For example, if you bank with Chase and have all your payees set up in its online system, have direct deposit for your paycheck, and know the most convenient ATM locations in your neighborhood, you will be hesitant to switch to Citibank because the change would be time-consuming and require your learning a new online banking system.
If the search costs and switching costs are low, yet the customer remains captive, it is most likely that their decision is based on a well-ingrained habit. Habit-based purchase decisions generally include routine purchases for products such as shampoo, toothpaste, beer, laundry detergent, or cigarettes.
Many people believe that brands are a source of competitive advantage. However, unless the brand reinforces the search costs, switching costs, or consumer’s buying habit, it is not an advantage by itself. Virtually every product available has a brand, even if it is a house brand such as Whole Foods’ 365 Everyday Value set of products. One cannot argue that brands are a source of competitive advantage if every product has one. On the other hand, a simple example of a brand that is a source of competitive advantage is Tylenol. If you walk into a CVS with a headache, you have the option to purchase the CVS-brand acetaminophen for $6 and the same-sized bottle of Tylenol for $9. Even though the two medicines are the same chemically, Tylenol’s brand commands a higher price that people are willing to pay.
Advantages based on customer captivity often erodes over time as individual tastes, needs, and desires change. Consumer preferences also shift with changes in social norms, pop culture, or new information based on health and safety concerns or efficacy of a product or service. New technologies change rapidly, bringing innovative products and services to market that often obliterate the demand for other products, even if the products have enjoyed strong customer captivity in the past. Finally, the proliferation of information can weaken customer-based advantages because the additional information allows consumers to be better informed in their purchasing decisions. For instance, the Internet allows consumers to perform in-depth research before buying a product and allows consumers to compare products more easily before making a purchase decision.
Production advantages provide a company with lower manufacturing costs than its competitors. A company with a cost advantage can either charge the same price for its products as competitors, generating higher profitability and return on capital; or, charge a lower price for its products than competitors, potentially gaining market share, yet still maintaining its profitability and high return on capital.
We show the financial results from these two choices in Table 3.9. As the example illustrates, Zoe charges the same price as Charlotte in the example on the left, although she has a higher return on invested capital because of her lower costs. In the example on the right, Zoe cut her price, but maintains a higher return on invested capital than Charlotte, also because of her lower costs.
Table 3.9 Zoe’s Lemonade Stand: Pricing Alternatives
 |
Production advantages come from three primary sources: proprietary production technology, lower cost of inputs, or superior distribution.
A company with proprietary production technology manufactures products that are hard for competitors to replicate. For example, Intel’s advanced production technology allows it to produce microprocessors that no other semiconductor manufacturer can reproduce, resulting in a significantly higher return on capital than any of its competitors.
Most production advantages erode over time, however, because it is hard for any company to maintain its proprietary technology for very long before its competitors successfully replicate or re-create the process.
A company will have a structural cost advantage if it has lower cost of inputs or possesses unique resources. For example, if Zoe was the only one in the neighborhood to have a lemon tree in her backyard and therefore did not have to pay for lemons, she would have lower costs in producing her lemonade than her competitors.
However, excess returns accrue to the suppliers of the unique resource over time, not its customers, because the suppliers can charge high prices for their limited products. For example, if Zoe’s next-door neighbor owned the lemon tree, the neighbor would generate the excess returns, not Zoe. An example in the “real world” is FRP Holdings, a company that has mines in Florida from which tenants like Vulcan Materials, Martin Marietta Materials, and Cemex pay royalties to extract aggregates. FRP’s mines earn extraordinary returns on invested capital because the cost of transporting aggregates over long distances is prohibitively high, making the company’s properties (literally) uniquely positioned.
Finally, a company can have a cost advantage if it has access to distribution networks that are unavailable to its competitors, which enables the company to deliver its products or services to its customers at lower costs. For example, if Snapple decides to introduce a new flavor of lemonade, the company will have access to premium shelf space at retail stores because it has established relationships with key distributors. Conversely, if Zoe tried to broaden her market into retail stores, she most likely would find it extremely challenging and costly to obtain any shelf space for her lemonade.
A company will have an efficiency advantage if it has economies of scale in some aspect of its business. There are three general sources of scale: learning curve, economies of scale or scope, and network effects.
Any process that becomes more cost-efficient over time from cumulative learning benefits from what is generally referred to as a learning or experience curve. The increased efficiency results from a company learning how to make its products more efficiently or with less waste, which lowers its manufacturing costs per unit over time.
A second source of scale exists when a company can spread high fixed costs over a large volume of units, which reduces the fixed cost per unit. These advantages are referred to as economies of scale or scope. For instance, Coca-Cola has scale with its marketing budget because the cost of its advertising can be spread over more individual units than its competitors’. A new competitor entering the market would have trouble generating demand for its products because it cannot match Coca-Cola’s level of advertising and its operating costs per bottle of soda would be materially higher than Coke’s. The same potential scale benefits apply to fixed production cost, research and development, and the cost of operating a company-owned distribution network. These expenses are generally fixed, at least in the short term. Therefore, the company with the largest unit volume has a cost advantage because the fixed cost is spread over a large volume of individual units.
The third potential source of scale comes from network effects, which are products or services that deliver more value to the consumer as the number of users increases. These products tend to result in winner-take-most markets because the network effect favors a single vendor. Recent examples of businesses that enjoy advantages based on network effects are Facebook, LinkedIn, Airbnb, and Uber.
It is hard to maintain relative scale in large markets, however. In fact, except for advantages from network effects, scale advantages are often limited to regional geographies or well-defined markets. Scale is rarely static over time and must be maintained for it to remain a competitive advantage. Furthermore, it is hard for any company to maintain large relative scale in a growing market because the growth in demand creates new customers, which provide opportunities for competitors to enter the market, grab market share and reach scale.
The final potential source of competitive advantage is advantage due to government policy. In some instances, governments can limit entry into specific markets. This barrier provides existing firms with a competitive advantage, which will exist only for as long as the regulation remains in place. Government policies affecting competition usually involve antitrust, zoning, or environmental regulations; patents; tariffs; quotas; and subsidies. Classic examples of this type of advantage is the U.S. patent system or regulation affecting electric utilities. Advantages due to government regulations can disappear quickly if the government decides to change its policies. And, in the case of a patent, an advantage can literally change in a day as patents expire 17 years after their issue date.
We summarize the four potential sources of competitive advantage in Figure 3.6.

Figure 3.6 Sources of Competitive Advantage
Sustaining Competitive Advantage
We have found that a company’s competitive advantage will be sustainable if, and only if, it possesses a true customer-facing advantage coupled with a scale-based advantage. The customer-facing advantage makes it hard for competitors to steal customers, and the scale-based advantage provides the incumbent vendor with lower operating costs. The two advantages reinforce each other and make it extremely challenging for any new company to enter the market successfully.
Now that we have discussed competitive advantage, we can move forward with showing how to value the cash flow a company generates from operating its assets. There are three layers to consider—the value of the assets with no competitive advantage, the value of the assets with a competitive advantage, and the value of incremental growth. We show these factors in Figure 3.7.

Figure 3.7 Potential Sources of Cash Flow
How Competitive Advantage Affects Valuation?11
To determine how competitive advantage affects valuation we start with the definition of the estimated value of an asset:
The estimated value of an asset equals the sum of the cash flows expected to be produced by that asset, over its useful life, discounted for the time value of money and the uncertainty of receiving those cash flows.
And then add the definition of competitive advantage:
Competitive advantage is a company’s ability to produce and sustain excess returns over time.
To arrive at the definition of the value of a company’s competitive advantage:
The estimated value of a company’s competitive advantage is the sum of the estimated cash flow solely generated by excess returns, over the period that the company can sustain those excess returns, discounted for the time value of money and the uncertainty of receiving those cash flows.
Value of Zoe’s Lemonade Stand With No Growth
To determine the value of Zoe’s Lemonade Stand’s competitive advantage we need to calculate how much of the lemonade stand’s cash flows is generated from excess returns.
Scenario 1: Value of Zoe’s Lemonade Stand When ROIC Greater Than the Cost of Capital With No Growth We calculated in Chapter 2 that the lemonade stand’s present value, assuming 20% return on invested capital and no growth, equals $1,412, which we replicate in Figure 3.8.

Figure 3.8 Present Value of Zoe’s Lemonade Stand with No Growth
Although the approach calculates the lemonade stand’s present value correctly, it does not identify the value of the lemonade stand derived from its excess returns, which we need to quantify to see how competitive advantage impacts valuation.
To perform this analysis, we need to split the lemonade stand’s earnings into its excess returns in dollars and the cash flow allocated to its capital charge, as we did on page 84:


The analysis shows that the lemonade stand’s $120 in annual owner earnings are comprised of $69 from its excess returns and $51 to cover its capital charge. We can use arrow charts to show this analysis graphically, with the lemonade stand’s overall annual owner earnings on the left and the subcomponents of excess returns ($69 per period) and capital charge ($51 per period) on the right, as shown in Figure 3.9.

Figure 3.9 Owner Earnings Equals Excess Return Plus Capital Charge
We can determine how much of the lemonade stand’s present value is derived from the company’s excess returns using the following formulas:

Since:
We can repopulate the formula by substituting owner earnings with the excess returns in dollars and the capital charges, as the following calculation shows:

First, we calculate the present value of the excess returns in dollars using a standard DCF:

Figure3.10 shows the discounting of the individual cash flows and terminal value of the excess returns to arrive at the present value of the excess returns in dollars:

Figure 3.10 Present Value of Excess Return
We can calculate the present value of the capital charges using the same approach:

Figure 3.11 shows the discounting of the individual capital charges and the terminal value, to arrive their present value.

Figure 3.11 Present Value of Capital Charge
The analysis shows that the present value of the excess returns equals $812 and the present value of capital charges equals $600, which, when summed together, equal the lemonade stand’s total present value of $1,412, as the following formulas confirm:

It is important to note that the lemonade stand derives $812 of its value from its excess returns. Since we define competitive advantage as a company’s ability to generate excess returns, the value of Zoe’s Lemonade Stand’s competitive advantage is $812. Therefore, since the lemonade stand has a competitive advantage, as evidenced by its excess returns, Zoe is better off by investing in the business than leaving the money in savings.
Scenario 2: Value of Zoe’s Lemonade Stand when ROIC Equals the Cost of Capital with No Growth If we assume that Zoe has no competitive advantage, then the lemonade stand’s return on invested capital would equal its cost of capital, and the business would have no excess returns, as the following calculation shows:

We can also show that the lemonade stand generates no excess returns when we split its owner earnings into the two subcomponents:

We show the individual cash flows in Figure 3.12, although there are no excess returns in this case because owner earnings equals the capital charge.

Figure 3.12 Owner Earnings Equals Capital Charge with No Competitive Advantage
To illustrate the point, we can split the lemonade stand’s owner earnings into excess returns in dollars and the annual capital charge, as we did with the prior example.
And then use the same approach to calculate their present value:

Although the exercise is not necessary because the lemonade stand generates no excess return, we can use the following formula to show that the present value of excess returns equals $0 by calculating the present value of excess returns in dollars:

We know from the previous example that the present value of the capital charges equals $600.
We can use the following formula to show that the lemonade’s present value equals $600 when it generates no excess returns:

It is clear that the lemonade stand has no competitive advantage in this example because the business generates no excess returns. As a consequence, the value of the lemonade stand equals the value of its invested capital (which equals the present value of the annual capital charges). Zoe is better off leaving the money in her savings account as the investment in the business would create no excess value.
Scenario 3: Value of Zoe’s Lemonade Stand when ROIC is Less Than the Cost of Capital with No Growth What would be the value of the lemonade stand if its return on invested capital is less than its cost of capital? For instance, let’s assume that the business generates a return on invested capital of only 6.4%, versus its cost of capital of 8.5%.
In this case, the lemonade stand’s excess returns would be negative and the business will be worth less than the value of its invested capital, as the following analysis demonstrates:

We show the negative excess returns in dollars when we split owner earnings into its two subcomponents, as we did in the two prior examples:
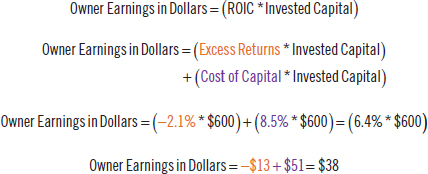
We compare the owner earnings of $38 to the capital charge of $51 in Figure 3.13.

Figure 3.13 Owner Earnings Less than Capital Charge
We show the negative excess returns of $13 in Figure 3.14:

Figure 3.14 Negative Excess Returns Destroys Value
We can further demonstrate that the negative excess returns decrease the value of the lemonade stand using the same analysis we did in the two prior examples:

Once again, we can split owner earnings into its two subcomponents:
and repopulate the formula like we did in the previous examples:

It is clear that the present value of the excess return will be negative because the annual excess return in dollars is also negative, as we show in the following calculations:

We know from the prior examples the present value of the capital charges:
We show how the two subcomponents affect the lemonade stand’s value in the following equations:

The analysis confirms that the negative excess returns destroy value. Zoe is better off holding on to her savings and not investing in the lemonade stand because the business would be worth less than its invested capital.
Scenario 4: Value of Zoe’s Lemonade Stand with ROIC Declining to the Cost of Capital with No Growth What if Zoe’s neighbor Charlotte enters the market? Unless Zoe has a sustainable competitive advantage to keep Charlotte from stealing her customers, the cash flows of Zoe’s Lemonade Stand will fall and the excess returns will slowly disappear as the return on invested capital for the business is driven down to its cost of capital. For instance, let’s assume that the lemonade stand’s return on invested capital is 20% before Charlotte enters the market, but declines to its cost of capital by the end of year 6 because of increased competition.
We show that the lemonade stand’s owner earnings decline each year in Table 3.10.
Table 3.10 Declining Owner Earnings from Increasing Competitive Pressure
 |
We demonstrate that the competitive pressure from Charlotte’s entering the market erodes the lemonade stand’s excess returns in Figure 3.15.

Figure 3.15 Competitive Pressures Drive Excess Returns to Zero
In Table 3.11 we show how we calculate the cash flows in Figure 3.15.
Table 3.11 Sources of Owner Earnings with Competitive Pressures
 |
It is important to emphasize this point a bit further. The lemonade stand’s excess returns will be eliminated as its return on invested capital is driven to its cost of capital because of increased competitive pressures. While the business creates additional value during the years it generates excess returns, the value of the lemonade stand eventually will equal only the capital invested in the business after all excess returns have been competed away.
We can calculate the present value of the lemonade stand’s owner earnings by discounting its future cash flows:

We can repopulate the formula like we did in the earlier examples by splitting owner earnings into its two subcomponents:

And can calculate the present value of each subcomponent:

We show how the two subcomponents affect the lemonade stand’s value in the following equations:

The value of the lemonade stand is greater than the value of its invested capital, and Zoe is better off investing in the business. However, although the business starts off generating excess returns, Zoe cannot maintain them because the lemonade stand does not have a sustainable competitive advantage. While the lemonade stand creates $172 of value over the six-year period, the business creates value only during the period when it generated excess returns.
How Growth Affects Valuation
As we demonstrate in the examples above, a business does not create value for its owners simply by producing owner earnings; rather, a business creates value only when it generates excess returns (returns above its cost of capital).
We need to be more precise with the terms when we discuss growth, however. Growth in owner earnings creates incremental value only if the growth generates positive excess returns. And because essentially all growth requires additional investment, any incremental growth in owner earnings needs to be netted against the capital charge associated with the additional investment necessary to support the growth.
Consequently (and at the risk of being repetitive), the perceived value of growth can be misleading because, counterintuitively, nominal incremental growth in owner earnings does not always increase the incremental value of the business, as we demonstrate in the following examples.
Nominal Growth: The Illusion of Moving Forward
Imagine you are flying to London. You arrive at the airport, go through security, and start walking toward the gate. You look ahead and realize that the distance to your destination is a long walk, so you decide to step onto a moving sidewalk to accelerate your pace. About halfway to the gate, the sidewalk stops abruptly and begins moving in the opposite direction at 8.5 feet per second (fps).
If you stand still, you will end up back where you started. You begin to walk at a modest pace of 3 fps. Although you are walking forward, you are actually moving in reverse at 5.5 fps because you have not overcome the sidewalk’s speed of 8.5 fps in the opposite direction. You pick-up your pace and begin to jog at 8.5 fps. You make no forward progress, however, because the sidewalk is moving in the opposite direction at the same speed that you are jogging. You decide to break into a run and quickly hit a pace of 20 fps. Although you are running at 20 fps, you are moving forward at only 11.5 fps because the sidewalk is moving against you at 8.5 fps. Eventually, you make it to the end of the sidewalk and get off to board your flight.
One can characterize your movement in nominal and real values. For instance, your nominal speed is the speed at which you walk, be it 3, 8.5, or 20 fps, whereas your real speed is -5.5, 0, or 11.5 fps, which is your nominal speed offset by the sidewalk’s movement in the opposite direction, as we show in Table 3.12
Table 3.12 Nominal and Real Speeds on Moving Sidewalk
| Nominal Speed | Speed of Sidewalk | Real Speed | ||
| Nominal Speed < Sidewalk | 3.0 | -8.5 | -5.5 | Going Backward |
| Nominal Speed = Sidewalk | 8.5 | -8.5 | 0.0 | Stay in the Same Place |
| Nominal Speed > Sidewalk | 20.0 | -8.5 | 11.5 | Forward Progress |
We can use the airport analogy to discuss the various components of growth. Since virtually all growth requires incremental investment, the return on incremental invested capital (ROIIC) can be thought of as the nominal speed. The associated capital charge (WACC * incremental invested capital) from the incremental investment can be thought of as the speed of the sidewalk moving in the opposite direction. The difference between the ROIIC and the cost of capital (WACC) can be thought of as the real speed, which is the net forward progress or, in the case of a business, the incremental value created from growth. We substitute these values in Table 3.13
Table 3.13 Nominal and Real Return on Incremental Investment
| ROIIC | WACC | Incr Excess Returns | ||
| ROIIC < WACC | 3.0% | 8.5% | -5.5% | Negative Incremental Value |
| ROIIC = WACC | 8.5% | 8.5% | 0.0% | No Incremental Value |
| ROIIC > WACC | 20.0% | 8.5% | 11.5% | Increased Incremental Value |
As the table shows, the difference between the nominal ROIIC and the WACC is the real or excess return, which will be positive when the ROIIC is greater than WACC, zero when the ROIIC equals WACC, and negative when the ROIIC is less than WACC. Therefore, growth creates negative incremental value if the incremental investment earns only 3%, no incremental value if the investment earns 8.5%, and positive incremental value if the investment earns 20%.
Real Growth: Removing the Illusion
As we show earlier in the chapter, the value of Zoe’s Lemonade Stand (base business) equals the present value of owner earnings, which is comprised of excess returns and capital charges:
We can calculate the nominal incremental growth in owner earnings using the same formula:
To calculate the total nominal present value of Zoe’s Lemonade Stand, with growth, we simply add the two components—the present value of the base business and the nominal present value of the incremental growth:

In the next three examples, we calculate growth under three different scenarios, as outlined in Table 3.13—growth when ROIIC equals WACC, growth when ROIIC is less than WACC, and growth when ROIIC is greater than WACC. We show that while the incremental growth in owner earnings increases the lemonade stand’s nominal value in each example, it does not always increase its real value.
Scenario 5: Real Value of Zoe’s Lemonade Stand with Growth When ROIIC Equals the Cost of Capital Let’s suppose that Zoe decides to expand her business by opening an additional, smaller lemonade stand a few blocks from her house and invests 10% more capital each year to support that growth. In this example, the incremental investment in year 1 is $60, which is 10% of $600 invested in the original business. The incremental investment in year 2 is $66, which is 10% of $600 invested in the original business and the $60 incremental investment in year 1. The incremental investment of 10% continues for each of the next four years, as we show in Table 3.14.
Table 3.14 Incremental Capital Charge for Zoe’s Lemonade Stands with Invested Capital Growing at 10% Per Annum
 |
As it turns out, the new location has fewer sales, higher operating expenses, and lower profitability than Zoe’s original lemonade stand and the return on the incremental invested capital is only 8.5%, which, as we know, equals the lemonade stand’s cost of capital. This case is like the airport sidewalk example when the nominal speed forward was 8.5 fps while the walkway moved 8.5 fps in the opposite direction. You made no forward progress in that example, and we will show that similarly the investment in this example creates no incremental value for Zoe’s lemonade stand.
We calculate the nominal incremental growth in owner earnings for each year during the six-year forecast period and the total nominal present value of incremental growth in Table 3.15.
Table 3.15 Total Nominal Present Value of Incremental Growth
 |
As we explain, the nominal present value of incremental growth is comprised of two components—present value of incremental excess returns and present value of incremental capital charges, which we show in Table 3.16:
Table 3.16 Total Nominal PV of Incremental Growth with Excess Returns and Capital Charges
|
The nominal present value is calculated using the following formula:

The calculation shows that the nominal present value of incremental growth equals $284.
To calculate the total nominal value of Zoe’s Lemonade Stand, we add the nominal present value of incremental growth of $284 to the previously calculated (no growth) value of $1,412, which produces a total value of $1,696:

While it appears that growth in this example increases the value of Zoe’s Lemonade Stand by $284, the calculation ignores the incremental capital charges. To calculate the real present value of incremental growth, we need to subtract the present value of the capital charges to determine if the nominal growth in owner earnings actually produces incremental value, which we can do using the following formula:

Since the total value of $1,412 in this example equals the Lemonade Stand’s original (no growth) value, the incremental investment creates no value. We illustrate this result in Figure 3.16A, where we show that the nominal incremental growth in owner earnings equals the incremental capital charges.

Figure 3.16A Nominal Incremental Owner Earnings Equals Incremental Capital Charge
Consequently, there is no realincremental value created from the additional investment because there is no incremental excess return, as we show in Figure 3.16B.

Figure 3.16B No Excess Returns from Growth Creates No Value
The analysis demonstrates that the real present value of Zoe’s Lemonade Stand with incremental growth when ROIIC equals WACC is the same as the present value of the lemonade stand before investing in growth. The example reveals that because the incremental growth generates no incremental value, Zoe is no better off expanding her business.
Scenario 6: Value of Zoe’s Lemonade Stand with Growth when ROIIC is Less Than the Cost of Capital Instead of opening an additional small lemonade stand a few blocks from her house, Zoe decides to expand her lemonade stand into Paris’s neighborhood on the other side of town. In additional to having higher operating expenses, Zoe needs to sell her lemonade at a discount to steal customers from Paris, which constrains the new lemonade stand’s financial returns. Consequently, the return on the incremental invested capital is only 3.0%, which is below the lemonade stand’s cost of capital.
We calculate the nominal incremental growth in owner earnings from the incremental investments for each year during the six-year forecast period, as shown in Table 3.17.
Table 3.17 Nominal Present Value of Incremental Growth
 |
The nominal present value can be calculated using the following formula:

The calculation shows that the nominal present value of incremental growth equals $100.
As we discuss, the nominal present value of incremental growth is comprised of two components—the present value of incremental excess returns and the present value of incremental capital charges, which we show in Table 3.18:
Table 3.18 Nominal Present Value of Incremental Growth with Excess Return and Capital Charges
 |
To calculate the total nominal value of Zoe’s Lemonade Stand in this example, we add the nominal present value of incremental growth of $100 to the previously calculated (no growth) value of $1,412, to arrive at a value of $1,512:

While it appears that the incremental growth increases the value of Zoe’s Lemonade Stand by $100, the calculation (once again) ignores the incremental capital charges. And since the new lemonade stand produces negative excess returns, the incremental growth in owner earnings destroys value. This situation is like the airport sidewalk example when the nominal speed forward was 3 fps, but the real speed was −5.5 fps because the walkway was moving in the opposite direction at 8.5 fps.
To calculate the real present value of incremental growth, we need to subtract the present value of the capital charges from the nominal growth in owner earnings to see if it produces incremental value, as we show in the following formula:

Since the total value of $1,228 in this example is less than the lemonade stand’s original (no growth) value of $1,412, the incremental investment destroys value and Zoe is worse off making the investment.
The charts in Figure 3.17A show that the incremental growth in the lemonade stand’s owner earnings is less than the incremental capital charges from that investment, which confirms that the incremental growth destroys value for the lemonade stand because of the negative incremental excess returns, which runs counter to the claim that growth increases value.

Figure 3.17A Nominal Incremental Owner Earnings Less Than Incremental Capital Charges
Consequently, there is no real incremental growth from the additional investment in this example because of the negative excess returns it produces, as we show in figure 3.17B.

Figure 3.17B Negative Excess Returns from Growth Destroy Value
The analysis shows that in this example the real present value of Zoe’s Lemonade Stand with growth is worth less than the present value of the lemonade stand without growth, after accounting for the capital charges from the incremental investment. It is important to stress this point. The lemonade stand destroys value by growing owner earnings because the return on the incremental invested capital is less than the incremental cost of capital.
Consequently, Zoe is better off not expanding her business because the incremental investment would destroy value.
Scenario 7: Value of Zoe’s Lemonade Stand with Growth When ROIIC is Greater Than the Cost of Capital Instead of opening a smaller lemonade stand a few blocks away or expanding into Paris’s neighborhood across town, let’s assume that Zoe expands her operations in response to increasing demand from her current customers. Because she has no competition, we can assume that the expanded business produces the same level of profitability and that her return on incremental invested capital is 20.0%.
We calculate the increase in owner earnings from the incremental investments for each year during the six-year forecast period, as shown in Table 3.19.
Table 3.19 Increase in Annual Incremental Investment Required to Fund Growth
 |
As we demonstrate in the examples above, nominal present value of incremental growth is comprised of two components—the present value of incremental excess returns and the present value of incremental capital charges, which we show in Table 3.20:
Table 3.20 Nominal Present Value of Incremental Growth with Excess Return and Capital Charges
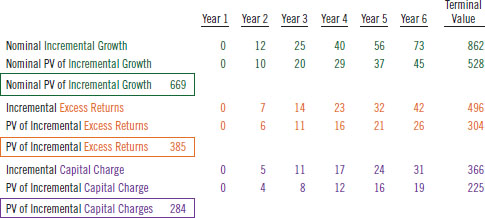 |
The nominal present value can be calculated using the following formula:

The calculation shows that the nominal present value of incremental growth equals $669.
To calculate the total nominal value of Zoe’s Lemonade Stand with growth, we add the nominal present value of incremental growth of $669 to the lemonade stand’s previously calculated (no growth) value of $1,412, to arrive at a value of $2,081:

While it appears that the incremental growth increases the value of Zoe’s Lemonade Stand by $669, the calculation ignores the incremental capital charges, as we show in the previous examples. To calculate the real present value of incremental growth, we need to subtract the present value of the capital charges from the nominal growth in owner earnings to see if the investment produces incremental value:

Since the total value of $1,796 is greater than the lemonade stand’s original (no growth) value of $1,412, the investment produces incremental value and Zoe is better off by making the investment and expanding her business.
The charts in Figure 3.18A show that the increase in the lemonade stand’s owner earnings from growth is significantly higher than the incremental capital charges for that growth, which confirms that the incremental growth increases the value of the lemonade stand.

Figure 3.18A Nominal Incremental Owner Earnings Greater than Incremental Capital Charge
And, as a consequence, because the lemonade stand produces incremental positive excess returns in this example, the additional investment generates real incremental growth, as we show in Figure 3.18B.

Figure 3.18B Positive Excess Returns from Growth Create Value

Real World Example—McCormick Inc.
Investors can use these tools to analyze companies in the real world. For instance, it is generally straightforward to calculate a business’s annual capital charge simply by multiplying the company’s weighted average cost of capital (WACC) times its invested capital. Companies like McCormick make it easy to do this analysis because they provide supplemental financial information to investors, as Table 3.21 shows (all amounts are in U.S. dollars):
Table 3.21 McCormick: Ranges for Sources of Value
 |
“Other InformationROIC.” McCormick’s Investor Relations Website. Accessed February 4, 2017.
In a similar vein, determining a company’s cash flow from excess returns can be calculated by multiplying the company’s ROIC—WACC spread by the same invested capital. Again, McCormick makes it easy by providing this information, as shown in Table 3.22.
Table 3.22 McCormick: Calculating ROIC
 |

The calculation shows that the $514 in annual cash flow McCormick generated in 2016 is comprised of two parts: $267 in cash flow from excess returns and cash flow to cover its capital charge of $247. The high percentage of cash flow from excess returns indicates that the company has a strong competitive advantage.
If we assume that McCormick has a sustainable competitive advantage, then we can use the perpetuity valuation formula to calculate that the present value of excess returns of $267 per year equals $3,338, as the following calculation demonstrates:

We can also calculate that the present value of the capital charge of $247 per year equals $3,083:

We can use this analysis to link McCormick’s sources of cash flow to its valuation. For instance, the present value of the company’s annual capital charge equals the company’s invested capital and represents McCormick’s no-growth, steady-state value, assuming the company has no competitive advantage. It should be easy to see that this value equals McCormick’s no-growth, invested capital.
If a company has a sustainable competitive advantage, which allows it to maintain its excess returns in the future, then the present value of the cash flows from its excess returns represents the value of the company derived from its competitive advantage. If we further assume that the company’s excess returns will not change in the future, then we can use the perpetuity valuation formula to calculate the present value of the company’s cash flow from excess returns, which is the present value of its competitive advantage, as we show for McCormick in the following equations.

Finally, we can calculate investors’ estimate of the present value of growth, or the market implied value of growth, using the following approach. First, calculate the company’s enterprise value, as we do with McCormick in the analysis shown in Table 3.23.
Table 3.23 McCormick: Calculation of Enterprise Value
| Price (2/4/17) | $ 95.86 |
| Shares Outstanding | 125 |
| Market Value of Equity | 11,983 |
| – Cash | 118 |
| + Debt | 1,456 |
| = Enterprise Value | 13,321 |
| Based on November 2016 balance sheet |
Then subtract from the enterprise value the present value of the company’s capital charges (the company’s invested capital) and the present value of the company’s competitive advantage to arrive at the market implied enterprise value of growth, as the analysis in Table 3.24 shows.
Table 3.24 McCormick: Market Implied Value of Growth
| Enterprise Value | 13,321 |
| – Invested Capital (PV of Capital Charges) | 3,083 |
| – PV of Competitive Advantage (No Growth) | 3,338 |
| Market Implied Enterprise Value of Growth | 6,900 |
Then add back cash, subtract debt, and divide by shares outstanding to arrive at per share values, as shown in Table 3.25.
Table 3.25 McCormick: Per Share Sources of Value
 |
McCormick’s market implied value of growth equals $49.65 per share, or more than 50% of the share price.
Companies can generate excess returns, over time, only if they have a sustainable competitive advantage, and growth only creates value when the return on the incremental investment is greater than the cost of capital on the incremental investment. Therefore, cash flows from excess returns and any value created from growth are a direct function of a company’s competitive advantage. We show in Table 3.26 an impressive 77% of McCormick’s market value comes from the present value of its excess returns and its market implied value of growth.
Table 3.26 McCormick: Sources of Value from Competitive Advantage and Growth
 |
We present this result graphically in Figure 3.19, showing how much of McCormick’s market price is attributed to each source of value. This analysis illustrates that it is critically important to understand the source of the company’s competitive advantage when trying to calculate its value because, as we see with McCormick, a significant portion of the company’s value will be a direct function of its competitive advantage.

Figure 3.19 McCormick: Ranges for Sources of Value
Gems:
- A company may decide to cease operations and sell its assets outright, rather than continuing to operate them, generating cash in the process. The value of the business in this case is calculated by estimating how much cash the company would receive from liquidating its assets. This analysis is referred to as a company’s liquidation value.
- A company may decide to sell part or all of its operating entities to a financial or strategic buyer. Valuing the company based on its value to a potential buyer is referred to as a company’s Private Market Value, which represents the price a rational buyer (an industrialist) would be willing to pay to gain control of the company’s assets. Professor Roger Murray defined Private Market Value as the business’s value plus a control premium and a patience factor, minus access to public capital markets.
- A company generates excess returns when its return on invested capital is greater than its cost of capital for that investment.
- Having a return on invested capital significantly above its cost of capital does not guarantee that the company has a true competitive advantage. Because the excess returns will attract competitors, the business’s strong financial performance will decline quickly if competitors successfully enter the market. Therefore, for the advantage to be a true barrier, it must be sustainable over time.
- Competitive advantage is defined as a company’s ability to generate excess returns. A sustainable competitive advantage is defined as a company’s ability to generate excess returns over an extended period of time in the future, which requires barriers to entry to prevent competitors from entering the market and eroding away the excess returns.
- There are four main sources of competitive advantage:
- Customer-facing advantages implies that the customer is willing to stick with the current supplier rather than switch to a new supplier, even though they may offer a similar product at a lower price or a superior product at the same price.
- Production advantages provide a company with lower manufacturing costs than its competitors’.
- Efficiency advantages are present if a company has economies of scale in some aspect of its business.
- Advantage due to government policy effectively limit entry into specific markets.
- Valuing competitive advantage:
- If the company does not have a competitive advantage, then its ROIC = WACC, it produces no excess returns, and creates no value for its owners.
- If the company has a sustainable competitive advantage, then its ROIC > WACC, it produces excess returns, and creates value for its owners.
- If the business’s ROIC < WACC, then it produces negative excess returns, and destroys value for its owners.
- Valuing incremental growth:
- If the business’s ROIIC = WACC, then growth creates no value because it produces no excess returns and incremental owner earnings equals incremental capital charges.
- If the business’s ROIIC > WACC, then incremental growth creates value because it produces positive excess returns and incremental owner earnings are greater than incremental capital charges.
- If the business’s ROIIC < WACC, then growth destroys value because it produces negative excess returns and incremental owner earnings are less than incremental capital charges.