
CHAPTER 8
How to Add Value Through Research
As we explain in the previous three chapters, if the wisdom of crowds is functioning properly, then the stock price will fully reflect all available information and be a close approximation of the company’s true intrinsic value. As a result, there will be no mispricing to exploit and no opportunity to outperform with this investment.
Take as an example Dollar General when the stock was trading in mid-2016 at $83 per share. The consensus estimate of the 21 sell-side analysts who followed the stock at the time was a one-year price target of $93, implying a 12% return. If you are researching Dollar General as a potential idea, unless you can identify a mispricing, your estimate of the company’s intrinsic value would match consensus expectations, as shown in Figure 8.1.

Figure 8.1 Dollar General One-Year Price Targets Without Mispricing
To identify a mispricing in a particular security, however, you must find a situation where there is a breakdown in one or more of the three tenets of market efficiency:
- Dissemination—There is information the market is missing.
- Processing—There is a systematic error in processing (caused by a lack of diversity or breakdown of independence).
- Incorporation—There is something preventing information from being incorporated in the stock price (trading is limited because of liquidity or other institutional constraints or agency issues).
If you can identify an inefficiency that cauces a mispricing, then your estimate of the company’s intrinsic value will be different from the consensus. The “different from the consensus view” is known as a variant perspective, as shown in Figure 8.2

Figure 8.2 Dollar General: Variant Perspective Versus Consensus Expectations
As we state in Chapter 4, the estimated intrinsic value of an asset is the sum of the cash flows expected to be produced by that asset, over its useful life, discounted for the time value of money and the uncertainty of receiving those cash flows. Therefore, to have a true variant perspective, you must have a different outlook from the consensus for the company’s future cash flow. These diverging expectations must translate into a different estimate of the company’s magnitude, duration, timing, or growth of cash flows, as we show in Figure 8.3.

Figure 8.3 Variant Perspective Translates to Divergent Estimate for Cash Flows
Returning to the example of Zoe’s Lemonade Stand in Chapter 4, we estimate the lemonade stand’s intrinsic value to equal $9.41 per share, assuming no revenue growth, and $11.97 per share, assuming 10% revenue growth.
Let’s say that your boss asks you to analyze Zoe’s business to determine if it makes sense for him to buy the stock. First, you need to determine consensus expectations. You read research reports, speak with the analysts who follow the company, and contact current shareholders to get their viewpoint. You conclude from your research that the consensus believes that there will be no growth in future cash flow because the current structure and demographics of the neighborhood will limit the growth in foot traffic in front of Zoe’s house. The consensus view is that the business is worth $9.41 per share.
You decide to conduct additional research and attempt to gather nonmaterial, nonpublic information and quasi-public information to augment your analysis. As a result of this research, you learn that there is a public hearing scheduled in a few weeks to discuss the re-zoning of a large parcel of land at the end of Zoe’s block. In discussions with local politicians and real estate developers, you learn there is a proposal, which has not yet been submitted to the town, to build a park with a large swimming pool on the land. You conclude from your analysis that if the project moves forward, the new park and pool will increase the foot traffic past Zoe’s house significantly, which will increase the revenue and cash flow of her lemonade stand substantially. Using this information, you forecast 10% cash flow growth for Zoe’s Lemonade Stand, which implies a target price of $11.97. Since you have a view that is different from the consensus and believe you are correct, you have a variant perspective, the difference of which is shown in Figure 8.4.

Figure 8.4 Divergent View of Future Cash Flows Produces Variant Perspective
The basis for your variant perspective lies in your estimate for a growth in cash flows that differs from the consensus view, as shown in Figure 8.5.
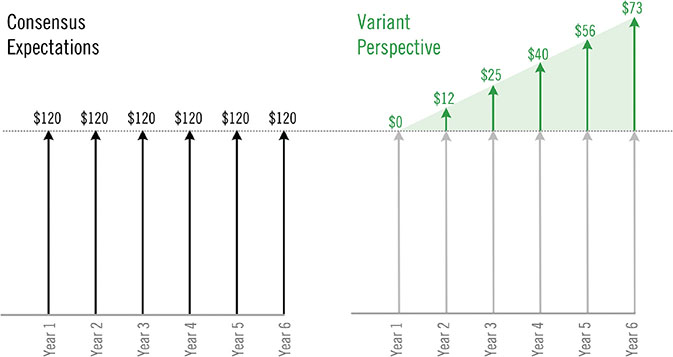
Figure 8.5 Consensus Expectations and Your Variant Perspective For Future Cash Flows
You need to address two critical questions in your analysis: “If the stock is truly mispriced, what is the market missing?”and “What is causing the inefficiency?” You conclude, from reviewing the different tenets of market efficiency, that there is information that has not been adequately disseminated, as shown in Figure 8.6.

Figure 8.6 Stock Mispriced Due to Information Not Being Fully Disseminated
You believe there is a high probability that the large parcel of land will be developed into a park over the next 12 months. If this information were adequately disseminated, processed without systematic error, and incorporated into the stock price, it would trade at a higher price ($11.97) because the stock would then fully reflect all available information, as the process shows in Figure 8.7.

Figure 8.7 Absence of Errors Leads to Efficiently Priced Stock
While this example is simple and makes a lot of assumptions, it illustrates the basic concept of what is necessary for an investor to develop an investment edge. We need to more fully develop the concept of variant perception before moving forward, which we trace back to a legendary hedge fund manager, Michael Steinhardt.

In an interview with Charlie Rose in 2001, Steinhardt explained his concept of variant perception succinctly: “One of the few sure ways to make money in the market is to have a view that is off consensus and have that view turn out to be right.” In his 2001 autobiography, No Bull: My Life In and Out of Markets, Steinhardt further discusses this concept, which he developed in the deep bear market of the early 1970s:
During this period, I began to consciously articulate the virtue of using variant perception as an analytic tool. I defined variant perception as holding a well-founded view that was meaningfully different from market consensus. I often said that the only analytic tool that mattered was an intellectually advantaged disparate view. This included knowing more and perceiving the situation better than others did. It was also critical to have a keen understanding of what the market expectations truly were. Thus, the process by which a disparate perception, when correct, became consensus would almost inevitably lead to meaningful profit. Understanding market expectation was at least as important as, and often different from, fundamental knowledge.1
We want to hammer home this point because it is important in developing an investment edge. There are four critical questions you need to ask to determine if you truly have a variant perspective:
- Is your view different from the consensus? You must have a view that is meaningfully different from the market’s view.
- Are you right? Your estimate of value must be more accurate than the consensus because you either possess better information or have performed superior analysis.
- What is the market missing? You can identify why the current consensus expectations are wrong and whether there is an error in dissemination, processing, or incorporation of information.
- How and when will the situation change? You are confident that within an identifiable time period, other investors will realize that consensus expectations are wrong and reprice the stock to correct the mistake and eliminate the inefficiency.
Simply stated, to have a variant perspective, your view needs to be different and correct. Benjamin Graham touched upon this concept in The Intelligent Investor, when he wrote, “Have the courage of your knowledge and experience. If you have formed a conclusion from the facts and if you know your judgment is sound, act on it—even though others may hesitate or differ. (You are neither right nor wrong because the crowd disagrees with you. You are right because your data and reasoning are right.)”2
In the case of Zoe’s Lemonade Stand, you have a view that was different from the consensus, which satisfies the first element of the Steinhardt framework. Based on your research, you believe you have better information and superior insight, and are confident that your perspective is correct, which satisfies the second element of the framework. From your discussions with analysts and shareholders, you understand why current expectations are wrong—other investors and analysts are unaware of the proposal for a future park and pool—which satisfies the third element. Last, you have confidence that when approval of the project is properly disseminated, processed, and incorporated, other investors will recognize their mistake and reprice the stock.
To outperform the market, you need to have a variant perspective that provides you an “edge” or advantage to exploit the inefficiency. These advantages fall into three categories, which mirror the market inefficiencies we discuss in Chapter 5:
- An informational advantage is present when you have information other investors do not have and, as a result, has not been adequately disseminated. With an informational advantage the investor can state, “I know this is true.”
- An analytical advantage is present when you see things others do not see because there is some type of systematic error (lack of diversity or breakdown in independence) that obscures other investors’ views. With an analytical advantage the investor can state, “I think this will happen.”
- A trading advantage is present when you can trade or hold the security when investors are unable to take or hold a position.
The entire process, which incorporates elements from the three previous chapters on market efficiency, is shown in Figure 8.8.

Figure 8.8 Research Process
As Figure 8.8 shows, Chapter 5, states the rules of market efficiency; Chapter 6, explains the mechanism by which those rules are implemented; and Chapter 7, discusses instances where errors might result in inefficiencies. In this chapter, we discuss ways to gain an edge when the rules of market efficiency are strained and how inefficiencies are corrected.
Informational Advantage
A pure informational advantage exists when an investor has material nonpublic information to which no (or few) other investors have access. The fact that the information is material means that it alone would move the stock price, as we discuss in Chapter 5, The investor can say in this situation “I know with certainty that this information is true.” However, as we previously emphasize, this type of advantage is usually not attainable because of the legalities of trading on material nonpublic information.
Reading an SEC complaint,3 which the Commission files when charging someone with insider trading, provides a detailed account of how a particular investor can outperform by illegally trading on material nonpublic information. In contrast, there are only a few isolated incidents that offer a window into what it would look like if an investor had a pure information advantage that is legal. We should emphasize again that these situations are extremely rare.4
One such example occurred on April 28, 2015, when Twitter’s first-quarter earnings announcement was posted by mistake on its website at 3:07:56 p.m.—an hour before it was supposed to be officially released. A company called Selerity used its web scraping program to discover the announcement. Without any human involvement, Selerity’s software ran the release through several natural language processing algorithms, ascertained the information was genuine, and generated a tweet automatically at 3:07:59 p.m.—a mere three seconds later. Twitter’s trading volume jumped significantly, and the stock price drifted lower as investors who saw (and believed) the information realized that Twitter’s financial results were worse than expected and that other investors would be disappointed by the news.
By the time trading in the stock was halted by the exchange at 3:29 p.m. it had declined 5%, down $2.56 to $48.67. When the stock resumed trading at 3:48 p.m., after the news had been fully disseminated, it reopened at $40.86, down another $7.81, for an additional loss of 16%. Traders who exploited the inadvertent news release had a clear informational advantage over other investors, as demonstrated by the stock’s ultimate, and full, reaction to the news, as shown in Figure 8.9.

Figure 8.9 Twitter’s Stock Performance in Reaction to Its Inadvertent First Quarter Earnings Release
A total of 15.2 million shares traded during the 21 minutes between the Selerity tweet and when trading in the stock was halted. Although several traders exploited the inadvertent news release, it was clear an inefficiency existed because the new information was not adequately disseminated, and therefore not incorporated into the stock price, as shown in Figure 8.10.

Figure 8.10 Stock Mispriced Due to Information Not Being Fully Disseminated
The materiality of the information was confirmed by the price move when the stock reopened after the news had been broadly disseminated. The investors who had the information contained in the premature release knew that the earnings were disappointing when other investors did not. They sold stock before trading was halted because they believed they had a pure informational advantage. And it was perfectly legal.
Running this example through the Steinhardt framework confirms that the possession of the information by certain investors gave them a variant perspective:
- Was the view different from the consensus? Yes, investors with the information knew that Twitter had missed analyst consensus estimates for the quarter.
- Are you right? Yes, the advantaged investors knew the information was from a reliable source and accurate.
- What is the market missing? Since the release was not adequately disseminated, the consensus did not have the information of the earnings miss.
- When and why will the situation change? The advantaged investors knew that as soon as the information was adequately disseminated, the stock price would change to fully reflect the new information.
Analytical Advantage
Whereas an informational advantage is made possible by an inefficiency in the dissemination of information, an analytical advantage is made possible by an inefficiency or error in how the market processes that information. An investor possesses a pure analytical advantage when they see things other investors do not see. An investor with an analytical advantage can look at the exact same set of public information as other investors, yet, after analyzing the data, arrives at an estimated value for the stock that differs from the consensus and ultimately proves to be correct.
This type of inefficiency is caused by a systematic error in the processing of information from either a lack of diversity or a breakdown in independence, as we discuss in Chapter 6. Diversity exists when individuals in the crowd have different expertise, know different facts, and use different models to arrive at their estimate of intrinsic value. On the other hand, if the market participants have the same facts and expertise, use the same model, and begin thinking the same way, then diversity is lost. Without diversity, the crowd produces an answer that is only a small deviation from the average individual estimate. In these situations, the crowd’s estimate reflects just a single view rather than multiple views, like the neon nose diagnosis example in Chapter 6.
In contrast, independence is defined as individuals making guesses autonomously from others in the crowd. If enough of the participants are influenced and in turn, biased in a systematic way, the wisdom of crowds collapses to what is essentially a single view or the view of only a few individuals.
If you possess a true analytical advantage, you see the situation differently from other investors because you have identified a systematic error. As time passes and events unfold, the other investors see what you saw and their perception changes to yours. As your variant nonconsensus view of the stock’s true intrinsic value is proven to be correct, it becomes the new consensus view, the market corrects, the stock reprices, and your investment outperforms.
While we discussed in detail the processing errors that result from a lack of diversity or breakdown in independence in Chapter 6, we can illustrate this concept with a simple example. The following story dovetails nicely with Robert Shiller’s definition of a bubble, which he described as “a situation in which news of price increases spurs investor enthusiasm which spreads by psychological contagion from person to person.”5
Imagine there is an engineered virus that is released by a nefarious radical group, causing a pandemic that renders people color-blind.6 After being infected, most people see nothing but gray dots when looking at the following image:

The virus doesn’t infect everyone. Some people are immune, and you are among that group. You look at the same image, and, as plain as day, see the number 12.

Weeks later, you argue with friends, exclaiming, “Can’t you see the number 12? It’s right there in front of you.” They reply, “I don’t know what you are talking about. I’m staring right at the picture and all I see is a bunch of gray dots.”
Meanwhile, a team of scientists at the Centers for Disease Control (CDC) frantically works around the clock to find a cure. After a successful vaccine is finally developed, the CDC does everything in its power to produce enough of the antidote, but production is limited and vaccinations are rationed in a lottery based on an individual’s birthday, although everyone will receive the medicine over the course of the next 12 months (approximately 1/365 of the population is cured each day). The drug is effective and people’s ability to see colors returns immediately after being vaccinated. Your friends look at the image after receiving the vaccine and exclaim, “Hey, I can see the number 12. Now I know what you were talking about!”
The investment world often seems like this fictional story when you have a pure analytical advantage. You see patterns that others don’t see, and you often cannot understand why they don’t see what seems obvious to you. Assuming you are right, as events unfold over time, other investors eventually begin to see what you originally saw, almost as if they have been cured of some illness, and the stock reprices to reflect your view. Keep in mind that the speed at which investors are “cured” can vary wildly from situation to situation, which is why mispricings can correct in a short period of time or persist for years.7
An example similar to this story involves one of Paul S.’s former students, Dan Krueger,8 who made an investment in Herbalife convertible bonds in 2014.9 Herbalife is a multilevel marketing company founded in 1980 that sells nutritional products primarily for weight loss. In December 2012, Bill Ackman of Pershing Square, a savvy and successful investor, gave a three-and-a-half-hour, 342-slide presentation disclosing a huge short position he held in Herbalife’s stock. Ackman concluded his remarks by claiming that Herbalife was nothing more than a Ponzi scheme and “a criminal enterprise.” After the presentation, the stock promptly fell 42% to $24.24 per share. Ackman said that he thought the stock was “a zero.” Eventually, both the U.S. Securities and Exchange Commission (SEC) and U.S. Federal Trade Commission (FTC) opened investigations into Herbalife, most likely prompted by the publicity around Ackman’s presentation. In late July 2014, Herbalife posted earnings that missed analyst estimates, and Ackman gave another three-hour presentation. He was so emotional in his delivery that his eyes welled up with tears. The second presentation was extremely persuasive, and the stock fell by 28% that week, while Herbalife’s convertible bonds fell by 19% to a price of $78.10
The investor base for Herbalife convertible bonds at that time consisted primarily of two distinct groups: convertible arbitrage investors and investment-grade bond investors. Using sophisticated computer models, convertible arbitrage investors buy corporate bonds and sell stock short against their bond position. The investment strategy exploits any mispricing between the bonds and the common stock. Investment grade bond investors, on the other hand, perform fundamental research to identify bonds that offer an attractive return relative to the investor’s estimate of the bond’s probability of default. Both groups of investors sold bonds during the week after Ackman’s second presentation, although for different reasons. The convertible arbitrage investors liquidated their positions because their computer models instructed them to do so when the stock collapsed, while the investment grade bond investors liquidated their positions because they feared the probability that Herbalife might default had increased substantially.
Wall Street bond “experts” looking at the situation at the time calculated that a more “appropriate” value of the bonds was $87 rather than the $78 price quoted for the bonds after the sell-off. While the information from Ackman’s presentation was adequately disseminated, the apparent mispricing was caused by investors processing the information with a systematic error resulting from a pre-existing lack of diversity in the two groups holding the Herbalife bonds was exacerbated by a breakdown in independence, as shown in Figure 8.11.

Figure 8.11 Error in Processing Results in Mispriced Stock
The pre-existing investor base lacked diversity because it was dominated by the two groups of bond investors, who, within their respective groups, used similar models. The situation was like the herding behavior that occurred during the Quant Crisis in 2007, which we discuss in Chapter 7. While the lack of diversity did not create a mispricing by itself, Ackman’s presentation acted as an external force to skew the consensus and create a mispricing.
Many of the investment-grade investors believed that Ackman had performed an exhaustive analysis and was correct in his assessment of Herbalife’s financial health. These investors set aside their own estimates of intrinsic value in reaction to Ackman’s comments and adopted his view, creating an information cascade. The result was that investors who might have stepped in to purchase the Herbalife bonds at $87 (where the “experts” felt they should have traded) stood on the sidelines.
Dan, and other investors like him, reached a different conclusion than the consensus view solely based on their analysis of the same public information that all other investors had access to and, as a consequence, developed a variant perspective.
Dan made several important observations as he performed his analysis. The decline in the price of the bonds was driven by investors’ fear that Ackman was right and the FTC would shut down Herbalife. However, the FTC has jurisdiction over only the company’s US operations. The bonds were issued and backed by Herbalife’s international subsidiary, which accounted for 80% of the company’s revenue. Therefore, even in a worst-case scenario, with the US entity being forced into bankruptcy, the foreign entity would not be directly impacted. Also, the assets and cash flow of the international subsidiary were more than adequate to meet the debt obligation. More to the point, there was no guarantee that the FTC would rule against Herbalife or, if it did, that the US entity would be forced into bankruptcy. Dan bought Herbalife bonds after he concluded that the risk of default was much lower than the price of the bonds implied.
Dan had no special information in this situation. All the information was public, Dan just had better insight. He looked at the same data set that was available to all investors and drew a different conclusion. His analytical advantage created a true variant perspective. He believed the market view was wrong and had confidence that the default risk of the foreign subsidiary was highly unlikely and, ironically, never really in question despite Ackman’s accusations. As the consensus view changed to match Dan’s variant perspective, the bonds recovered in price, generating excess returns for Dan’s fund.
Reviewing the situation through the Steinhardt framework shows that Dan had developed a variant perspective:
- Was the view different from the consensus? Yes, Dan believed the market was overreacting to the possibility of default.
- Are you right? Yes, Dan could demonstrate that even if the US subsidiary declared bankruptcy, the bonds of the international subsidiary had little default risk.
- What is the market missing? The constituency of convertible arbitrage investors was selling based on their computer models and ignoring the company’s fundamentals; the other constituency of investment-grade investors was swayed by Ackman’s accusations and overestimated the possibility of default. New investors who might have purchased the bonds were dissuaded from doing so by Ackman’s presentation.
- When and why will the situation change? As investors realized that the default risk of the bonds was low, the mispricing would correct and the securities would trade back to their previous value.
As the answers to the four questions show, Dan had developed a view that was different from consensus expectations, as shown in Figure 8.12A. For Dan, it was a win-win situation. While he expected the Herbalife bonds to trade back to par quickly once investors realized that they had overreacted to Ackman’s presentation, which would result in a 28% total return on his investment, he would earn 12.2% annually in the event he had to wait for the bonds to reach maturity, as we show in Figures 8.12 A and B.
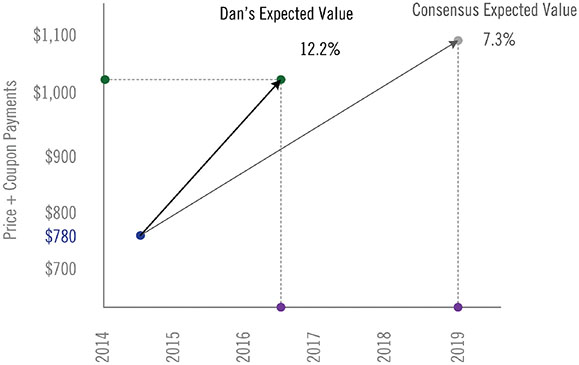
Figure 8.12A Dan’s Expected Return from Herbalife Bond Position

Figure 8.12B Dan’s Actual Return from Herbalife Bond Position
We should emphasize that developing a variant perspective solely based on a pure analytical advantage is hard to achieve, even for the most experienced investors. It requires a lot of experience and deep domain-specific knowledge to pick up on these types of mispricings.
Informational + Analytical Advantage
Because pure informational advantages are rare and pure analytical advantages require decades of experience, the most common way successful investors identify mispriced securities to outperform the market is by blending the two, combining an informational advantage with an analytical advantage.
This process usually begins with the analyst digesting all publicly available information. An experienced analyst knows where to focus his efforts, which makes this process quick and efficient. If the idea is sufficiently interesting, the analyst will do a deeper dive, which usually entails collecting additional pieces of information, most of which is nonmaterial and nonpublic, or quasi-public. The analyst applies his analytical process to all the information with the goal of reaching a conclusion that is material, nonpublic, but legal. Judge Walter Roe Mansfield of the United States Court of Appeals for the Second Circuit summed up succinctly his views on this approach in 1980, in his decision in Elkind v. Liggett & Myers, Inc.:
A skilled analyst with knowledge of the company and the industry may be able to piece together seemingly inconsequential data with public information into a mosaic11 to produce a meaningful analytical edge.12
It is important to emphasize that the nonmaterial, nonpublic information alone would not impact the stock price because the information is nonmaterial, by definition. The information is merely a piece in Judge Mansfield’s mosaic. When that piece of information is added to the analyst’s overall assessment of the opportunity, he begins to see something other investors failed to perceive and the overall picture becomes clearer. The inefficiency in the stock price, and the opportunity for the analyst to develop a variant perspective, is caused by the fact that the nonmaterial, nonpublic information has not been disseminated and, therefore, has not made its way into the crowd’s processing models. The analyst has created an edge by using his analytical expertise to direct his research process. He has combined nonmaterial, nonpublic information with the fully disseminated public information in a unique way to create a differing view from the consensus. In other words, the analyst has developed a variant perspective based on his informational and analytical edge.
We use a small public company, which we will call Cloverland Timber, as an example to illustrate this point. Although the example is based on a true story, we have taken a little poetic license with the facts and changed the names to protect the innocent (and the guilty).
The company in the example owns and manages approximately 160,000 acres of timberland in northern Wisconsin. At the time the story begins, the family of the founder still controlled approximately 26% of the company’s outstanding shares.
In 2013, John Helve of Brownfield Capital became aware of Cloverland and began conducting research. Cloverland’s primary asset is its timberlands, which the company harvests to generate cash flow. The company has the timberlands appraised every three years by an independent third party. Management uses the appraisal to value the company’s assets and provides the estimates to its shareholders. The most recent appraisal estimated the timberland’s value at $140 million, or $865 per acre, which equates to a per share value of $107. At the market price of $78 per share, it appeared to John that the stock was trading at a significant discount to its intrinsic value, although the expected annual return would be dependent on how long would it take for investors to realize the value and close the gap.
John accepted the company’s appraised value of the timberland in his initial analysis and assumed a 3% annual growth in the value of the trees,13 which would result in a per share value of $144 in 10 years. John also calculated that the spread between the stock price and intrinsic value would have to close within the next five years for the stock to generate an annual return above the S&P 500’s historical long-term return of approximately 9.7%. From John’s vantage point, if the gap closes in less than five years, the stock will outperform the market. If it takes exactly five years for the gap to close, then the stock’s annual return will equal the long-term average of the S&P 500. However, if it takes longer than five years for the gap to close, the stock will underperform the market. We show this analysis in Figure 8.13.

Figure 8.13 Investment Time Horizon and Breakeven Point
John inferred from this analysis that the consensus time horizon must be five years or less. Therefore, as part of his analysis, John was on the lookout for any event or corporate development that would cause the gap to close sooner than the implied five-year consensus time horizon.
Consensus expectations became clear to John as he performed his research. Timber is considered to be a unique asset in that trees physically grow larger every year, which increases their financial value. As long as management is prudent and doesn’t overcut the trees, there is limited risk to the value of the timberland.
Through his analysis, John noticed certain operating metrics in the financial statements that indicated to him the timberlands were, in fact, being undercut, meaning that management was not harvesting the trees to optimize cash flow and maximize shareholder value. This strategy could be explained by the fact that the family that controlled Cloverland had significant financial incentives to keep the company’s value low to minimize estate taxes.
John surmised that while Cloverland owned attractive assets that were trading at a discount to their intrinsic value, from an average investor’s point of view, there was no way to realize the value. There were also other negative factors affecting the situation. Cloverland’s stock was not listed on an organized exchange like the NYSE or NASDAQ, and the company was not required to file periodic financial reports with the SEC. In addition, its market capitalization was small and the market for the stock was illiquid.
John recognized that these impediments would discourage investors from buying the stock, and the shareholder list reflected these constraints. The company’s shareholder base was comprised primarily of long-term, “deep-value” investors who gravitated toward situations where they could buy assets at a discount, although often without a predetermined catalyst to realize the value. Investors on Wall Street sometimes characterize these situations as “sleeping beauties.” These stocks might be “asleep” with little movement for years and years, and then, one day, wake up and reward investors for their patience. However, it is important to note that the group of shareholders in many of these situations lacks diversity because the investors all think the same way.
These factors most likely explain why the stock appeared to trade at a large discount to its intrinsic value, as indicated in Figure 8.13. The mispricing was caused by both a breakdown in processing (caused by a lack of diversity in the shareholder base) and impediments to incorporation (caused by the stock’s low liquidity).
However, the mispricing may be a mirage and the investment may be what is referred to as a “value trap.” An investor looking at the situation for the first time might buy the stock thinking that the value will be realized in less than five years, but if history is an accurate guide, this assumption will be overly optimistic. As Cloverland’s shareholders can testify, Cloverland stock has increased by only 2% in the 10 years ending November 2016, while the S&P 500 increased by 58%, producing 56 percentage points of negative underperformance for anyone holding the stock for the prior decade.
John had a variant perspective because he believed that a more detailed physical appraisal of the timberland would show that the trees were more valuable than the company’s published appraisal. Also, because Cloverland did not file with the SEC, John’s fund could accumulate a large position in the company without having to file a notice with the SEC if his fund’s ownership exceeded 5%, or even 10%, which is required if an issuer files periodic reports with the SEC.
Normally, forestry experts determine the value of timberland by driving around the property in off-road vehicles and recording statistics such as the species, age, and acreage density of the trees. The experts use that information to estimate the timberland’s per-acre value. The process is a low-tech, time-consuming, pen-and-paper process. In Cloverland’s case, the company owns 160,000 acres of timberland, spanning 250 square miles, which is an enormous area to survey comprehensively. Rather than analyze each acre, the experts based their appraisal on sampling various sections of the property, which, depending on the size of the sample, can result in highly inaccurate assessments.
In an ideal world, John would conduct his own appraisal and survey each and every acre. However, that wasn’t possible for two reasons. First, surveying each acre using traditional methods would be exceedingly time-consuming and prohibitively expensive. Second, the timberlands were private property and it would be highly unlikely that the company would grant John access. Sitting in his office, John thought, “How could I get an accurate estimate with all these constraints?” The answer was technology.
John realized the most cost-effective solution would be to hire a company that specializes in valuing timberland using satellite images. The company he selected starts its analysis by leasing time on a satellite, flying the satellite over the area they want to survey, and taking photographs. The consultants then use computer algorithms to accurately determine the species and size of the trees, and their density per acre. Their methods provide a more accurate value of the timberlands than that used traditionally in the industry, as it eliminates sampling errors.
John was pleasantly surprised by the survey results. The consultants determined that a large percentage of the trees were sugar maple, a hardwood that is much more valuable than softwoods. While Cloverland mentioned in their published survey that there was an “above-average mix of hardwood,” the company offered no additional information about their findings. John now had detailed information about the trees. The analysis also confirmed John’s suspicions that the trees were undercut, and in fact, the age of the trees was much greater than the average forest. In John’s opinion, these factors meant that the value per acre was significantly higher than the appraised value. His newly revised value for the timberlands was $1,130 per acre, or $142 per share. John’s estimate of intrinsic value represented an implied total return of 81% from the market price of $78 per share, with little downside risk.
John was concerned that his fund’s accumulation of shares would likely put upward pressure on the stock price, even if he was patient and purchased shares slowly over time. Factoring in the unavoidable price increase caused by his share purchases, John estimated that his fund’s average cost would be approximately $85 per share for his entire position. Rerunning his analysis with the higher estimated purchase price and the new intrinsic value estimate of $142 per share, John’s expected annual rate of return looked even more appealing because the potential total return was higher and the time frame to match the S&P 500’s return was now three years longer, as shown in Figure 8.14:

Figure 8.14 Investment Time Horizon with Extended Breakeven Point
The average long-term return for the S&P 500 has been approximately 9.7% since 1926. John assumed in his analysis that the market would generate a similar return in the future. Therefore, he calculated that he had roughly eight years for the stock to reach his estimated future intrinsic value before the investment underperformed the market. The most comforting aspect of the investment was that the return profile was asymmetrical. John estimated that there was an opportunity for significant gains with little downside risk. What about timing? The consensus expectations were that the value was trapped by the large family ownership, a view that was reinforced by the numerous unsuccessful attempts by an activist investor named Ron, who repeatedly tried to get board representation. John felt strongly that he could do a better job of motivating management to unlock value for shareholders. He felt that the best way to realize the true value of the timberlands was to sell the company. He estimated that it might take as long as three years to get the company sold, although there was risk in that he might not be successful. Even if he wasn’t successful in forcing a sale of the company, John calculated that there was little downside risk to the investment. Figure 8.15 shows John’s variant perspective, based on his estimated intrinsic value and expected time horizon, resulting in an implied annual return on the investment of 22.2%.

Figure 8.15 John’s Perception of Error by the Consensus
John’s fund, Brownfield, acquired a significant percentage of Cloverland stock over the next two years, which ultimately matched the family’s ownership stake of 26%. Brownfield disclosed this position in the first half of 2016 and was given a board seat shortly thereafter. In late December 2016, Brownfield obtained another board seat and, to avoid a proxy battle, Cloverland’s board agreed to engage an investment banker to explore a sale of the company.
John’s view differed from the consensus in two important ways. First, he believed the magnitude of future cash flows would be higher because the timberlands were worth $1,130 per acre rather than the consensus view of $865. Second, his view on the time it would take to realize the value was three years compared to the consensus implied view of five years.
Running this example through the Steinhardt’s framework highlights John’s investment edge:
- Was the view different from the consensus? Yes. John believed the value per acre to be much higher and the time frame to realize that value much shorter than the consensus view.
- Are you right? Yes. John had the satellite data to back up his estimated value. Although he could not be certain that he could shorten the time frame to realize that value, he was confident that there was little downside risk to his investment.
- What is the market missing? The market did not have the satellite data or know that John was planning to become an activist and ultimately pressure management to sell the company to a third party.
- When and why will the situation change? John believed strongly that he could force management to engage in a “liquidity event” to unlock value for shareholders within three years.
Trading Advantage
Whereas an informational advantage is made possible by an inefficiency in the dissemination of information and an analytical advantage is made possible by an inefficiency in how the market processes that information, a trading advantage is caused by an inefficiency that prevents the information from being incorporated into the stock price because of impediments that limit investors from trading.
If an investor possesses a true trading advantage, he can trade a security when other investors are unable or unwilling to take or hold a position. We discuss this limitation at length in Chapter 7, where we identified two main institutional constraints as its cause. The first is liquidity constraints that limit an investor’s ability to execute or trade a security. The second is anticipated or actual redemptions from clients that prevent an investor from taking a position in the first place or holding a position long enough for the market to correct the mispricing. We show in Figure 8.16 how an impediment to incorporation can result in a mispricing.

Figure 8.16 Stock Mispricing Caused by Error in Incorporation
To circumvent the liquidity constraint and obtain an advantage, the investor either must be patient while he accumulates a position over time or have a smaller fund or smaller position sizes that enables him to accumulate a full position in a less liquid security.
Captive, loyal, or permanent capital eliminates the fear of redemptions, giving managers with this type of capital a significant advantage over other funds because they can invest without worrying about their investors redeeming their capital at the worst possible moment.
Catalysts
Before we can communicate how to think correctly about catalysts, we need to do a bit of a review.
First, we need to solidify the understanding of:
- What conditions are necessary for a stock to be efficiently priced.
- What creates an advantage or investment edge.
- What defines a variant perspective.
A stock will be efficiently priced if it reflects all available information, which means that:
- Information is adequately disseminated with market participants observing, extracting, and aggregating the information.
- Information is processed by market participants who evaluate and estimate without systematic error.
- Information is expressed, aggregated, and incorporated into the stock price through trading.
These conditions are shown in Figure 8.17.

Figure 8.17 Requirements for an Efficient Stock Price
We can conclude that the consensus will fail to produce an efficiently priced stock only if at least one of the following four conditions exists:14
- Information is not available and observed by a sufficient number of investors.
- There is a lack of diversity.
- There is a breakdown in independence.
- Estimates are not expressed, aggregated, and incorporated into the market price.
For an investor to obtain an advantage, he needs to develop an informational advantage by gathering information the consensus does not have, an analytical advantage by seeing something the consensus does not see, or a trading advantage where he can trade when other investors cannot or will not trade.
To have a variant perspective, an investor needs to identify a genuine mispricing or an error made by the market, which means that:
- The investor has a view that is different from the consensus: The differing view is reflected by a spread between the stock’s price and its intrinsic value. The larger the gap, the greater the potential return and the more the investor’s view differs from the consensus.
- The investor is right: The investor can demonstrate that they have an informational advantage, analytical advantage, or a trading advantage, and has performed sufficient research to be confident in their claim.
- The investor can identify exactly what the market is missing: The investor has identified and understands what is causing the mispricing in the market, which must be an error in the dissemination, processing, or incorporation of information.
The fourth requirement—that the analyst can estimate with precision when and why the situation will change—is where catalysts enter the discussion. A catalyst is defined as any event that begins to close the gap between the stock price and your estimate of intrinsic value, represented by the shaded gray triangle in Figure 8.18.

Figure 8.18 Stock Performance Heat Map

A catalyst is an event that increases the dissemination or availability of information, restores the crowd’s diversity and/or independence, or alleviates any trading limitations. The catalyst informs the crowd that the consensus view is incorrect and starts the process of having individuals in the crowd begin to adopt your variant perspective, similar to how the color blindness vaccine restored individuals’ ability to see the number 12 in the example earlier in the chapter. Simply put, the catalyst can be additional information the market does not have, an event that forces investors to observe and process the information without bias, or a change that increases investors’ ability to express and incorporate their view by trading the stock. In the end, a catalyst removes the inefficiency in the stock price.
Gems:
- To outperform the market an investor needs a variant perspective that identifies an inefficiency and provides an advantage, or edge, for him to exploit the mispricing. These advantages fall into three categories, which mirror the market inefficiencies:
- An informational advantage is present when an investor has information other investors do not have and that, as a result, has not been adequately disseminated to a sufficient number of investors.
- An analytical advantage is present when an investor sees things other investors do not see because there is some type of systematic error or lack of diversity that obscures other investors’ views.
- A trading advantage is present when an investor can trade or hold the security when other investors are unable to take or hold a position.
- With a pure information advantage an investor can say, “I know with certainty that this information is true.” This type of advantage is usually not attainable, however, because it is illegal to trade on material nonpublic information.
- An analytical advantage is made possible by an inefficiency in how the market processes information. An investor with an analytical advantage looks at the same set of public information as other investors, yet, arrives at a value for the stock that differs from the consensus and ultimately proves to be correct.
- Because pure information advantages are rare and pure analytical advantages require decades of experience, the most common way successful professional investors outperform the market is by blending the two, looking to combine an information advantage with an analytical advantage.
- A trading advantage is made possible by an inefficiency that prevents information from being incorporated into the stock because it impedes investors from trading on the information.
- A catalyst is any precipitating event that informs the crowd that the consensus estimate is wrong and causes the consensus view to begin to shift. The event may not close the gap fully between the current market price and the stock’s correct value, but it must start the process of closing the gap to qualify as a catalyst.
- A catalyst increases the availability of information, restores the crowd’s diversity and independence, or removes any trading limitations. The catalyst informs the crowd that the consensus view is incorrect and can be additional information the market does not have, an event that forces investors to observe and process the information without bias, or a change that increases investors’ ability to express their view by trading the stock.
- In simple terms, a catalyst removes the inefficiency in the stock price.