
Chapter 3
Overview of EROM Process and Analysis Approach
This chapter discusses some of the main processes and analysis activities that are involved in conducting EROM in coordination with organizational planning, plan implementation, and organizational evaluation of performance. The topics include the basic principles for deriving organizational objectives hierarchies; developing risk and opportunity information for each objective; understanding risk tolerance and opportunity appetite; composing enterprise risk and opportunity scenario statements; identifying corresponding risk and opportunity leading indicators, including leading indicators for unknown and underappreciated (UU) risks; correlating strategic success likelihoods with leading indicator values; rating the likelihood of success for the various goals and objectives; and identifying/evaluating various options for mitigating risk, availing opportunity, and setting up internal controls. More complete guidance on setting up an internal control structure that is integrated with EROM will be provided in Chapter 10.
3.1 Organizational Objectives Hierarchies
3.1.1 Objectives Hierarchies for Each Management Unit
Although the particulars of the management structures of TRIO enterprises tend to vary from one organization to another, the process of developing objectives hierarchies for each management unit tends to be uniform. It consists of identifying the unit's top objectives, which tend to be mandated by the entities that the management unit supports, and for each top objective, devising a set of underlying performance objectives whose success leads to the success of the top objective. The top objectives generally have a longer-term focus, and the supporting performance objectives a shorter-term focus.
Strategic planning at the executive level generally produces a set of strategic objectives, and under the strategic objectives a set of top programmatic objectives and a set of top institutional and technical objectives (see Figure 3.1). The strategic objectives typically cover a 10-year time frame or greater, and the top programmatic objectives typically cover a 5- to 10-year time frame, although these boundaries are flexible. Similarly, the top institutional and technical objectives typically cover a 5- to 10-year time frame and support the top programmatic objectives.

Figure 3.1 Types of objectives developed at the executive level
The managerial units at the programmatic level typically consist of a set of program directorates, each of which is responsible for one or more of the top programmatic objectives that flow down from the executive level. Underneath each top programmatic objective is a set of nearer-term objectives, which for convenience are divided into different time frames (see Figure 3.2). At some TRIO enterprises, these nearer-term objectives are referred to as performance goals, which have a one- to five-year time frame, and annual performance goals, which have a one-year or less time frame. For federal agencies, the performance goals with especially high priority are referred to as agency priority goals (APGs), or sometimes as agency priority initiatives (APIs). In this book we refer to the performance goals and annual performance goals as mid-term objectives and short-term objectives, respectively, to keep the nomenclature more-or-less generically applicable across all TRIO enterprises.

Figure 3.2 Types of objectives developed at the programmatic level
The managerial units at the institutional/technical level at TRIO enterprises typically consist of a set of technical centers. Each technical center generally serves two purposes: (1) developing and maintaining the institutional and technical capabilities needed to satisfy those strategic objectives that pertain to infrastructure and technical capability, and (2) taking technical (often including technical management) responsibility for ensuring that the programmatic objectives are successfully satisfied.1 Similar to the objective breakdown for the program directorates, the objectives for the technical centers start from top objectives passed down from the executive level and continue down to mid-term and short-term objectives. This breakdown is shown in Figure 3.3.
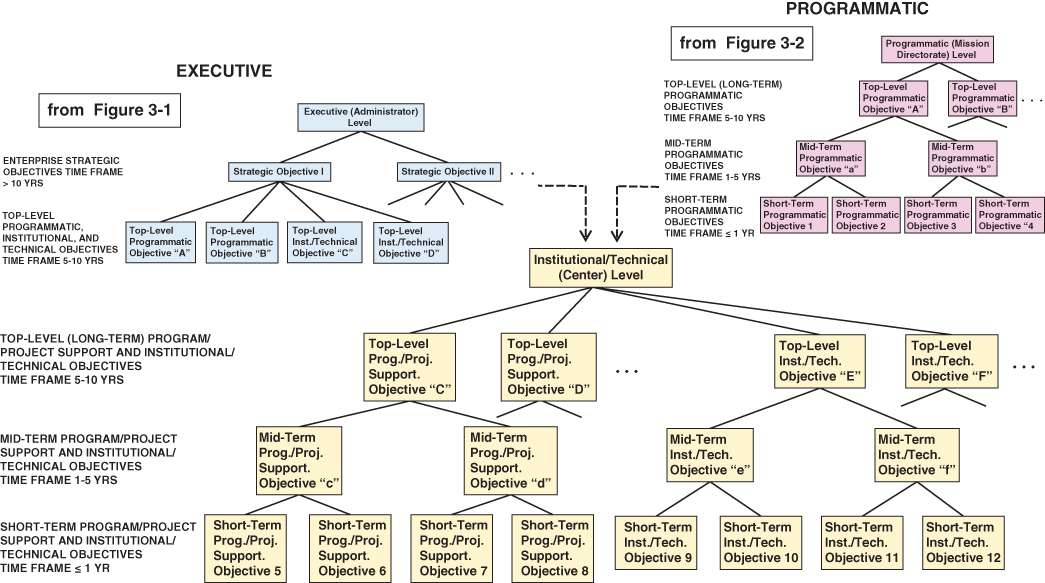
Figure 3.3 Types of objectives developed at the institutional/technical level
3.1.2 Objectives Hierarchy for the Enterprise as a Whole
Once the objectives hierarchies have been determined for each management unit of the enterprise, it should be possible to combine them into a single enterprise-wide objectives hierarchy that consists of an amalgam of the various management unit hierarchies. A conceptualization of such a composite enterprise-wide objectives hierarchy is shown in Figure 3.4. The dashed arrows between units in this figure are intended to be representative of the interfaces that would exist between different management units and their respective objectives. It is these interfaces that dictate how the status of objectives within the various management units affects the status of the strategic objectives at the top of the enterprise.
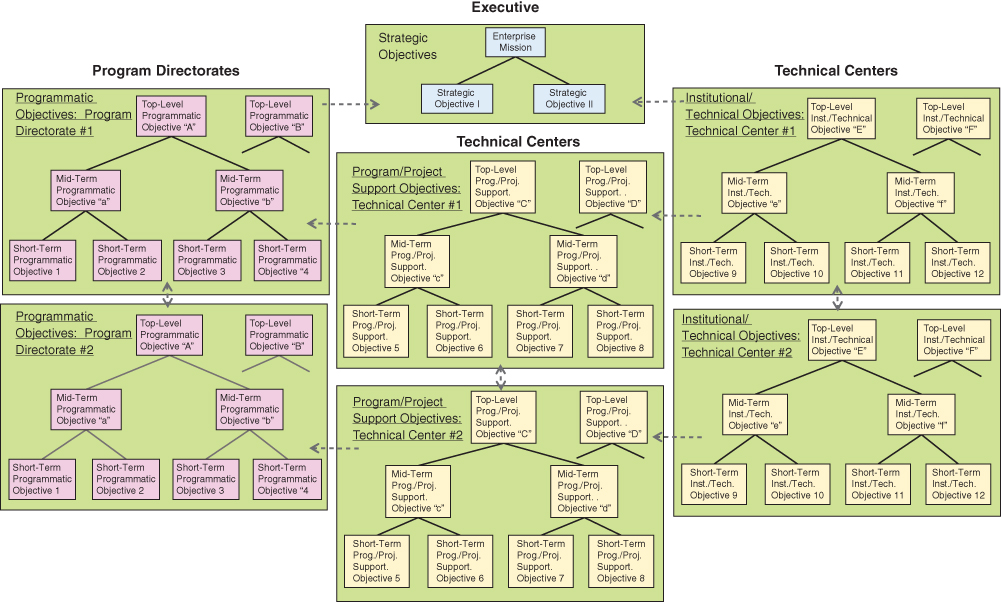
Figure 3.4 Conceptualization of an enterprise-wide objectives hierarchy
The interfaces shown by dashed arrows in Figure 3.4 are in reality a simplification of the complex interactions that tend to exist between the various management units and their objectives. These interactions are better displayed by other means such as tables and templates.2
3.2 Populating the Organizational Objectives Hierarchies with Risk and Opportunity Information
A principal product that EROM provides to support both organizational planning and organizational performance evaluation is an assessment, including a ranking, or rating, of each objective in the objectives hierarchy in terms of its cumulative risk and cumulative opportunity. The cumulative risk, or aggregate risk, for an objective is basically the likelihood of not being able to achieve the objective based on following the current plan. The cumulative opportunity for an objective is the likelihood that it will be possible to improve the plan based on future developments so as to be able to achieve the objective. Refer to Section 1.2.4 for a definition of these terms.
This ranking evolves as a result of completing the processes that were outlined in Sections 2.3.1 and 2.3.2 and depicted in Figures 2.6 and 2.7. The processes involve the following steps, the results of which are illustrated in Figure 3.5:
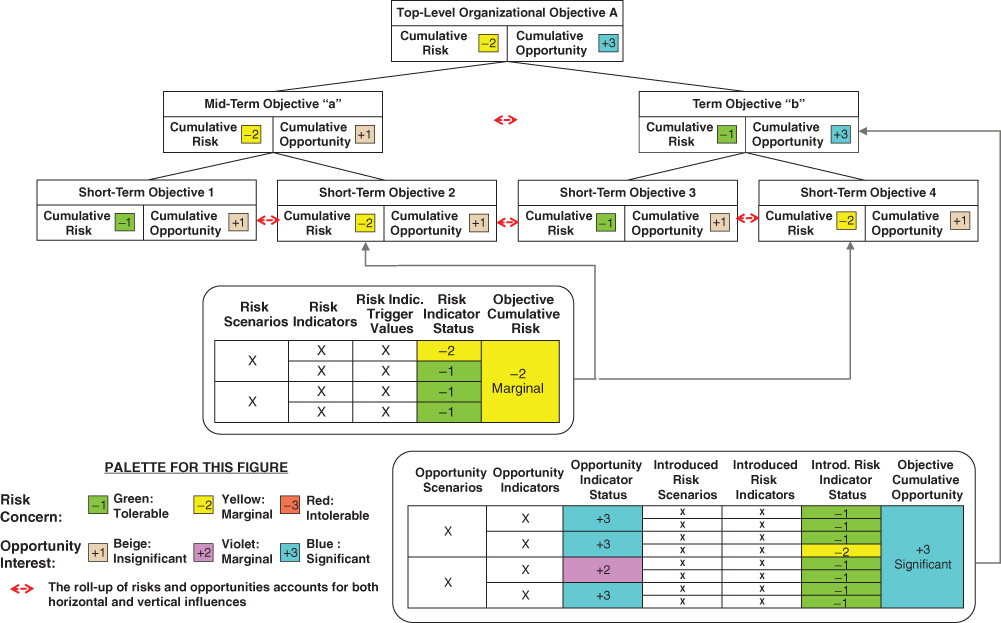
Figure 3.5 Associating risk and opportunity information with objectives in the organizational objectives hierarchy
- Identify the individual risks and opportunities that affect each objective.
- Identify associated leading indicators that can be used to gauge the significance of the risk/opportunity and trend its status over time.
- Establish trigger values for the leading indicators based on the risk tolerances and opportunity appetites that the stakeholders (which may include both external funding authorities and internal decision makers) have relative to the affected objective(s).
- Determine the current status of each leading indicator, accounting for both the current values of the indicators and their current trends.
Two other steps are depicted in Figure 3.5, the intricacies of which may not be immediately obvious to the reader:
- Roll up the statuses of the risk and opportunity leading indicators for each objective to infer aggregate risk and opportunity status rankings (or ratings) for the objective.
- Roll up the risk and opportunity status rankings for all objectives in the hierarchy to infer risk and opportunity status rankings that include influences from other objectives.
The processes involved in performing these roll-up steps will become more apparent as the explanation of the processes unfolds in later sections.
As called out in Figure 3.5, the same steps are performed with the same form of results being obtained whether the processes are applied during organizational planning or during organizational performance evaluation. During organizational planning, details of architecture and design are generally not yet available, and so the risks and opportunities are based on historical experience. During organizational performance evaluation, the architectures and designs are in a mature enough state to base the risks and opportunities on actual architectures and designs.
In Figure 3.5, the information provided for the individual opportunities may be seen to include not only opportunity scenarios but also introduced risk scenarios. Introduced risks are a byproduct of opportunities in the sense that the fulfillment of an opportunity requires an action that is not currently in the plan and that may introduce one or more associated risks. For example, availing an opportunity created by the emergence of a new technology may introduce risks associated with first-of-a-kind uncertainties and development costs.3
3.3 Establishing Risk Tolerances and Opportunity Appetites
As discussed in Section 1.2.3 and depicted conceptually in Figure 1.2, a preliminary step needed before establishing trigger values for leading indicators or rolling up individual risks and opportunities to cumulative values is to establish the risk and opportunity posture for the stakeholders. The risk and opportunity posture is specified through an elicitation of their risk tolerance and opportunity appetite for each objective on the objectives hierarchy.
Risk tolerances and opportunity appetites for the top organizational objectives generally evolve from a roll-up of the tolerances and appetites specified by the stakeholders at the lower levels, taking into account other considerations such as the time frame for response.
3.3.1 Risk and Opportunity Parity Statements
The risk tolerances and opportunity appetites elicited from the stakeholders may be expressed in the form of risk and opportunity parity statements. These statements define boundaries between tolerable and intolerable risks, and between significant and insignificant opportunities.
Each risk and opportunity parity statement reflects a common level of pain or gain from the stakeholders' perspective. This enables comparisons between risk and opportunity to be meaningful because:
- The amount of risk perceived by the stakeholders (i.e., their level of pain) is the same for each parity statement.
- The amount of opportunity perceived by the stakeholders (i.e., their level of gain) is the same for each opportunity parity statement.
- For each pairing of risk and opportunity parity statements, the amount of risk (pain) is balanced by the amount of opportunity (gain).
Risk tolerance and opportunity appetite statements that are elicited from the stakeholders can take various forms. For example, they may involve probabilities of failure or success in satisfying a particular objective, or they may involve changes in the achievable values of key performance parameters that affect a particular objective. To illustrate this point, consider the following hypothetical risk and opportunity parity statements.
The implication of parity suggests that these five statements involve equal pain or gain. For example, the stakeholders are willing to accept a doubling of the mission failure probability or a slippage of ΔY years in the mission achievement date in exchange for having the flexibility to use the same system to accomplish a different mission.
In summary, strategic decisions between disparate choices can be made if the baselines for risk and opportunity, as defined by the boundaries, are commensurate in terms pain and gain.
3.3.2 Response Boundaries and Watch Boundaries
To provide greater flexibility to the stakeholders, two separate risk tolerance and opportunity appetite boundaries (i.e., two levels of pain and gain) are elicited to differentiate risks and opportunities that need to be responded to from those that need only to be watched. The two boundaries are illustrated in Figure 3.6, where they are referred to as response boundaries and watch boundaries:
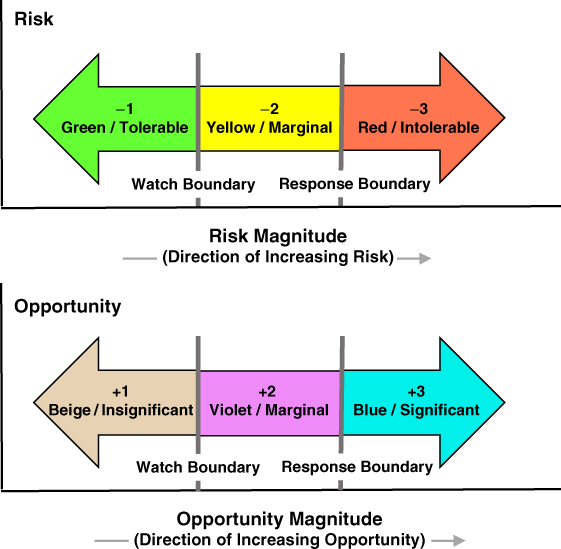
Figure 3.6 Risk and opportunity response and watch boundaries
- Exceedance of a response boundary suggests that an action is imminently needed (e.g., mitigation of the risk or exploitation of the opportunity). A risk that exceeds the risk response boundary is intolerable and an opportunity that exceeds the opportunity response boundary is significant.
- Exceedance of a watch boundary without exceeding a response boundary suggests that an action should be considered but is not imminently needed. Risks and opportunities that exceed the watch boundary but do not exceed the response boundary are referred to as marginal.4 While marginal risks/opportunities fall below the threshold of needing a response, they should be trended and reported at formal reviews.
- A risk that does not exceed the risk watch boundary is tolerable and an opportunity that does not exceed the opportunity watch boundary is insignificant.
3.4 Identifying Risk and Opportunity Scenarios and Leading Indicators
Once the stakeholders' risk and opportunity posture has been established by eliciting risk tolerance and opportunity appetite boundaries, the EROM analysis team proceeds to develop a set of risk and opportunity scenarios and associated leading indicators for each entity in the objectives hierarchy. Note that some risks and opportunities and their associated leading indicators may appear under more than one objective.
At lower levels of the objectives hierarchy, risk and opportunity scenarios and leading indicators tend to be specified by direct assignment using historical experience, expert judgment, and what-if analysis. At higher levels, scenarios and indicators that are identified by the EROM analysis team may also be augmented by additional scenarios and indicators that are obtained by roll-up from lower levels. This process recognizes the fact that the success of strategic goals and objectives may be affected not only by scenarios and leading indicators that enter at that level, but also by scenarios and leading indicators that enter at the levels of mid-term and short-term objectives and propagate upward.
An example of an opportunity scenario that is specified directly at a higher level and a risk scenario that is rolled up from lower levels is provided in the following box.
3.4.1 Risk and Opportunity Taxonomies
A taxonomy is a tree structure of classifications that begins with a single, all-encompassing classification at the root of the tree, and partitions this classification into a number of subclassifications at the nodes below the root. This process is repeated iteratively at each node, proceeding from the general to the specific until a desired level of category specificity is reached.
Taxonomies can be used to group enterprise risk and opportunity scenarios into categories that reflect, first, the types of goals and objectives that they affect, and second, the types of events that could create risk and opportunity for each goal or objective. Risk and opportunity taxonomies provide the following benefits:
- They assist in the identification of risk and opportunity scenarios that otherwise might be missed (e.g., by facilitating the brainstorming process), and in the identification and understanding of the cross-cutting nature of some of these scenarios.
- They help identify leading indicators that can be used to rank the likelihood (at least qualitatively) that a postulated event that either threatens or benefits a goal or objective will occur.
- They facilitate the process of identifying planning alternatives and internal controls to effectively mitigate the risks or exploit the opportunities.
- They assist in properly allocating resources among the entities or organizational units of the TRIO enterprise (e.g., to mitigate a risk or exploit an opportunity).
Figure 3.7 illustrates an example three-level enterprise risk and opportunity taxonomy that is applicable to TRIO enterprises. For each categorical unit in the bottom level of the taxonomy, it also provides an example individual risk (R) or opportunity (O) scenario summary description. In addition to categories that derive from the TRIO enterprise's mission and manner of conducting business, TRIO enterprises are responsible for meeting outcomes and milestones that are directly mandated by other entities (e.g., through Congressional amendments signed into law by the president).

Figure 3.7 Example taxonomy for enterprise risks and opportunities
As noted in Figure 3.7, each bottom-level subcategory can be further decomposed into one or more goals or objectives that apply to that categorical unit. For example, new technology pursuits pertaining to mission performance is comprised of different individual technology pursuits, each of which represents a goal or objective of the enterprise. Thus, the taxonomy in Figure 3.7 may be construed as having an unseen bottom-level corresponding to the goals and objectives that are affected.
3.4.2 Risk and Opportunity Scenario Statements
According to NASA (2011), risk scenario statements should contain three to four elements, as follows:
- A condition or set of conditions encapsulating the current key fact-based situation or environment that is causing concern, doubt, anxiety, or uneasiness.
- A departure event or set of departure events describing a possible change from the baseline plan.
- (Optional) An organizational entity or set of entities representing the primary resources that are affected by the risk scenario. (Note: The resources most affected by the risk scenario may be at the enterprise level or at a lower level in the organization.)
- A consequence or set of consequences describing the foreseeable, credible negative impacts on the organization's ability to meet its expected performance.
To facilitate strategic planning, it is useful to add the following element to the four cited above:
- The objective(s) in the organizational objectives hierarchy affected by the risk scenario.
The examples in the following box provide enterprise risk scenarios that conform with this format.
Opportunity scenario statements should contain analogous information:
- A condition or set of conditions encapsulating the current key fact-based situation or environment that is promoting the possibility of an opportunity
- An enabling event or potential advance, or a set of enabling events or potential advances, that could happen to promote the possibility to a reality
- (Optional) An organizational entity or set of entities representing the primary resources that are affected by the opportunity scenario
- An action that must be taken to realize the opportunity
- A benefit or set of benefits describing the foreseeable, credible possible impacts on the organization's ability to perform its mission
- The objective(s) in the organizational objectives hierarchy affected by the opportunity scenario
As discussed in Section 1.2.1, the inclusion of an action, which is not needed for the definition of a risk scenario, is intrinsic to the definition of an opportunity scenario. Example opportunity scenario statements following this format are presented in the following box.
3.4.3 Risk and Opportunity Scenario Narratives
While the risk or opportunity scenario statement provides a concise description of the individual risk or opportunity, this information is not necessarily sufficient to capture all the information that the identifying person has to convey, nor is it necessarily sufficient to describe the concern in enough detail that risk and opportunity management personnel can understand it and respond effectively to it, particularly after the passage of time. In order for enough context to be recorded so that the individual risk or opportunity can stand on its own and be understood by someone not otherwise familiar with the issue, a narrative description field should be provided. The narrative description should include the following (NASA 2011):
- Key circumstances surrounding the risk or opportunity scenario
- Contributing factors
- Uncertainties
- The range of possible consequences
- Related issues such as what, where, when, how, and why
The narrative description is also a place where the identifying person can suggest or recommend potential risk and opportunity responses that he/she feels are most appropriate. It is usually the case that the identifier is a person with significant subject matter expertise in the affected asset, and it is important to capture that expertise, not only concerning the nature of the issue but also its remedy. When a risk or opportunity response is recommended, the identifier should also record the rationale for the recommendation, preferably including an assessment of the expected risk shifting (e.g., from a safety risk to a cost risk) that would result.
3.4.4 Risk and Opportunity Leading Indicators
Risk and opportunity leading indicators are used to infer the likelihood that each objective in the organizational objectives hierarchy will be successfully achieved within the assigned time frame. During the organizational planning process, they are used to help decide from among various candidate objectives on the basis of their projected likelihood of success. During the performance evaluation process, they are used to assess how the likelihoods of success based on current conditions stand with respect to the initial projections.
As stated in the COSO document on key risk indicators (COSO 2010), most organizations monitor numerous key performance indicators (KPIs) that shed insights about risk events that have already affected the organization. Leading indicators, on the other hand, “help to better monitor potential future shifts in risk conditions or new emerging risks” so that management is “able to more proactively identify potential impacts on the organization's portfolio of risks.”
It should be noted, however, that indicators of past performance (i.e., lagging indicators) can also be indicators of possible future performance. For example, the occurrence of missed milestones in the past may indicate a potential for missed milestones in the future. Therefore, the set of leading indicators normally includes past performance as well as present conditions that are not related to past performance.
Risk and opportunity leading indicators should possess the following characteristics:
- Quantifiability: There should be one or more quantifiable measures by which to assess the status of the leading indicator.
- Correlatability: There should be a direct correlation between the value of a leading indicator and the likelihood of success of one or more of the objectives in the organizational objective hierarchy.
- Actionability: In the event that the value of a leading indicator leads to concern about a risk or optimism about an opportunity, there should be means for reducing the risk or exploiting the opportunity. It is not necessary for all leading indicators to be actionable (as some are caused by external forces that are beyond the control of the organization). Rather, it is only necessary that for each nontrivial risk or opportunity, there are some leading indicators that can be controlled to help contain the risk or grow the opportunity.
Risk and opportunity leading indicators may have different levels of complexity. For example, a simple indicator might be a ratio that management tracks to infer the status of an evolving risk or opportunity. A more elaborate indicator might involve the aggregation of several individual indicators into a multidimensional score about emerging events that may lead to new risks or opportunities. In addition, leading indicators might emerge from internal sources (such as missed project milestones) or from external sources (such as the state of the national economy).
Leading indicators may also be grouped according to the type of risk or opportunity to which they relate. Table 3.1 provides examples showing how various leading indicators may be grouped into categories of risk and opportunity.
Table 3.1 Typical Risk and Opportunity Scenario Types and Associated Leading Indicators
| Category | Example Risks | Example Opportunities | Example Internal (INT) and External (EXT) Leading Indicators |
| New technology development and application | Degradation of mission performance or of institutional capability or cost increases due to unknowns | Enhancement of mission performance or of institutional capability or cost reductions because of technology improvements | INT: Initiation of and results from internal state-of-the-art assessments |
| INT: Technology Readiness Level (TRL) rate of progress | |||
| INT: Number of patents applied for | |||
| EXT: Technology trends in areas pertinent to the organization's missions | |||
| Mandated performance goals | Failure to meet mandated or targeted milestone dates | Exceedance of expectations in meeting mandated or targeted milestone dates | INT: Schedule compared to other programs/projects* |
| INT: Number of missed intermediate milestones & slippage amount* | |||
| INT: Unresolved action items & uncorrected problems* | |||
| EXT: Changes in prioritization of agency outcomes | |||
| Financial | Funding cut | Funding increase | EXT: Economic indicators |
| EXT: Congressional makeup | |||
| EXT: Changes in national priorities | |||
| Insufficient contingency | More-than-sufficient contingency | INT: Contingency relative to other programs/projects* | |
| INT: Rate of spending compared to other programs/projects* | |||
| INT: Unresolved assignment of roles and responsibilities | |||
| Increased cost of materials/purchased services | Decreased cost of materials/purchased services | EXT: Price trends | |
| EXT: Threats of foreign conflicts or political changes (e.g., affecting rare material costs) | |||
| EXT: Supplier financial problems | |||
| Increased cost of operations | Decreased cost of operations | INT: Monthly cost reports* | |
| INT: Low scores on self-assessments and audits* | |||
| Milestone slippage costs | Savings due to milestone acceleration | INT: Earned value reports* | |
| EXT: Government shutdown | |||
| Accident costs | INT: Precursors, anomalies, mishap reports* | ||
| Availability of assets/loss of assets | Loss of key personnel | Gain of key personnel | INT: Age of workforce |
| INT: Workplace morale (e.g., from surveys) | |||
| EXT: Changes in competitive labor market | |||
| EXT: Demographic changes | |||
| Loss or unavailability of facilities or equipment | Increased availability of facilities or equipment | INT: Number of unplanned maintenance actions* | |
| INT: Age of equipment | |||
| EXT: Terrorism trends | |||
| EXT: Changes in OSHA regulations | |||
| Loss or unavailability of suppliers | Increased availability of suppliers | EXT: Market factors (demand versus supply) | |
| EXT: Supplier financial or legal problems | |||
| Loss or unavailability of IT capability | Increased availability of IT assets | INT: Number of unaddressed vulnerabilities | |
| EXT: Hacking trends | |||
| EXT: New viruses | |||
| Legal and reputational | Failure to meet federal or local requirements | Exceedance of federal or local requirements | INT: Quality of ethics program |
| INT: Quality of recordkeeping (e.g., for OSHA requirements)* | |||
| EXT: New regulations | |||
| Increase in financial liability given an accident | Decrease in financial liability given an accident | INT: Increased use of hazardous or toxic materials* | |
| INT: Accident precursors* | |||
| EXT: Trends in court decisions regarding liability | |||
| Reputational damage due to mgmt. failures | Reputational enhancement due to mgmt. successes | INT: Findings of independent reviews | |
| INT: Seeking and resolution of internal dissenting opinions* | |||
| Degradation of scientific reputation | Enhancement or maintenance of scientific reputation | INT: Number of technical papers published | |
| INT: Number of patents granted | |||
| EXT: Number of citations in technical papers | |||
| EXT: Number of nominations or awards received | |||
| Education and partnerships | Failure to meet public educ. goals | Exceedance of public educ. goals | INT: Missed or made milestones |
| INT: Low or high enrollment in educational programs | |||
| Failure to meet technology transfer goals | Exceedance of technology transfer goals | INT: Missed or made milestones | |
| INT: Number of technology transfer agreements | |||
| EXT: Lack or surplus of interest or progress from potential commercial partners | |||
| EXT: Trends regarding the sharing of sensitive information and materials | |||
| Failure to meet international partnership goals | Exceedance of international partnership goals | INT: Missed or made milestones that the organization is responsible for* | |
| EXT: Lack or surplus of interest or progress from potential international partners | |||
| EXT: New regulations regarding sensitive information | |||
| EXT: Competition from a foreign country |
*Asterisked leading indicators are measured at program/project level or center level and are aggregated to obtain leading indicators that apply to the agency as a whole.
3.4.5 Leading Indicators of Unknown and Underappreciated (UU) Risks
As mentioned in Section 1.2.7, the factors that contribute to UU risks can be considered to be leading indicators, and they, too, should be included in the roll-up of risks and opportunities from lower to higher levels in the objectives hierarchy. The following design, organizational, and programmatic factors are among the principal leading indicators of UU risks (NASA 2015; Benjamin et al. 2015):
- Amount of complexity, particularly involving the interfaces between different elements of the system. Technical systems more prone to UU failure are complex, tightly coupled systems that make the chain of events leading to a disaster incomprehensible to operators.
- Amount of scaling beyond the domain of knowledge. UU risks may occur either from incrementally scaling up a design to achieve higher performance or incrementally scaling down a design to save on cost or time, without providing adequate validation.
- Use of fundamentally new technology or fundamentally new application of an existing technology. The use of new technology in place of heritage technology may lead to an increase in UU risks when other factors within this list are not well handled.
- Degree to which organizational priorities are focused toward safety and reliability. UU risks occur more frequently when top management is not committed to safety as an organizational goal, when there is no or little margin in the availability of qualified personnel, and when organizational learning is not sufficiently valued.
- Degree to which the management style is hierarchical. Two-way flows of information are essential in technological systems to maximize the sharing of information among all personnel regardless of position in the organizational hierarchy.
- Degree of oversight when responsibilities are distributed among various entities. Interfaces between different elements of the system provided by different suppliers require stringent oversight by the managing agency.
- Amount of pressure to meet schedule and budget constraints. In particular, time pressure beyond the level of comfort is a fundamental reason for high human error rates.
- Likelihood of major or game-changing external events that affect the TRIO enterprise's direction, such as changes in the federal administration or geopolitical upheavals. Such events impact the stability of long-term strategic planning and of external imposed constraints and requirements.
NASA (2015) and Benjamin et al. (2015) provide useful guidelines for determining how various combinations of the above leading indicators tend to affect the relative magnitude of UU risks compared to the magnitude of known risks. Table 3.2 is reproduced (with minor modifications to simplify the presentation of data), and provides a summary of guidelines for estimating the ratio of the system failure probability from UU risks to the system failure probability from known risks when a system is initially put into operation (Benjamin et al. 2015). These estimates are intended only to be representative and not in any way precise, because additional factors not included in the general list may be important for specific applications. In the context of EROM, Table 3.2 provides indications of various combinations of the leading indicators of UU risks that need to be watched and possibly responded to.
Table 3.2 Published Guidelines for Roughly Estimating the Ratio of the System Failure Probability from UU Risks to the System Failure Probability from Known Risks at Time of Initial Operation (Benjamin et al. 2015)
| Ratio | Applicable Conditions | Sources |
| 0 | Systems that can take credit for at least 125 actual cycles of operation of the same or equivalent systems with positive indication that the risk has leveled off to a mature system value | Results for Shuttle, Atlas, Delta, Molniya/Soyuz after125 flights |
| ∼1 | New systems that are developed and operated under at most mild time pressure, with reliability and safety having a higher priority than cost and schedule, with an inclusive management structure, and with a design philosophy that does not involve significantly new technology or new integration of an existing technology or scaling of an existing technology beyond the domain of knowledge or tight functional coupling | Results for Delta, first 75 flights |
| ∼2 | New systems that are developed or operated under at least moderate time pressure, with cost and schedule having at least an equal priority with reliability and safety, and with a tendency for the management structure to be hierarchical, but with a design philosophy that does involve significantly new technology or new integration of an existing technology or scaling of an existing technology beyond the domain of knowledge or tight functional coupling | Results for Atlas, first 75 flights* |
| ∼2 | New systems that are developed or operated under significant time pressure, and with a design philosophy that involves either new technology or new integration of an existing technology or scaling of an existing technology beyond the domain of knowledge or tight coupling, but with reliability and safety having a higher priority than cost and schedule, and with an inclusive management structure | Results for Shuttle retrospectively, first 75 flights, if post-Columbia return-to-flight improvements had been in place* |
| ∼4 | New systems that are developed or operated under significant time pressure, with cost and/or schedule having at least an equal priority with reliability and safety, with a tendency for the management structure to be hierarchical, and with a design philosophy that involves either new technology or new integration of an existing technology or scaling of an existing technology beyond the domain of knowledge or tight coupling | Results for Shuttle, first 75 flights. Anecdotally nuclear reactor experience and human reliability experience* |
| Up to 9 | New systems that are developed or operated under extreme time pressure, with cost and/or schedule having significantly higher priority than reliability and safety, with a highly hierarchical management structure, and involving either new technology or new integration of an existing technology or scaling of an existing technology well beyond the domain of knowledge | Results for Molniya/Soyuz first 75 flights. Factors of this magnitude and larger are also suggested in Guarro (2014). |
* Ratios of 1 to 4 are also consistent with historical reliability growth estimates cited in Table I of MIL-HDBK-189A for commercial and military systems.
3.5 Specifying Leading Indicator Trigger Values and Evaluating Cumulative Risks and Opportunities
Leading indicator trigger values are used to signal when a risk is reaching a risk-tolerance boundary or when an opportunity is reaching an opportunity appetite boundary. Reaching the trigger values for risk leading indicators implies that the likelihood of not being able to satisfy an objective in the organizational objectives hierarchy is becoming a concern. Reaching the trigger values for opportunity leading indicators implies either that there is a potential for significantly increasing the likelihood of being able to satisfy an objective or that there is an emerging opportunity to achieve new goals and objectives that were formerly considered unreachable or inconceivable.
Leading indicator trigger values are specified for each risk and opportunity scenario for each objective in the organizational objectives hierarchy. Once specified, it is possible to compare the actual values of the leading indicators to their trigger values to provide a measure of the overall risk and opportunity for each objective in the hierarchy.
3.5.1 Leading Indicator Trigger Values
Similar to the way that risk tolerance and opportunity appetite were characterized by two boundaries, a response boundary and a watch boundary, it is useful to define two triggers for risk and opportunity leading indicators, a response trigger and a watch trigger. The EROM analysis team elicits values of the leading indicator triggers from appropriate technical authorities and subject matter experts.
Leading indicator triggers may be positively or negatively correlated with risk or opportunity. For example, remaining cost reserve is defined in the opposite direction from expenditure to date. As cost expenditure increases, the risk of overrun increases (a positive correlation), but as remaining cost reserve increases, the risk of overrun decreases (a negative correlation). This opposite duality is captured by the mirror-image effects of positive and negative correlations shown in Figure 3.8.

Figure 3.8 Risk and opportunity leading indicator triggers
Leading indicator triggers are intended to be quantitative surrogates for the often qualitative risk tolerance and opportunity appetite boundaries. Their accuracy as surrogates depends upon the skill of the technical authorities, subject matter experts, and EROM analysis team in defining leading indicators and specifying their trigger values.
3.5.2 Cumulative Risks and Opportunities
The cumulative risk and cumulative opportunity for each objective in the organizational objectives hierarchy is derived from the current status of the associated leading indicators relative to their trigger values, where current status refers to both the current value and the current trend. The term cumulative in this context refers to the accumulation of the various leading indicators that apply to the objective being evaluated.
Figure 3.5, presented earlier, conceptually illustrates the general process for determining the cumulative risks and opportunities for a set of objectives in an organizational objectives hierarchy.5
3.6 Identifying and Evaluating Risk Mitigation, Opportunity Exploitation, and Internal Control Options
If a cumulative risk is intolerable and/or a cumulative opportunity is significant, it may become desirable to consider means for mitigating the risk and/or exploiting the opportunity, along with the associated setting of internal controls. This section discusses processes for identifying and evaluating such options.
3.6.1 Deducing Risk and Opportunity Drivers
Risk drivers are defined as “those elements found within the aggregate performance risk models that contribute most to the performance risks because of uncertainties in their characterization When varied over their range of uncertainty, [they] cause the performance risk to change from tolerable to intolerable (or marginal)” (NASA 2011).
In the context of EROM, a risk driver can be thought of as a significant source of risk contributing to the overall cumulative risk of not satisfying a top organizational objective. A risk driver can be a departure event in a risk scenario statement, an underlying cause of a departure event, a leading indicator, a particular assumption used in evaluating the significance of an individual risk, an assumption made in evaluating a cumulative risk, an essential internal control, or any combination of such elements that cause the cumulative risk to change from tolerable (green) to marginal (yellow) or intolerable (red) or from marginal (yellow) to intolerable (red). For example, the following elements in the analysis of risk are potential risk drivers:
- Congress may cut funding for a large, key program next year (a departure event).
- Human error may cause a catastrophic accident to occur during a mission (an underlying cause of the departure event catastrophic accident).
- The schedule reserve for a key task in a key program is uncomfortably low and trending lower (a leading indicator of the risk of not completing the key task on time).
- If needed, personnel can be diverted from Task A to Task B (an assumption used to evaluate the significance of the risk of not completing Task B on time).
- All pertinent information needed to evaluate the organization's strategic performance is being transmitted in an unbiased fashion to the technical authorities (an assumption used to justify assurance that the organization is meeting its strategic objectives).
- There is a process and document trail to ensure that all significant risks and opportunities are elevated to responsible individuals with management authority to act upon them (an internal control).
If no one element individually is sufficient to change the color of the cumulative risk, a combination of them may constitute a risk driver.
Risk drivers focus risk management attention on those potentially controllable situations that present the greatest opportunity for risk reduction. Often, risk drivers affect more than one individual risk and cut across more than one organizational unit.
Similarly, opportunity drivers are generally departure events in an opportunity scenario statement or leading indicators of opportunity. For example, the following elements in the analysis of opportunity are potential opportunity drivers:
- Congress may increase funding for a large, key program next year (a departure event).
- The schedule reserve for a key task in a key program is higher than expected and trending higher (a leading indicator of an opportunity to reduce program cost by reallocating personnel so as to finish the program ahead of schedule).
Risk and opportunity drivers can be identified by applying the risk and opportunity roll-up process (illustrated schematically in Figure 3.5) to determine whether the color of the cumulative risks and opportunities for the top organizational objectives change as various sources of risk and opportunity are eliminated. For example, Figure 3.9, when compared with Figure 3.5, shows schematically how the removal of Risk Driver 1 propagates up through the objectives hierarchy to change the ranking of the cumulative risk for the top objective from marginal to tolerable, and how the removal of Opportunity Driver 1 changes the ranking of the cumulative opportunity for the top objective from significant to marginal.
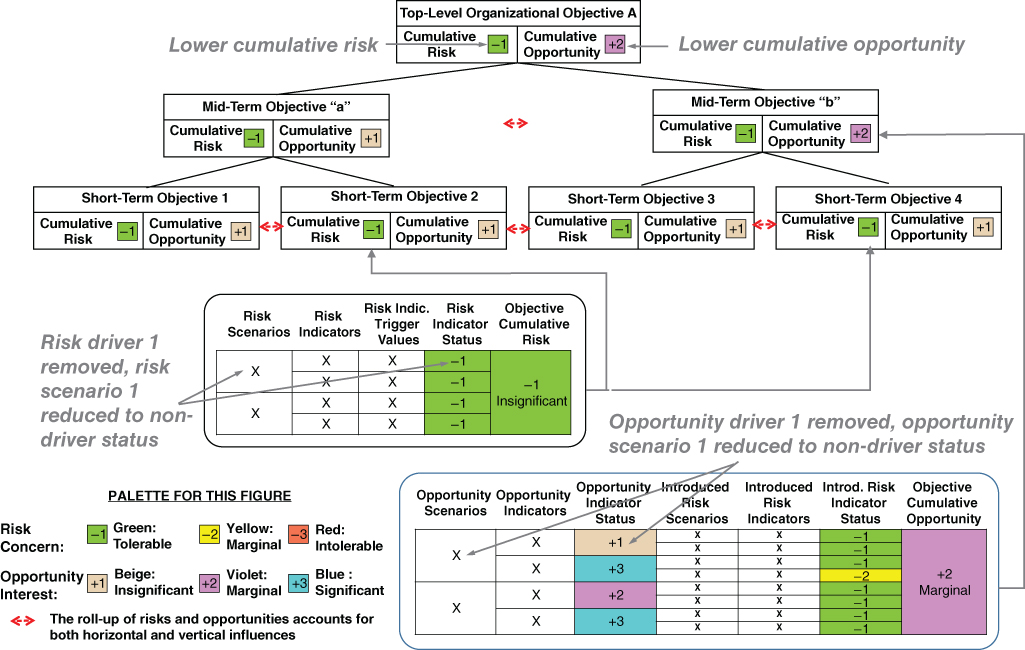
Figure 3.9 Hypothetical results showing how the elimination of a risk driver affects cumulative risk and the elimination of an opportunity driver affects cumulative opportunity
3.6.2 Deducing Risk and Opportunity Scenario Drivers
TRIO organizations are typically required to identify their top risk scenarios, report on the likelihood of their occurrence and severity of their impact, and explain how they are being responded to. OMB Circulars A-11 and A-123 lay out requirements to this effect for government agencies, as described in Section 2.5.
Risk and opportunity scenario drivers are a higher-order representation of risk and opportunity drivers. The elements that constitute risk and opportunity drivers (i.e., key departure events, underlying causes, assumptions, existing controls, etc.) are embedded within risk and opportunity scenarios, either as part of the conditions, departure events, and consequences that comprise a risk or opportunity scenario statement or as part of the narrative that accompanies one. Therefore, just as a risk or opportunity driver is defined in Section 3.6.1 as an element or set of elements that cause the cumulative risk or opportunity for a top objective to change color, a risk or opportunity scenario driver can be defined as a scenario or set of scenarios that lead to the same result.
Also, just as risk or opportunity drivers can be identified by applying the risk or opportunity roll-up process while selectively eliminating one or more sources of risk or opportunity until the color of a top objective changes, risk or opportunity scenario drivers can be identified in the same way by selectively eliminating one or more risk or opportunity scenarios. Figure 3.9 provides an indication of how risk and opportunity drivers interact with risk and opportunity scenario drivers.
3.6.3 Evaluating Risk and Opportunity Scenario Likelihoods and Impacts
As discussed in Sections 2.5.3 and 2.5.4 and illustrated in Table 2.3, OMB Circular A-123 stipulates that risk profiles prepared by an agency of the government should include an assessment of both the likelihood and the impact of each risk scenario.
The guidance in the OMB circular for assessment of likelihood as high, medium, or low is based on whether the risk scenario is reasonably expected to occur, more likely to occur than not, or more unlikely to occur or not. For many risks, such as those associated with fraud, malpractice leading to inefficiency, or slippages in cost or schedule that are not mission critical, it makes sense to define likelihood in these terms. But for pioneering TRIO enterprises whose risks (and opportunities) are more mission-critical and possibly even life-critical, a more stringent definition of likelihood is needed. It is more useful to define likelihood for such enterprises in terms of risk tolerance and opportunity appetite. The likelihood of a risk or opportunity should be objective-dependent, and should be considered to be high if it is comparable to or greater than the decision maker's risk tolerance for that objective. For example, if a decision maker is willing to tolerate a likelihood of 10−2 (1 in 100) for loss of a critical mission, the likelihood of a risk scenario that could lead to failure to execute that critical mission would be considered high if it is comparable to or greater than 10−2. Conversely, it would be considered low if it is significantly less than 10−2.
Risk tolerance and opportunity appetite are measurable in terms of the decision maker's watch and response boundaries. As stated in Section 3.3.2, exceedance of a response boundary (such as 10−2 for the failure likelihood of critical mission) suggests that an action is imminently needed, whereas exceedance of a watch boundary (say, 10−3 for the failure likelihood) without exceeding the response boundary suggests that an action should be considered but is not imminently needed. Watch boundaries specify the boundary between “tolerable” and “marginal” for risks, and between “insignificant” and “marginal” for opportunities.
Table 3.3 provides an example of how risk and opportunity scenario likelihoods could be defined for the critical objectives that are undertaken by a pioneering TRIO enterprise. In this example, the scale is divided into three ranks, as suggested in Table 3.3. If greater resolution is needed, the number of ranks may be expanded from three to five by adding “very high” and “very low” to the other ranks in the table and defining associated criteria in terms of distance above or below the watch and response boundaries.
Table 3.3 Example Likelihood Scale for a Risk or Opportunity Relative to a Critical Organizational Objective
| Rank | Criteria |
| High | Likelihood of occurrence of departure event(s) exceeds the decision maker's risk/opportunity response boundary |
| Medium | Likelihood of occurrence of departure event(s) is between the decision maker's risk/opportunity watch and response boundaries |
| Low | Likelihood of occurrence of departure event(s) is lower than the decision maker's risk/opportunity watch boundary |
In addition to likelihoods, the guidance in the OMB circular for assessment of impact as high, medium, or low is based on the degree of impairment of the entity's ability to achieve one or more of its objectives should the risk scenario occur. It is clear from the OMB guidance (and from the general principles in this book) that the determination of the “impact” of a risk or opportunity scenario for a TRIO enterprise cannot be made without considering the effect of the risk or opportunity scenario on the cumulative risk or opportunity of the objective. The cumulative effect on the objective is determined during the risk and opportunity roll-up processes and is reflected in the determination of risk and opportunity drivers, as discussed in Section 3.6.1, and scenario drivers, as discussed in Section 3.6.2.
It is easiest and perhaps most reasonable to assess impact on a scenario-by-scenario basis by determining whether the scenario appears in a scenario driver for any top-level objective and examining the color of the cumulative risk/opportunity for that objective. If any risk scenario drivers for a given objective contain a particular individual risk scenario and the cumulative risk is red (intolerable), the risk scenario may be considered to have high impact. If the cumulative risk is yellow (marginal), the risk scenario may be considered to have medium impact. Similarly, if any opportunity scenario drivers for a given objective contain a particular individual opportunity scenario and the cumulative opportunity is blue (significant), the opportunity scenario may be considered to have high impact, and if the cumulative opportunity is violet (marginal), it may be considered to have medium impact.
Table 3.4 provides a demonstration of this process for determining risk and opportunity scenario impacts. Again, if greater resolution is needed, the number of ranks may be expanded from three to five by adding “very high” and “very low” to the other ranks in the table and defining their criteria in an analogous manner.
Table 3.4 Example Impact Scale for a Risk or Opportunity Relative to a Critical Organizational Objective
| Rank | Criteria |
| High | Scenario appears in a scenario driver and the cumulative risk/opportunity for the objective is red/blue (intolerable/significant) |
| Medium | Scenario appears in a scenario driver and the cumulative risk/opportunity for the objective is yellow/violet (marginal) |
| Low | Scenario does not appear in a scenario driver |
3.6.4 Identifying Options for Risk Response, Opportunity Action, and Internal Control
When there is a need to reduce the cumulative risk or a desire to take advantage of the cumulative opportunity for one or more top objectives, there are several types of options to be considered:
- Responses to mitigate the cumulative risk
- Actions to seize the cumulative opportunity
- Institution of internal controls to provide effective management oversight and protect operative assumptions
The formulation of risk responses and opportunity actions can take many forms, including changes in the design of a system that is in development, retrofits to existing systems, changes in manufacturing processes, changes in operating procedures, changes in management, formation of partnerships, proactive actions to inform and influence governing agencies, improved public relations, and cost sharing arrangements, to name a few. What these various formulations have in common is that they are based on certain assumptions, and their effectiveness depends on the accuracy of those assumptions. For example, design changes to a system are based on assumptions about the environments that the system will be exposed to, and whether those environments will stay within the parameters that are called out in the design specifications. One of the main function of internal controls, therefore, pertains to the protection of the accuracy of the assumptions.
Leveson (2015) emphasizes the use of internal controls to protect operative assumptions within the domain of safety performance. The types of assumptions of interest to Leveson include the following:
- Assumptions about the system hazards and the paths to (causes of) hazards
- Assumptions about the effectiveness of the controls, that is, the shaping and hedging actions, used to reduce or manage hazards
- Assumptions about how the system will be operated and the environment (context) in which it will operate, for example, assumptions that the controls will be operating as assumed by the designers
- Assumptions about the development environment and processes
- Assumptions about the organizational and societal control structure during operations (i.e., that it is working as designed), the design was adequate to ensure the system requirements are enforced, and the system controllers are fulfilling their responsibilities and operating as designed
- Assumptions about vulnerability or severity in risk assessment that may change over time and thus require a redesign of the risk management and leading indicators system itself
These types of assumptions, with minor modification, apply not only to the safety domain considered by Leveson but as well to virtually all other risk domains (technical, cost, schedule, institutional, acquisition, financial viability, liability, etc.) at all levels of the organization (enterprise, program directorate, technical directorate, etc.). In the context of an enterprise, internal controls should ensure:
- Either that such assumptions remain valid over time in all risk and opportunity domains for all organizational levels
- Or, if the conditions should change, that the operative assumptions are changed accordingly and the new assumptions are monitored and controlled.
The identification of risk mitigation responses, opportunity exploitation actions, and internal controls is directed at finding viable ways to act upon the risk and opportunity drivers and/or scenario drivers discussed in the preceding subsection. The purpose is to reduce risks or act on opportunities when the cumulative risks and opportunities demand that such influence be exercised. There is, however, an obvious limitation on the ability of an agency or business to influence risk and opportunity drivers, in that not all drivers are actionable. When a driver is not actionable, the fallback is to identify other risk and opportunity drivers that are actionable and that can exert an influence on the cumulative risk or opportunity. For example, it is not within the province of a government agency to influence whom the voters choose to elect to federal office, but it is within their province to track public sentiment and plan for alternative scenarios.6
3.6.5 Evaluating Options for Risk Response, Opportunity Action, and Internal Control
Options for risk response, opportunity action, and internal control can be evaluated by assessing how the cumulative risks and opportunities for the top organizational objectives would change as a result of incorporating the responses, actions, and controls into the organizational structure and its operation. The process for performing this assessment includes the need to consider not only the positive effects that such options might have on some parts of a system or operation but also the possible unintended negative effects on other parts of the system or operation.
The process for performing this evaluation follows the framework that was developed in Sections 3.4 and 3.5. Risk and opportunity scenarios are redeveloped, taking into account the proposed response, action, and internal control option. In the case of opportunity actions, new risk scenarios introduced by the proposed actions and associated internal controls are included in the accounting. The existing leading indicators are modified and new ones added to reflect the content of the redeveloped risk and opportunity scenarios. Leading indicator trigger values are specified consistent with the modified leading indicators. Finally, the cumulative risks and opportunities are reevaluated based on a roll-up of the new risk and opportunity information.
Figure 3.10 presents a flowchart depicting the development of a risk response, opportunity action, and internal control plan as an iterative process. The plan is initially proposed if the evaluation of the cumulative risks and opportunities of the various objectives indicates that one or more risks is intolerable or marginal and/or one or more opportunities is significant or marginal. The iteration of the plan continues until there is an optimal or near-optimal balance between the cumulative risks, the cumulative opportunities, and the cost of implementing the plan. Optimality is considered to be reached when the following conditions all apply:
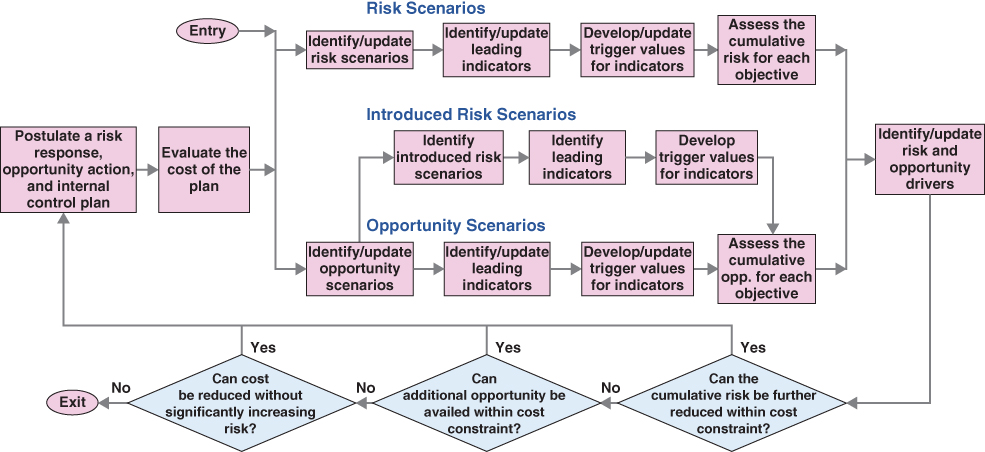
Figure 3.10 Iterative process for identifying and evaluating a risk response, opportunity action, and internal control plan that balances cumulative risk, cumulative opportunity, and cost
- The cumulative risks and opportunities for the top objectives are in balance (a condition that evolves from using the risk and opportunity drivers to guide the development of the plan at each iteration).
- The cumulative risks cannot be reduced further without violating cost constraints imposed on the organization.
- The cumulative opportunities cannot be availed further without violating the cost constraints.
- The cost of implementing the plan cannot be reduced further without negatively changing the status of one or more of the cumulative risks.
3.6.6 Brief Comparison of this Approach with the COSO Internal Control Framework and the GAO Green Book
The preceding two subsections have presented the position that internal controls should derive principally from the organization's strategic objectives and from considerations of the risk and opportunity drivers that affect the organization's ability to meet those objectives. The drivers are determined from the factors that most significantly affect aggregate risks and opportunities rather than just from individual risks and opportunities. The identification and evaluation of internal controls focus largely on protection of the assumptions that need to be maintained for the aggregate risks and opportunities to be effectively and efficiently controlled within the decision maker's risk tolerance and opportunity appetite.
This position differs philosophically somewhat from the approach taken in the COSO framework for internal controls (COSO 2013), which presents internal controls as being a part of ERM but ERM not necessarily being a part of internal controls. The following statements quoted from Appendix G of COSO (2013) explain the position advocated by COSO:
- “This Internal Control—Integrated Framework specifies three categories of objectives: operations, reporting, and compliance The Enterprise Risk Management—Integrated Framework adds a fourth category of objectives, strategic objectives, which operate at a higher level than the others…. Enterprise risk management is applied in setting strategies, as well as in working toward achievement of objectives in the other three categories.”
- “The Enterprise Risk Management Framework introduces the concepts of risk appetite and risk tolerance The concept of risk tolerance is included in the Framework as a pre-condition to internal control, but not as a part of internal control.”
- “A concept not contemplated in the Internal Control—Integrated Framework is a portfolio view of risk. Enterprise risk management requires that in addition to focusing on risk in considering the achievement of entity objectives on an individual basis, it is necessary to consider composite risks from a portfolio perspective. Internal control does not require that the entity develop such a view.”
- “The Internal Control—Integrated Framework focuses on identifying risks and does not include the concept of identifying opportunities as the decision to pursue opportunities is part of the broader strategy-setting process.”
- “While both frameworks call for assessment of risk, the Enterprise Risk Management—Integrated Framework suggests viewing risk assessment through a sharper lens. Risks are considered on an inherent and a residual basis, preferably addressed in the same unit of measure established for the objectives to which the risks relate. Time horizons should be consistent with an entity's strategies and objectives and, where possible, observable data. The Enterprise Risk Management—Integrated Framework also calls attention to interrelated risks, describing how a single event may create multiple risks.”
- “The Internal Control—Integrated Framework presents a more current view of technology and its impact on managing the entity.”
- “The Enterprise Risk Management—Integrated Framework takes a broader view of information and communication, highlighting data derived from past, present, and potential future events,…consistent with the entity's need to identify events and assess and respond to risks and remain within its risk appetite. The Internal Control— Integrated Framework focuses more narrowly on data quality and relevant information needed for internal control.”
The main point is that whereas the COSO ERM Framework considers all types of risk, including strategic risks, the COSO internal control framework looks only at day-to-day operational, reporting, and compliance risks. The COSO view of internal controls is aligned with its emphasis on enterprises whose principal objectives are financial. In the COSO framework, internal controls are viewed as an input to ERM but not as an output from it. In this book, EROM and internal controls are considered in a totally integrated fashion, so that strategic risks are intrinsically considered in the identification and evaluation of internal controls.
At the same time, the COSO formulation allows for entities to treat ERM and internal controls in a fully integrated manner at their discretion: “While it [ERM] is not intended to and does not replace the internal control framework, but rather incorporates the internal control framework within it, companies may decide to look to this enterprise risk management framework both to satisfy their internal control needs and to move toward a fuller risk management process” (COSO 2004).
The GAO Green Book (GAO 2014a), and by extension the updated version of OMB Circular A-123, takes an intermediate view of the integration of internal controls and ERM. The following statements quoted from the Green Book explain the position advanced by GAO:
- (OV2.10): “A direct relationship exists among an entity's objectives, the five components of internal control, and the organizational structure of an entity. Objectives are what an entity wants to achieve. The five components of internal control are what are required of the entity to achieve the objectives.”
- (OV2.16): “Management, with oversight by an oversight body, sets objectives to meet the entity's mission, strategic plan, and goals and requirements of applicable laws and regulations.”
- (OV2.18): “Management groups objectives into one or more of the three categories of objectives:
- Operations Objectives—Effectiveness and efficiency of operations
- Reporting Objectives—Reliability of reporting for internal and external use
- Compliance Objectives—Compliance with applicable laws and regulations”
- (OV2.19): “Operations objectives relate to program operations that achieve an entity's mission. An entity's mission may be defined in a strategic plan. Such plans set the goals and objectives for an entity along with the effective and efficient operations necessary to fulfill those objectives. Effective operations produce the intended results from operational processes, while efficient operations do so in a manner that minimizes the waste of resources.”
A significant difference between the Green Book and the COSO formulation is that the Green Book defines operational objectives to include strategic objectives, whereas the COSO formulation does not. Thus, ERM and internal controls are more fully integrated in the Green Book philosophy. However, the Green Book still tends to emphasize the control of day-to-day operations and issues such as fraud and financial transparency as the most critical objectives of internal controls.
OMB Circular-A-123 (OMB 2016b) takes the position that agencies formulating an internal controls framework that is integrated with ERM should initially, at a minimum, concentrate on the day-to-day operational, reporting, and compliance objectives defined by COSO (2013), but should within a reasonable amount of time, as part of their maturity model development, extend the framework to include the integration of internal controls with strategic objectives.
Notes
References
- Benjamin, A., Dezfuli, H., and Everett, C. 2015. “Developing Probabilistic Safety Performance Margins for Unknown and Underappreciated Risks.” Journal of Reliability Engineering and System Safety. Available online from ScienceDirect.
- Committee of Sponsoring Organizations of the Treadway Commission (COSO). 2004. Enterprise Risk Management—Integrated Framework: Application Techniques.
- Committee of Sponsoring Organizations of the Treadway Commission (COSO), 2010. Developing Key Risk Indicators to Strengthen Enterprise Risk Management. http://www.coso.org/documents/COSOKRIPaperFull-FINALforWebPostingDec110_000.pdf
- Committee of Sponsoring Organizations of the Treadway Commission (COSO). 2013. Internal Control—Integrated Framework (Framework and Appendices).
- Guarro, S. June 2014. “Quantitative Launch and Space Transport Vehicle Reliability and Safety Requirements: Useful or Problematic?” Proc. PSAM-12 Int. Conference on Probabilistic Safety Assessment and Management, Honolulu, HI.
- GAO-14-704G. 2014a. The Green Book, Standards for Internal Control in the Federal Government. Washington, DC: Government Accountability Accounting Office. (September).
- Leveson, N. April 2015. “A Systems Approach to Risk Management through Leading Safety Indicators.” Journal of Reliability Engineering and System Safety 136: 17–34.
- National Aeronautics and Space Administration (NASA). 2011. NASA/SP-2011-3422. NASA Risk Management Handbook. Washington, DC: National Aeronautics and Space Administration. http://www.hq.nasa.gov/office/codeq/doctree/NHBK_2011_3422.pdf
- National Aeronautics and Space Administration (NASA). 2015. NASA/SP-2014-612. NASA System Safety Handbook, Volume 2: System Safety Concepts, Guidelines, and Implementation Examples. Washington, DC: National Aeronautics and Space Administration. http://www.hq.nasa.gov/office/codeq/doctree/NASASP2014612.pdf
- Office of Management and Budget (OMB). 2016b. OMB Circular A-123. “Management's Responsibility for Enterprise Risk Management and Internal Control.” (July) https://www.whitehouse.gov/sites/default/files/omb/memoranda/2016/m-16-17.pdf