
Chapter 4
The Development and Utilization of EROM Templates for Performance Evaluation and Strategic Planning
4.1 Overview
As discussed earlier (e.g., Section 1.1.4), the literature on ERM/EROM contains a significant amount of guidance on the organizational aspects of the topic and the fundamental framework to be used. However, it provides very few details on how to conduct the analyses that are needed in order to reap the benefits. Chapter 4 attempts to fill that gap by describing and demonstrating how comprehensive EROM analyses can be conducted using templates. In Sections 4.1 through 4.8, the templates will be introduced by pursuing an example that examines EROM's role in evaluating organizational performance for its ongoing programs, projects, activities, and initiatives, and in identifying and evaluating actions and controls to reduce risk and/or seize opportunity. In Section 4.9, the example will be modified to show how the same templates with different inputs can be applied to examine EROM's role in organizational planning, where the organization is interested in examining its likelihood of success in meeting its top objectives for various candidate sets of programs, projects, and so forth that are in the conceptual stage.
The use of templates is a practical, efficient, and broad-based approach for implementing the framework for EROM that is discussed in Chapters 2 and 3. To illustrate how templates can be applied effectively, a real-world example relevant to NASA will be pursued. The example will treat EROM from various vantage points: first by considering EROM implementation from the perspective of each of the major management levels in the organization (i.e., the executive, programmatic, and institutional/technical levels), and then from the perspective of the enterprise as a whole (i.e., integrated across the major management units).
The templates developed for this demonstration pertain principally to TRIO enterprises that conduct risky technical or scientific ventures and whose interest is mainly in achieving technical gain and knowledge advancement rather than financial gain for its stakeholders.1 Following are the types of results that will be generated by the templates used in this demonstration:
High-Level Results (Suitable as a Synopsis for Management)
- A hierarchical list of objectives to be satisfied across the enterprise and the way that they interface with various levels of the organization (executive; programmatic; institutional/technical)
- A substantiated ranking (or rating) of the level of risk of not being able to achieve each objective
- A substantiated ranking of the level of opportunity available for improving the ability to achieve each objective
- A list of risk and opportunity drivers for each objective, leading to suggestions for responses such as mitigations and internal controls
Low-Level Results (Suitable for Explaining the Details behind the High-Level Results)
- Identification of the complex interfaces between each objective, and the rationale for how the likelihood of success for each objective affects the likelihood of success for other objectives
- A list of the significant individual risks and opportunity scenarios for each objective, and the rationale for why these scenarios are considered significant
- A list of the key risk and opportunity indicators and the rationale for how these indicators relate to the likelihood of success of each objective
- Specification of trigger values for each indicator, and the rationale for why these particular values signal the need for increased watchfulness or for a direct response
- A roll-up of the significant individual risks and opportunities from the bottom level of the objectives hierarchy (near-term objectives) to the top level (long-term or strategic objectives), along with the rationale for choices made during the roll-up
- Sensitivity results showing how the cumulative risk and opportunity for each objective are affected by various combinations of risk and opportunity scenarios and their constituent parts
- Risk and opportunity driver charts showing the time criticality for initiating response
- Assessment of the likelihoods and impacts of the risk and opportunity scenarios
4.2 Demonstration Example: The NASA Next-Generation Space Telescope as of 2014
The example application involves the development, deployment, and operation of the next-generation space telescope. The demonstration is closely patterned after the James Webb Space Telescope (JWST) project at NASA, but the overall intent of the demonstration is to focus the reader's attention on the structure and form of the templates and how they may be used to facilitate strategic planning and performance evaluation in a general sense. To lend authenticity and promote recognition of the kinds of risks and opportunities that have to be dealt with, data pertinent to both the JWST and the Hubble Space Telescope (HST) are used throughout the example. The data for the JWST project reflects its status as of the end of 2014.
Timely completion of the JWST development and launching of the telescope is an agency priority goal (APG): “By October 2018, NASA will launch the James Webb Space Telescope, the premier space-based observatory. To enable this launch date, NASA will complete the James Webb Space Telescope primary mirror backplane and backplane support structures and deliver them to the Goddard Space Flight Center for integration with the mirror segments by September 30, 2015” (NASA 2014c, p. 24). The principal source of information is Report GAO-15-100 on the JWST project issued by the US Government Accountability Office in December 2014 to Congressional committees (GAO 2014b). Among other things, the report addresses the degree to which technical challenges have impacted the JWST project's ability to stay on schedule and budget, and the extent to which budget and cost estimates reflect information about project risks. The following bits of information obtained from this and other sources are mentioned here not to criticize the project or its management but rather to provide a basis for analyzing risks and opportunities in this demonstration using published information:2
Information Pertinent to JWST Schedule and Cost
- JWST is one of the most complex projects in NASA's history (GAO 2014b).
- In addition to the design, the scale of JWST's integration and test effort is more complex than most NASA projects (GAO 2014b).
- The cryocooler subsystem is particularly complex and challenging because of the relatively great distance between the cooling components and the need to overcome multiple sources of unwanted heat (GAO 2014b).
- The cryocooler subcontractor has experienced prior schedule delays and continued performance challenges (Leone 2014).
- The cryocooler element deferred seven earlier milestones until fiscal year 2015 as a result of manufacturing and development delays (GAO 2014b).
- The schedule reserve for development of the cryocooler subsystem diminished in 2014 from 5 months to 0 months (GAO 2014b).
- The schedule reserve for the development of other subsystems has also diminished in the past year, but not as much as that for the cryocooler subsystem (GAO 2014b).
- The project entered fiscal year 2015 with approximately 40 percent of its cost reserves already committed, leaving fewer dollars available to mitigate other threats to the project schedule (GAO 2014b).
- The White House and Congress have sparred about canceling existing operating programs (e.g., SOFIA, Spitzer) to help fund JWST, although no such cancellations have yet occurred (Foust 2014).
Information Pertinent to JWST Technical Requirements, Performance, and Design
- Successful attainment of high-resolution data requires a highly controlled environment, including minimum vibration, minimum stray light, particularly in the mid-infrared range, and minimum departures from a cold and stable temperature environment (GAO 2014b; also NASA 2016b).
- Although the subcontractor has built test cryogenic compressor units that perform to NASA's specifications when connected to the spacecraft platform by bolts, it has not yet been able to get a brazed unit to perform to specification, and brazing is a design requirement for NASA systems (Leone 2014).
- The cold head assembly for the cryocooler has not been vacuum-tested in its flight-ready configuration to verify leak-tight operation with replacement valves that were recently installed in the assembly (Leone 2014).
- The JWST is considered unserviceable, since it will be located far from Earth at the second LaGrange point approximately 1 million miles from Earth (NASA 2016b).
- Although nominally unserviceable, the JWST is designed to have a grapple arm for docking, implying that the option to conduct service missions has not been completely relinquished (NASA 2016b).
In addition to information pertaining to the JWST project, historical experience obtained from the operation of the HST in low earth orbit is relevant to this demonstration because of the similarity of the missions. Of particular interest are the following bits of information obtained from various sources:
Relevant Information Pertaining to HST
- The HST has undergone several successful servicing missions enabled by its proximity to Earth, but initially there was uncertainty as to whether a successful servicing mission could be accomplished (HubbleSite.org 2016).
- Several serious operational difficulties for the Hubble required servicing missions to perform retrofits and/or corrective actions, including the famous mirror fabrication error, which greatly degraded the quality of the image (Harwood 2009).
- Other operational difficulties that required a servicing mission included replacement of solar panels to correct a jitter problem caused by excessive flexing due to orbital cycling of solar input, and replacement of several gyros that were adversely affected by the launch environment (Harwood 2009).
- New opportunities were also availed through servicing missions, including incorporation of new, more sensitive instruments and addition of the Advanced Camera for Surveys, which was used to explore dark energy and other cosmological findings revealed by the HST (NASA 2009).
4.3 Example Objectives Hierarchies
We first specify objectives separately for each organizational management unit and then integrate them together into a single objectives hierarchy that spans over the organization. The management units for this example are grouped into the following three NASA organizational levels: executive (E), mission directorate or programmatic (P), and center (C).3
4.3.1 Objectives Hierarchies for Different Management Levels
Executive-level objectives are the strategic objectives of the enterprise, derived in this case from the NASA Strategic Plan, and are considered to have a time frame of more than 10 years. Two strategic objectives are considered in this example, as shown in Figure 4.1.

Figure 4.1 Executive-level objectives for the example demonstration
Programmatic-level objectives are concerned with design, development, fabrication, fielding, and operation of systems that support the various strategic objectives that relate to NASA's mission. Four programmatic-level objectives are included in this example, as shown in Figure 4.2, differentiated according to the time frames over which they apply.
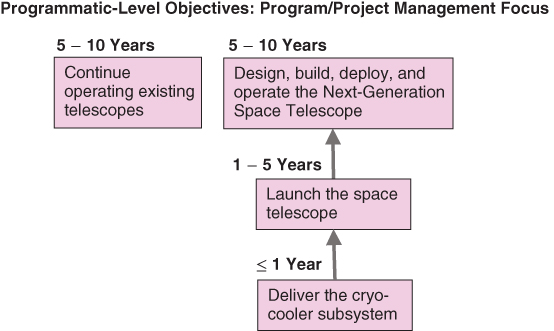
Figure 4.2 Programmatic-level objectives for the example demonstration
Center-level objectives fall into two different categories: program/project support and development of the institutional capability. Two of each category are considered in this example, as shown in Figure 4.3. Like programmatic-level objectives, they are differentiated according to the time frames over which they apply.
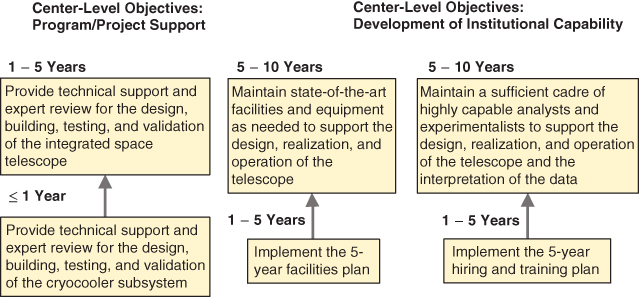
Figure 4.3 Center-level objectives for the example demonstration
4.3.2 Integrated Objectives Hierarchies for the Enterprise as a Whole
Figure 4.4 illustrates for the example demonstration how the objectives hierarchies at executive, programmatic, and center levels are integrated into a single objectives hierarchy that maintains the relationships between objectives within each level and introduces the principal interfaces that exist across levels. In general, the programmatic-level objectives support one or more executive-level objectives, whereas the center-level objectives may support both the programmatic-level objectives and one or more executive-level objectives. For example, the objective numbered C (5–10) #6 and titled “Maintain a Sufficient Cadre of Highly Capable Analysts” directly supports both objective P (5–10) #4 titled “Design, Build, Deploy, and Operate the Next Generation Space Telescope,” and objective E (>10) #2 titled “Attract and Advance a Highly Skilled Workforce, Cultivate an Innovative Work Environment, and Provide the Facilities, Tools, and Services Needed to Conduct NASA's Missions.”4

Figure 4.4 Integrated objectives hierarchy showing primary interfaces between objectives
4.4 Risks, Opportunities, and Leading Indicators
In the demonstration, as in the methodology development presented earlier (e.g., Section 1.2.4), we speak of two levels of risk and opportunity: (1) individual and (2) cumulative or aggregate. Individual risks and opportunities are introduced by means of scenario statements. Each objective in the hierarchy may have several risk and opportunity scenarios associated with it. Each objective also has cumulative risk and opportunity, which represents the roll-up of both of the following:
- The individual risk and opportunity scenarios that feed into it
- The cumulative risks and opportunities of the interfacing objectives that feed into it (i.e., its daughter objectives)
In preparation for demonstrating each step that is needed to complete the space telescope example, it is important to keep an eye on the principal outcomes that are sought. These include:
- Identification, evaluation, and ranking of individual known risks
- Identification, evaluation, and ranking of individual known opportunities
- Evaluation and ranking of cumulative known risks
- Evaluation and ranking of cumulative known opportunities
- Evaluation and ranking of cumulative UU risks
- Identification of risk and opportunity drivers and suggestions for responses, including actions and internal controls
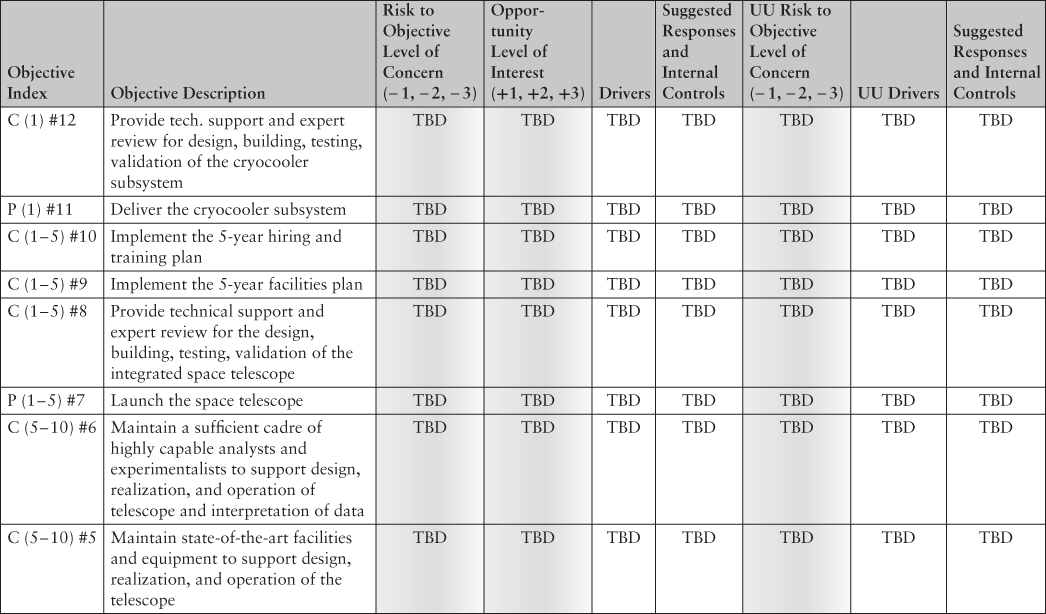
For conceptual purposes, a high-level schematic of the form of the anticipated results for cumulative risks and opportunities is shown in Table 4.1. The pursuit of the example in the following sections leads to results such as these.
Table 4.1 A View of the Form of the Outcome for Cumulative Risks and Opportunities
 |
 |
4.4.1 Known Risk and Opportunity Scenarios
Based on the information pertinent to JWST and HST presented in Section 4.2, a total of eight individual risks and one individual opportunity are postulated for this demonstration. Two of the individual risks are assigned to strategic objective E(>10) #1, as shown in Figure 4.5, and one of those is also assigned to objective E(>10) #2 because it directly affects both objectives. Also shown are suggested leading indicators that apply to each risk.

Figure 4.5 Individual risks and associated leading indicators for executive-level objectives
In Figure 4.6, another three risks, with associated leading indicators, are assigned, respectively, to programmatic objectives at the top level, the mid-term level, and the short-term level, and in Figure 4.7, two risks, with associated leading indicators, are assigned to mid-term mission support objectives C (1–5) #9 and C (1–5) #10 in the institutional category. Finally, in Figure 4.8, a single opportunity, with associated leading indicators, is identified for strategic objective E (>10) #1, along with three introduced risks, with their own associated leading indicators, that would be of concern if the opportunity were acted on.
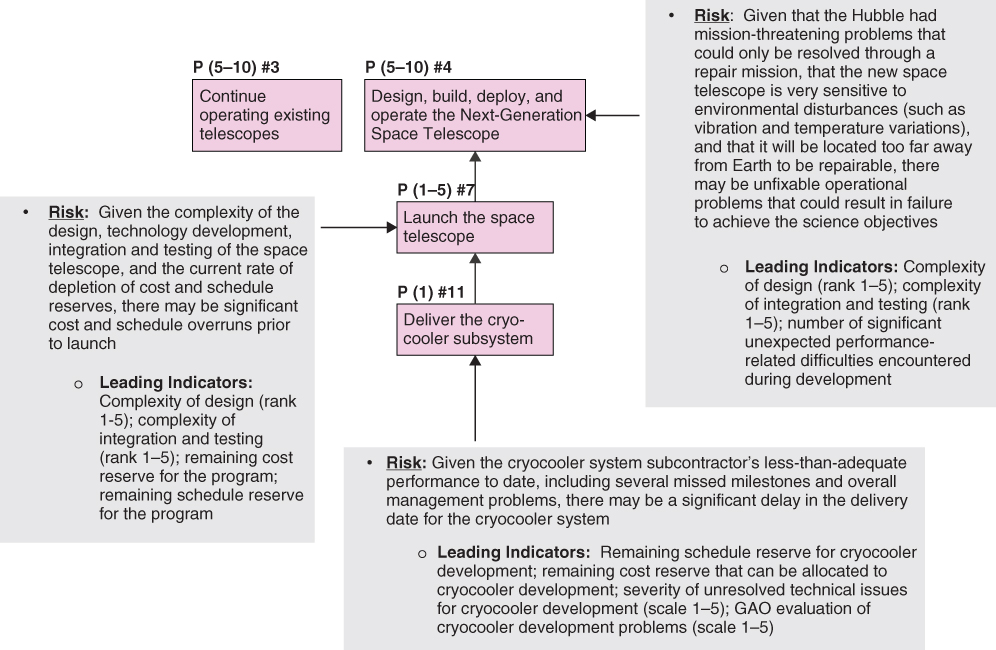
Figure 4.6 Individual risks and associated leading indicators for program-level objectives
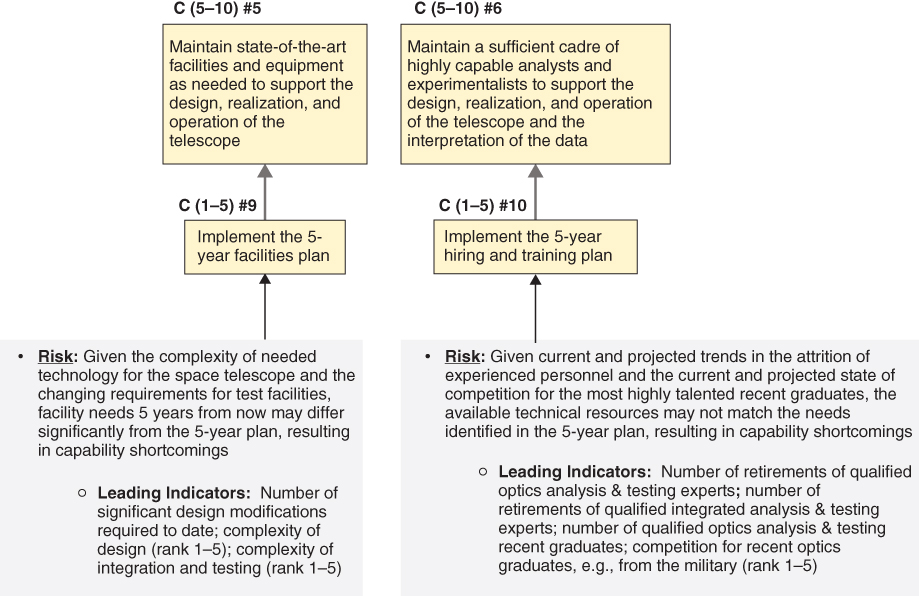
Figure 4.7 Individual risks and associated leading indicators for center-level objectives

Figure 4.8 Individual opportunities, introduced risks, and associated leading indicators for executive-level objectives
4.4.2 Cross-Cutting Risks and Opportunities
Risk and opportunity scenarios identified during the practice of EROM may be cross-cutting in several ways:
- Organizationally cross-cutting scenarios affect multiple organizational units within an enterprise. All the risks and opportunities in Figures 4.5 through 4.8 are cross-cutting in this sense.
- Programmatically cross-cutting scenarios affect multiple programs and/or projects within the enterprise. One of the two risks in Figure 4.5 (the one placed higher in the chart) and both risks in Figure 4.7 are programmatically cross-cutting.
- Strategically cross-cutting scenarios directly affect multiple high-level objectives in the objectives hierarchy. The risk in Figure 4.5 identified in the previous bullet as being programmatically cross-cutting is also strategically cross-cutting.
- Pan-agency cross-cutting scenarios affect more than one agency. Such risks occur when agencies are involved in a cooperative effort.
Furthermore, it may be observed in Figures 4.5 through 4.8 that certain leading indicators may affect multiple risk scenarios and/or multiple objectives. For example, the indicator “complexity of design” affects a risk scenario and two objectives in Figure 4.5, as well as two risks and two objectives in Figure 4.6. This may be thought of as a “cross-cutting” leading indicator.
The EROM methodology is designed to promote consideration of cross-cutting risks, opportunities, and leading indicators by allowing for them to be entered into the accounting wherever is appropriate. Multiple listings of the same scenario or indicator under different entities, programs, or objectives is not a problem so long as they are treated consistently each time they are encountered. The use of taxonomies, as described in Section 3.4.1, can facilitate the identification of cross-cutting risk and opportunity scenarios and cross-cutting leading indicators.
4.4.3 Unknown and Underappreciated Risks
The process of identifying risk and opportunity scenarios is, of course, aimed at known risks and opportunities. In addition to known scenarios, however, the potential for unknown and/or underappreciated (UU) risks must be considered when determining the overall likelihood of success or failure (i.e., the cumulative risk of not being able to satisfy the top objectives).
It may be noted that several of the leading indicators listed in Figure 4.5 through 4.7 pertain either directly or indirectly to sources of UU risk. For example, “complexity of design” and “complexity of integration and testing” are direct exemplars of the first UU factor cited in Section 3.4.5: “amount of complexity, particularly involving the interfaces between different elements of the system.” In addition, the following leading indicator cited in Figure 4.6: “severity of unresolved technical issues for cryocooler development,” is an indirect exemplar of the third UU factor in Section 3.4.5: “use of fundamentally new technology or fundamentally new application of an existing technology.” If the assessment in this example had been performed prior to 2010, the sixth UU factor in Section 3.4.5 might also have been cited as a leading indicator of future risks about former management deficiencies pertaining to subcooler development: “degree of oversight when responsibilities are distributed among various entities” (NASA 2016b; HubbleSite.org 2016).
Beside these indicators, there are also other leading indicators (see Section 3.4.5) that tend to be correlated with the occurrence of UU challenges. Two of the most important are:
- Pressures to meet extremely tight schedules and/or budgets, particularly in combination with a complex set of tasks
- Deficiencies of management such as failure to maintain adequate oversight of distributed suppliers and failure to respect and promote open communication
In addition to the ranking of cumulative known risks and opportunities for each objective, therefore, the principal outcome of the demonstration will also include a ranking of the cumulative level of concern for UU risks based on the leading indicators that pertain to UU risks, along with a list of the key attributes of the UU indicators that drive that cumulative ranking.5
4.5 Example Templates for Risk and Opportunity Identification and Evaluation
Sections 4.5, 4.6, and 4.7 present a series of templates intended to demonstrate how the information presented in the preceding sections can be used first to evaluate the aggregate risk and aggregate opportunity associated with each objective in the integrated hierarchy of objectives, and then to identify and evaluate options for risk mitigation, opportunity action, and internal control. The principal purpose of the templates is to ensure that all relevant information is brought to bear in a fashion that is rational, comprehensive, and transparent.
4.5.1 Risk and Opportunity Identification Template
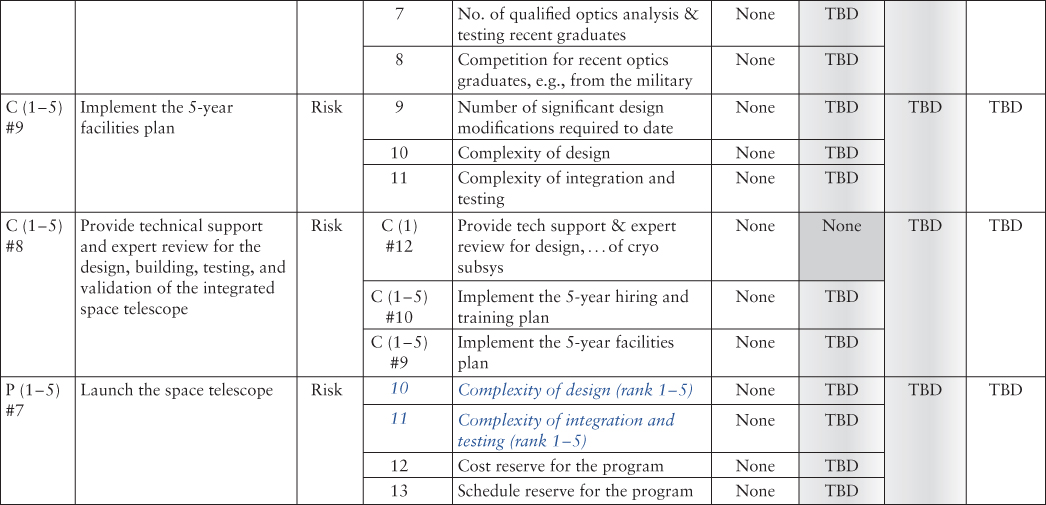
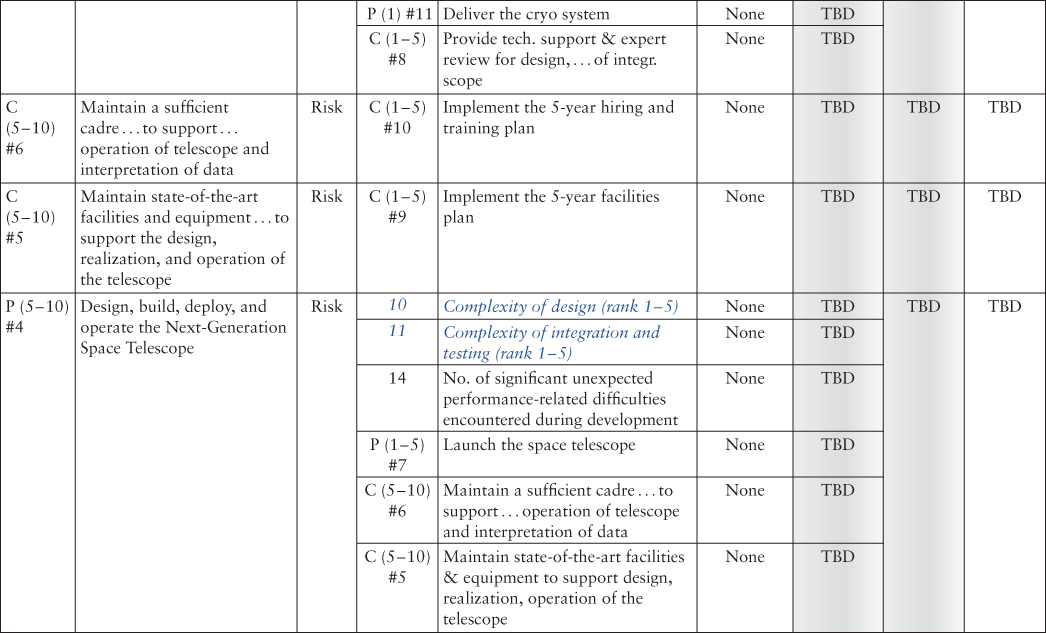
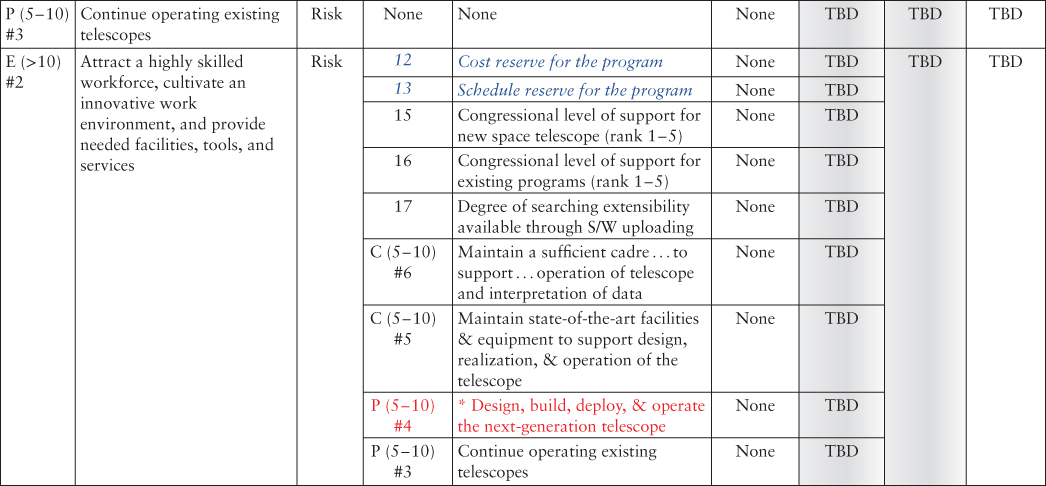
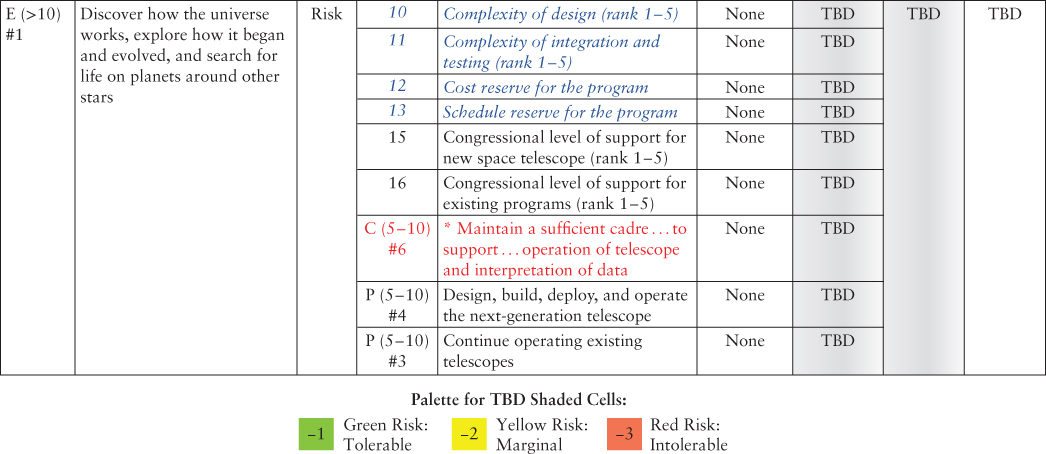
Table 4.2 presents the Risk and Opportunity Identification Template, which collects the information about known risks and opportunities presented in Section 4.4. It does this by tabulating the identified individual risk, opportunity, and introduced risk scenarios, the leading indicators for each scenario, and the objective to which each scenario is assigned.
Table 4.2 Risk and Opportunity Identification Template
Italic typeface denotes repeated instances of risks, opportunities, or leading indicators
| Obj. No. | Objective Description | Scen. Type | Scen. No. | Scenario Statement | Leading Indicator Number | Leading Indicator Description |
| P (1) #11 | Deliver the cryocooler subsystem | Risk | 1 | Given the cryocooler system subcontractor's less-than-adequate performance to date, including several missed milestones and overall management problems, there may be a significant delay in the delivery date for the cryocooler system | 1 | Remaining schedule reserve for cryocooler development |
| 2 | Remaining cost reserve for the program that can be allocated to cryo devel. | |||||
| 3 | Severity of unresolved technical issues for cryo development (scale 1–5) | |||||
| 4 | GAO evaluation of cryocooler development problems (scale 1–5) | |||||
| C (1–5) #10 | Implement the 5-year hiring and training plan | Risk | 2 | Given current and projected trends in the attrition of experienced personnel and the current and projected state of competition for the most highly talented recent graduates, the available technical resources may not match the needs identified in the 5-year plan, resulting in capability shortcomings | 5 | Number of retirements of qualified optics analysis & testing experts |
| 6 | Number of retirements of qualified integated analysis & testing experts | |||||
| 7 | Number of qualified optics analysis & testing recent graduates | |||||
| 8 | Competition for recent optics graduates, e.g., from the military (rank 1–5) | |||||
| C (1–5) #9 | Implement the 5-year facilities plan | Risk | 3 | Given the complexity of needed technology for the space telescope and the changing requirements for test facilities, facility needs 5 years from now may differ significantly from the 5-year plan, resulting in capability shortcomings | 9 | Number of significant design modifications required to date |
| 10 | Complexity of design (rank 1–5) | |||||
| 11 | Complexity of integration and testing (rank 1–5) | |||||
| P (1–5) #7 | Launch the space telescope | Risk | 4 | Given the complexity of the design, technology development, integration and testing of the space telescope and the current rate of depletion of cost and schedule reserves, there may be significant cost and schedule overruns prior to launch | 10 | Complexity of design (rank 1–5) |
| 11 | Complexity of integration and testing (rank 1–5) | |||||
| 12 | Remaining cost reserve for the program | |||||
| 13 | Remaining schedule reserve for the program | |||||
| P (5–10) #4 | Design, build, deploy, and operate the Next-Generation Space Telescope | Risk | 5 | Given that the Hubble had mission-threatening problems that could only be resolved through a repair mission, that the new space telescope is very sensitive to environmental disturbances, and that it will be located too far away from Earth to be repairable, there may be unfixable operational problems that could result in failure to achieve the science objectives | 10 | Complexity of design (rank 1–5) |
| 11 | Complexity of integration and testing (rank 1–5) | |||||
| 14 | Number of significant unexpected performance-related difficulties encountered during development | |||||
| E (>10) #2 | Attract a highly skilled workforce, cultivate an innovative work environment, and provide needed facilities, tools, and services | Risk | 6 | Given the current and projected rate of depletion of cost and schedule reserves in the space telescope program, the need to maintain adequate reserves in that program, and Congress's aversion to running significant deficits, Congress may stop funding the new program and/or one or more operational programs (e.g., SOFIA or Spitzer) | 12 | Cost reserve for the program |
| 13 | Schedule reserve for the program | |||||
| 15 | Congressional level of support for the new space telescope (rank 1–5) | |||||
| 16 | Congressional level of support for the operating programs (rank 1–5) | |||||
| E (>10) #1 | Discover how the universe works, explore how it began and evolved, and search for life on planets around other stars | Risk | 6 | Same as above | 10–13, 15,16 | Same as above |
| Risk | 7 | Given that much of the Hubble's value resulted from retrofits during operation that increased its capabilities and enabled it to explore new findings, and that the new space telescope lacks this accessibility for retrofitting, achievement of the expected scientific value of the new telescope may require additional missions with entirely new systems and corresponding additional cost | 17 | Degree of searching extensibility available through software uploading (rank 1–5) | ||
| E (>10) #1 | Discover how the universe works, explore how it began and evolved, and search for life on planets around other stars | Opp. | 8 | Given the rate of tech. advancement and the fact that the space telescope has a grapple arm, it is possible that significant new technology advancements (such as a camera with improved resolution) could be delivered and installed on the telescope through retrofitting either by astronauts or robotically | 18 | Technology readiness level for improved resolution infrared cameras |
| 19 | Readiness level for SLS/Orion, including docking capability | |||||
| Intr. Risk | 9 | If the retrofit requires astronaut participation, the likelihood of loss of crew may be unacceptable | 20 | Predicted P(LOC) for SLS/Orion for a lunar mission | ||
| Intr. Risk | 10 | If the retrofit can be performed robotically, the likelihood of loss of mission may be unacceptable | 21 | Predicted P(LOM) for SLS | ||
| Intr. Risk | 11 | The cost of the retrofit mission, whether crewed or robotic, may be unacceptable | 22 | Predicted cost for a rendezvous mission |
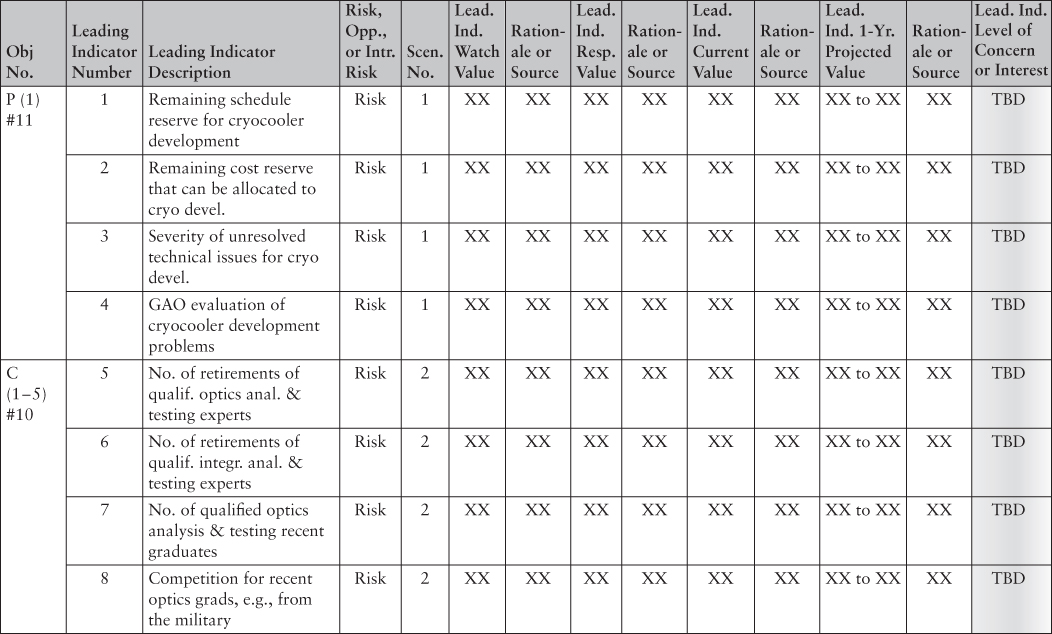
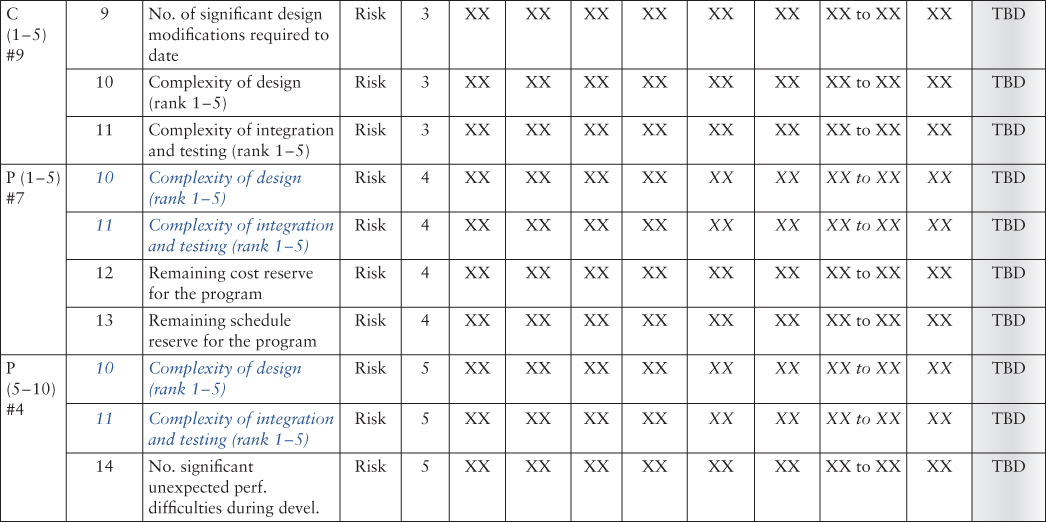
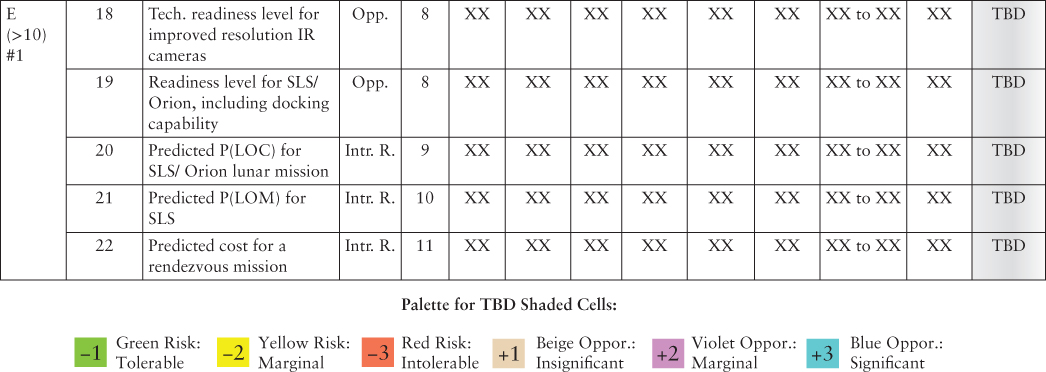
4.5.2 Leading Indicator Evaluation Template
Table 4.3 presents the Leading Indicator Evaluation Template, which is used to assign watch and response trigger values to each leading indicator, record the current value of the indicator, and provide an indication of the trend. As explained earlier, leading indicator trigger values are used to signal when a risk is reaching a risk tolerance boundary or when an opportunity is reaching an opportunity appetite boundary. Reaching the trigger values for risk leading indicators implies that the likelihood of not being able to satisfy an element of the strategic objectives hierarchy is becoming a concern. Reaching the trigger values for opportunity leading indicators implies either that there is a potential for significantly increasing the likelihood of being able to satisfy an element of the strategic objectives hierarchy or that there is an emerging opportunity to achieve new goals and objectives that were formerly considered unreachable or inconceivable. Exceedance of a watch trigger suggests that an action should be considered but is not imminently needed. Exceedance of a response trigger suggests that an action may be imminently needed (e.g., mitigation of the risk or exploitation of the opportunity).
Table 4.3 Leading Indicator Evaluation Template
| Italic typeface denotes repeated instances of leading indicators |
 |
 |
 |
 |
The level of concern for a given leading indicator is determined by where the current value of the leading indicator and/or a projected future value lie with respect to the watch and response trigger values. In Table 4.3, the projected future value one year from the present (referred to earlier as the “trend”) is shown as a range to account for uncertainty. For conceptual purposes, it may be helpful for some people to think of the uncertainty range as being more-or-less a 90 percent confidence interval for the future value of the leading indicator. However, if confidence levels are used in this context, they should be thought of as qualitative degrees of belief and not statistical quantities.
Table 4.4 illustrates how the Leading Indicator Evaluation Template might be completed for short-term programmatic objective P (1) #11, titled “Deliver the cryocooler subsystem.” The entries are based principally on information about the JWST that was previously itemized in Section 4.2—that is, publicly available material. The use of this information is summarized in the columns labeled “Rationale.” In short, the template records the following information:
Table 4.4 Example Entries for Leading Indicator Evaluation Template for Objective P(1) #11: Deliver the Cryocooler Subsystem
| Objec. No. | Leading Indicator Number | Leading Indicator Description | Risk, Opp., or Ind. Risk | Scen. No. | Lead. Ind. Watch Value | Rationale or Source | Lead. Ind. Resp. Value | Rationale or Source | Lead. Ind. Current Value | Rationale or Source | Lead Ind. 1-Yr. Projected Value | Rationale or Source | Leading Indicator Level of Concern |
| P (1) #11 | 1 | Remaining schedule reserve for cryocooler development | Risk | 1 | 50% of plan | Historically correlated with moderate likelihood of overrun | 10% of plan | Historically correlated with high likelihood of overrun | 0% of plan | As reported by GAO | 0% to 30% of plan | The schedule reserve for cryo development diminished from 5 months to 0 months in the past year, but there is enough schedule reserve in other tasks to divert manpower to the cryocooler development task so as to regain its positive reserve | −3 Red: Intolerable |
| P (1) #11 | 2 | Remaining cost reserve for the program that can be allocated to cryocooler development | Risk | 1 | 50% of plan | Historically correlated with moderate likelihood of overrun | 10% of plan | Historically correlated with high likelihood of overrun | 10% of plan | As reported by GAO, 60% of last year's program cost reserve remains. Assuming that 50% of the initial cost reserve has to be available for other contingencies, there is a remaining reserve of 10% that can be allocated to cryo devel. | 30% to 50% of plan | More cost reserves will become available in 2016, according to the GAO. Also, JPL's analysis of subcontractor performance trends projects that cryocooler development will not be delayed by more than 7 months, making it likely that integrated testing will begin on time (February 2016). | −2 Yellow: Marginal |
| P (1) #11 | 3 | Severity of unresolved technical issues for cryocooler development (scale 1–5) | Risk | 1 | 2 | Any nontrivial unresolved technical issue requires watching | 3 | Technical issues of moderate severity require a response | 3 | Unresolved issues include (1) failure of compressor to perform to specification when brazed to spacecraft; (2) validation of replacement valves in cold-head assembly during vacuum testing; (3) cryocooler generated vibration possibly exceeding permissible levels | 1 to 3 | Resolution of these technical issues has to be verified by as-flown testing of prototype assemblies, which will occur during 2015. Successful results are expected but, as with any test, success is not guaranteed beforehand. | −2 Yellow: Marginal |
| P (1) #11 | 4 | GAO evaluation of cryocooler development problems (scale 1–5, 1 = very low confidence, 5 = very high confidence) | Risk | 1 | 4 | When confidence is high but not very high, watchfulness is needed | 2 | When confidence is low, a response is needed | 3 | GAO report: “During the past year, delays have occurred on every element and major subsystem schedule—especially with the cryocooler—leaving all at risk of negatively impacting the overall project schedule reserve if further delays occur.” | 3 to 5 | JPL's analysis of subcontractor performance trends, cited above, suggests that GAO's concerns may be resolved within the next year. | −2 Yellow: Marginal |
- The 100 percent reduction during the past year in the schedule margin for development of the cryocooler (leading indicator 1) has caused concern about the cryocooler delivery date and the schedule of the program as a whole.
- The 40 percent reduction during the past year in the cost margin for the program as a whole (leading indicator 2) has caused concern about the amount of resources that can be reallocated to the cryocooler.
- The fact that several significant technical issues have not yet been completely resolved (leading indicator 3) has caused further concern.
- A somewhat negative progress report written by the GAO (leading indicator 4) about management problems concerning the cryocooler development has again caused concern.
- A trending analysis by JPL implying that the schedule margin will not be further degraded (one-year projected value for leading indicator 1) has alleviated some concern, particularly since the analysis indicates that the schedule for integrating the cryocooler with the spacecraft and beginning the integrated testing should remain intact.
- The warning signs discussed by the GAO, however, suggest there is a large amount of uncertainty in JPL's estimate, leading to additional concern.
4.6 Example Templates for Risk and Opportunity Roll-Up
4.6.1 Objectives Interface and Influence Template
While the principal interfaces between the objectives were displayed in Figure 4.4, a number of secondary interfaces could also be postulated. For this demonstration, three secondary interfaces between the top level of the programmatic and mission support objectives and the executive level strategic objectives are also considered, as shown in Figure 4.9.
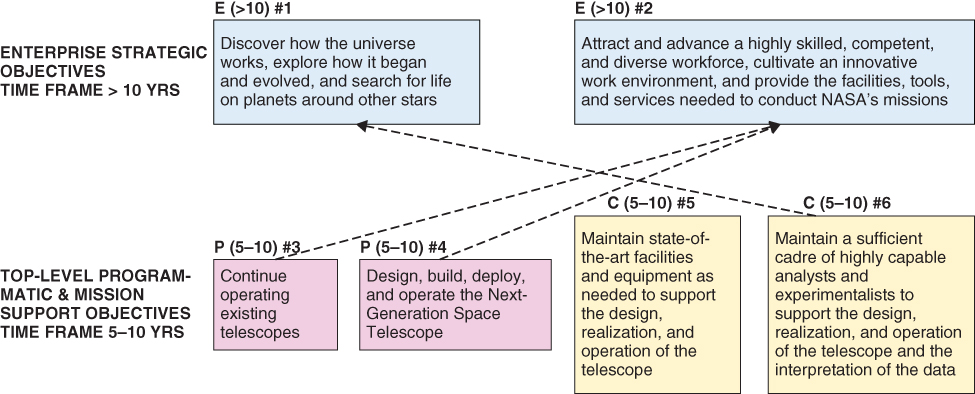
Figure 4.9 Secondary objective interfaces for the example demonstration
Two of the secondary objectives account for the fact that the success of the exploratory programs and projects (objectives P (5–10) #3 and P (5–10) #4) influence the success of attracting a highly skilled workforce and providing the needed facilities (objective E (>10) #2) by defining the technical qualifications that are needed within the workforce, by providing an incentive for qualified technical people to work at NASA, and by providing the driving function for the facilities to be developed. The third recognizes the fact that maintaining a sufficient cadre of highly capable analysts (objective C (5–10) #6) is necessary in order to successfully interpret the data obtained from the telescopes during their operation and to set the direction for additional observations.
The objectives interface and influence template encodes this sort of information in tabular form, as shown in Table 4.5.
Table 4.5 Objectives Interface and Influence Template
Asterisk denotes secondary interfaces
| Obj. No. | Objective Description | Num. Infl. Objs. | Influencing Obj. No. | Influencing Objective Description | Basis for Influence |
| C (1) #12 | Provide technical support and expert review for the design, building, testing, and validation of the cryocooler subsystem | 0 | |||
| P (1) #11 | Deliver the cryocooler system | 1 | C (1) #12 | Provide technical support and expert review for the design, building, testing, and validation of the cryocooler subsystem | Necessary milestone before delivery |
| C (1–5) #10 | Implement the 5-year hiring and training plan | 0 | |||
| C (1–5) #9 | Implement the 5-year facilities plan | 0 | |||
| C (1–5) #8 | Provide technical support and expert review for the design, building, testing, validation of the integrated space telescope | 3 | C (1) #12 | Provide technical support and expert review for the design, building, testing, and validation of the cryocooler subsystem | Necessary milestone before integration |
| C (1–5) #10 | Implement the 5-year hiring and training plan | Necessary capability to achieve objective | |||
| C (1–5) #9 | Implement the 5-year facilities plan | Necessary capability to achieve objective | |||
| P (1–5) #7 | Launch the space telescope | 2 | P (1) #11 | Deliver the cryo system | Necessary milestone before launch readiness |
| C (1–5) #8 | Provide technical support and expert review for the design, building, testing, validation of the integrated space telescope | Necessary milestone before launch readiness | |||
| C (5–10) #6 | Maintain a sufficient cadre of highly capable analysts and experimentalists to support the design, realization, and operation of the telescope and the interpretation of the data | 1 | C (1–5) #10 | Implement the 5-year hiring and training plan | Necessary capability to achieve objective |
| C (5–10) #5 | Maintain state-of-the-art facilities and equipment as needed to support the design, realization, and operation of the telescope | 1 | C (1–5) #9 | Implement the 5-year facilities plan | Necessary capability to achieve objective |
| P (5–10) #4 | Design, build, deploy, and operate the Next-Generation Space Telescope | 3 | P (1–5) #7 | Launch the space telescope | Necessary milestone before operation |
| C (5–10) #6 | Maintain a sufficient cadre of highly capable analysts and experimentalists to support the design, realization, and operation of the telescope and the interpretation of the data | Supports telescope design, development, deployment, and operation | |||
| C (5–10) 5 | Maintain state-of-the-art facilities and equipment as needed to support the design, realization, and operation of the telescope | Supports telescope design, development, deployment, and operation | |||
| P (5–10) #3 | Continue operating existing telescopes | 0 | |||
| E (>10) #2 | Attract and advance a highly skilled, competent, and diverse workforce, cultivate an innovative work environment, and provide the facilities, tools, and services needed to conduct NASA's missions | 4 | C (5–10) #6 | Maintain a sufficient cadre of highly capable analysts and experimentalists to support the design, realization, and operation of the telescope and the interpretation of the data | Supports maintenance of technical capabilities |
| C (5–10) #5 | Maintain state-of-the-art facilities and equipment as needed to support the design, realization, and operation of the telescope | Supports maintenance of technical capabilities | |||
| P (5–10) #4 | * Design, build, deploy, and operate the Next-Generation Space Telescope | * Program success promotes public interest and supports NASA's mission | |||
| P (5–10) #3 | * Continue operating existing telescopes | * Program success promotes public interest | |||
| E (>10) #1 | Discover how the universe works, explore how it began and evolved, and search for life on planets around other stars | 3 | C (5–10) #6 | * Maintain a sufficient cadre of highly capable analysts and experimentalists to support the design, realization, and operation of the telescope and the interpretation of the data | * Necessary capability to ensure optimal science gain |
| P (5–10) 4 | Design, build, deploy, and operate the next space telescope | Program success promotes discovery of universe | |||
| P (5–10) 3 | Continue operating existing telescopes | Program success promotes discovery of universe |
4.6.2 Known Risk Roll-Up Template
The aggregate risk of not successfully meeting an objective can be evaluated by rolling up the individual risk scenarios in either of two alternative ways. The first alternative is illustrated in Figure 4.10, with reference to one of the top objectives in Figure 4.4, and consists of the following steps:

Figure 4.10 Schematic of roll-up method alternative 1 for Objective E (>10) #1
- Identify the objective of interest from the objectives hierarchy (Figure 4.4).
- Identify the risk scenarios associated with the objective from the Risk and Opportunity Identification Template (Table 4.2).
- Identify the risk leading indicators associated with each risk scenario from the Risk and Opportunity Identification Template (Table 4.2), and evaluate the leading indicator levels of concern using the Leading Indicator Evaluation Template (Table 4.3).
- Roll up the leading indicator levels of concern for each risk scenario to obtain a corresponding level of concern for each risk scenario using a transparent and documented roll-up rationale.
- Roll up the levels of concern for the risk scenarios, obtained from the previous bullet, with the levels of concern obtained for the interfacing objectives, using the Objectives Interface and Influence Template (Table 4.5) to identify the interfacing objectives. (The order of the roll-up is such that the levels of concern for the interfacing objectives will have been determined prior to the present roll-up.)
The rolled-up level of concern at the end of the process is defined as the aggregate, or cumulative, risk of not meeting the objective, and the transparent and documented rationale for the roll-up process defines the justification for the aggregate risk.
The second alternative for rolling up levels of concern to obtain the aggregate risk of an objective is illustrated in Figure 4.11. The difference between it and the first alternative is that it cuts out one of the steps. Specifically, the aggregate risk of the objective is determined by rolling up the levels of concern for the leading indicators directly (together with the levels of concern for the interfacing objectives), without first performing a roll-up from the leading indicators to the risk scenarios. The rationale is that the leading indicators are de facto surrogates for the risk scenarios, and so it is as reasonable to infer the aggregate risk of not meeting an objective from the levels of concern associated with the leading indicators as it is to infer the aggregate risk from the levels of concern of the risk scenarios. Thereafter, it is possible to determine levels of concern for each risk scenario by performing an after-the-fact roll-up from leading indicators to individual risk scenarios in order to assess the importance of each risk scenario.
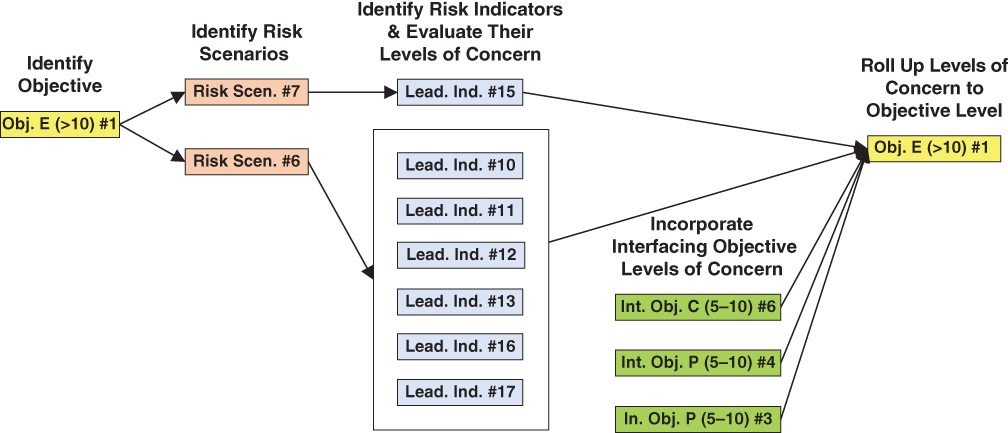
Figure 4.11 Schematic of roll-up method alternative 2 for Objective E (>10) #1
Using the second alternative, the aggregate risk of not being successful in delivering the cryocooler subsystem in a timely manner (Objective P (1) #11) is reflective of a roll-up of the levels of concern for Leading Indicators 1 through 4 and the aggregate risk of not being able to provide the needed technical support for this task (Objective C (1) #12), as shown in Figure 4.12.
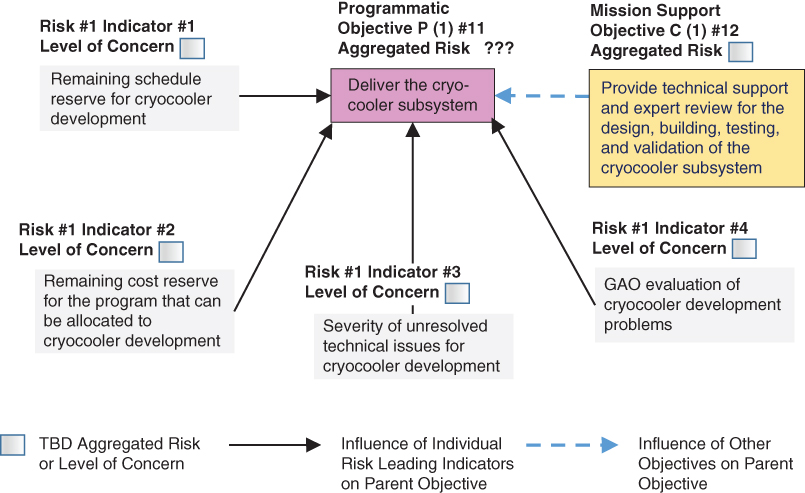
Figure 4.12 Schematic of risk roll-up for Objective P (1) #11 in the example demonstration
The associated roll-up is performed on the Known Risk Roll-Up Template, Table 4.6. A similar template for opportunity roll-up will be discussed in the next subsection.
Table 4.6 Known Risk Roll-Up Template
| Italic typeface denotes repeated instances of leading indicators Asterisk denotes secondary interfaces |
 |
 |
 |
 |
 |
For each objective, starting from the bottom and working up to the top, the Known Risk Roll-Up Template lists all the risk indicators and interfacing objectives that feed into it. As mentioned, these inputs are obtained from prior templates. The following paragraphs discuss the additional information that is contained in the template, starting from the sixth column.
Composite Indicator
The column labeled “Composite Indicator” provides a means for accounting for the fact that the trigger values for some of the indicators may depend on the values of other indicators. Such codependencies may be important. (For example, trigger values for cost and schedule margins will normally depend on the amount of work remaining to be accomplished, as indicated by the number and complexity of unresolved issues.) For simplicity, we initially assume that we do not need to specify codependencies between indicators to execute the demonstration, but we will return to the subject later.6
Leading Indicator Level of Concern/Influencing Objective Level of Risk
As mentioned, the roll-up process accounts for two types of risk input: (1) the level of concern for the leading indicators that are associated with the objective, and (2) the aggregate risk for the interfacing objectives that feed into it. The level of concern for leading indicators has already been recorded in the Leading Indicator Evaluation Template (Table 4.3) and is transcribed from that template into the Known Risk Roll-Up Template. The aggregate risk for influencing objectives, on the other hand, is obtained from the portion of the roll-up process that has already been performed and entered earlier into the Known Risk Roll-Up Template. For example, the aggregate risk for Objective C(1) #12, which feeds into P(1) #11, has been entered higher up in Table 4.6.
Aggregate Risk of Objective and Roll-Up Rationale
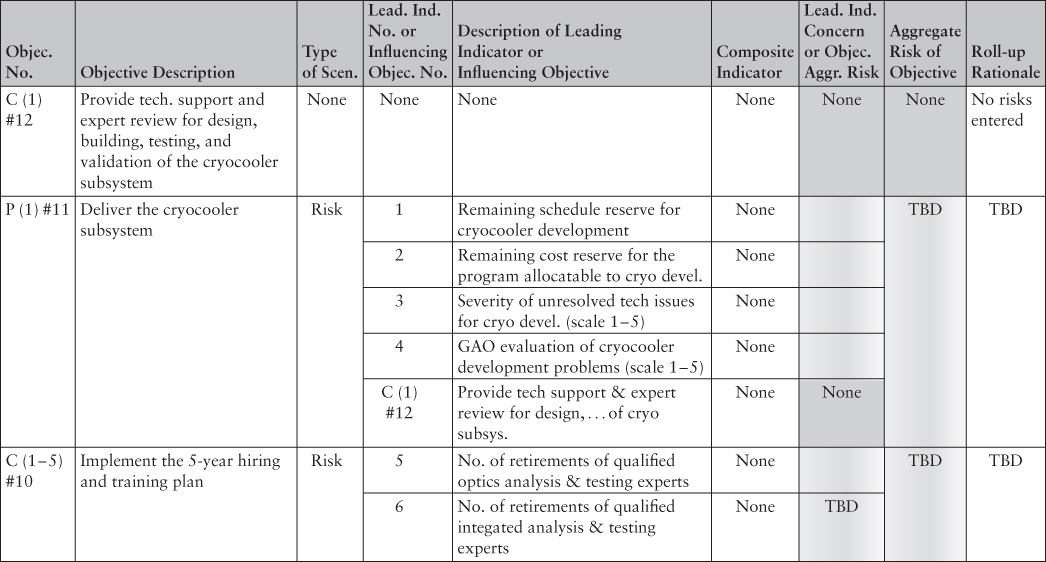
The roll-up of levels of concern for leading indicators and aggregate risks for influencing objectives is conducted according to the rationale provided in the last column of the Risk Roll-Up Template. The process is objective but not quantitative. It is most easily demonstrated by considering the roll-up rationale that might be employed for Objective P(1) #11: Deliver the cryocooler subsystem. Table 4.7 provides this demonstration. As before with the example for the Leading Indicator Evaluation Template (Table 4.4), the rationale is based on publicly available information about the JWST that was previously itemized in Section 4.2. In short, the template records the following information:
Table 4.7 Example Entries for Known Risk Roll-Up Template for Objective P(1) #11: Deliver the Cryocooler Subsystem
| Objec. No. | Objective Description | Type of Scen. | Lead. Ind. No. or Infl. Obj. No. | Description of Leading Indicator or Influencing Objective | Composite Indicator | Lead. Ind. Concern or Objec. Aggr. Risk | Aggregate Risk of Objective | Roll-up Rationale |
| C (1) #12 | Provide tech. support and expert review for design, building, testing, and validation of the cryo subsystem | None | None | None | None | −1 Green Tolerable |
−1 Green Tolerable |
No risks entered |
| P (1) #11 | Deliver the cryocooler subsystem | Risk | 1 | Remaining schedule reserve for cryocooler development | None | −3 Red Intolerable |
−2 Yellow Marginal |
Although the remaining schedule reserve for the cryocooler development is red (surpassing the response trigger), the overall risk of not meeting the objective of delivering the cryocooler subsystem is yellow (marginal) because:
|
| 2 | Remaining cost reserve for the program that can be allocated to cryocooler development | None | −2 Yellow Marginal |
|||||
| 3 | Severity of unresolved technical issues for cryocooler development (scale 1–5) | None | −2 Yellow Marginal |
|||||
| 4 | GAO evaluation of cryocooler development problems (scale 1–5, 1 = very low confidence, 5 = very high confidence) | None | −2 Yellow Marginal |
|||||
| C (1) #12 | Provide technical support and expert review for design, building, testing, and validation of cryocooler subsystem | None | −1 Green Tolerable |
- The cryocooler development schedule can be accelerated by diverting additional budget and manpower to this task from other tasks whose reserves are not at risk.
- JPL's analysis of subcontractor performance trends projects that development will not be delayed by more than seven months to November 2015, making it likely that integrated testing will begin on time during February 2016.
- Therefore, the overall risk of not meeting the objective of delivering the cryocooler subsystem is marginal, even though the year's schedule reserve for cryocooler development has been depleted.
For comparison, Table 4.8 illustrates how Table 4.7 would be reconstructed to reflect the alternative 1 roll-up method, which includes an intermediate roll-up of leading indicators to risk scenario level in accordance with the schematic representation in Figure 4.10.
Table 4.8 Example Entries for Risk Roll-Up Template for Objective P(1) #11 Including an Intermediate Roll-Up to Risk Scenario Level
| Objec. No. | Objective Descrip. | Type of Scen. | Risk No. or Influencing Objec. No. | Risk or Influ-encing Objec. Descrip. | Lead. Ind. No. | Description of Leading Indicator | Composite Indicator | Leading Indicator Level of Concern | Roll-up to Risk Scen. Level of Concern | Rationale for Roll-up to Risk Scenario Level | Aggregated Risk of Objective | Rationale for Roll-up to Objective Level |
| C (1) #12 | Provide tech. support and expert review for design, building, testing, and validation of the cryo subsystem | −1 Green Tolerable |
No risks entered | −1 Green Tolerable |
No roll-up at the lowest level | |||||||
| P (1) #11 | Deliver the cryocooler subsystem | Risk | 1 | There may be a significant delay in the delivery date for the cryocooler system | 1 | Remaining schedule reserve for cryocooler development | None | −3 Red Intolerable |
−2 Yellow Marginal |
Although the remaining schedule reserve for the cryo. development is red, the overall risk of not meeting the objective of delivering the cryo. subsystem is yellow (marginal) because:
|
−2 Yellow Marginal |
There are no compen-sating factors in rolling up Risk 1 with the risk of not not meeting Objective C (1) #12. |
| 2 | Remaining cost reserve for the program that can be allocated to cryocooler development | None | −2 Yellow Marginal |
|||||||||
| 3 | Severity of unresolved technical issues for cryocooler development (scale 1–5) | None | −2 Yellow Marginal |
|||||||||
| 4 | GAO evaluation of cryocooler development problems (scale 1–5, 1 = very low confidence, 5 = very high confidence) | None | −2 Yellow Marginal |
|||||||||
| Risk | C (1) #12 | Org. may fail to provide adequate technical support and expert review for design, building, testing, and validation of cryo subsystem | −2 Yellow Marginal |
Carried down from Objective C (1) #12 | ||||||||
4.6.3 Opportunity Roll-Up Template
The Opportunity Roll-Up Template, Table 4.9, is comparable to the Known Risk Roll-Up Template, Table 4.6, with the exception that the opportunity scenarios generally have accompanying introduced risks. For the example being considered, the opportunity scenario (as entered into the Risk and Opportunity Identification Template, Table 4.2) is that it may be possible for significant new technology advancements (such as a camera with improved resolution) to be delivered and installed on the telescope through retrofitting either by astronauts or robotically, since the JWST spacecraft is designed with a grapple arm. This could be the case even though the JWST is described by NASA as unserviceable, given that the incentive for trying such a rendezvous mission is strong enough to justify the risks. In this case, the introduced risks are that the likelihood of loss of crew (LOC) or loss of mission (LOM), depending on whether the mission is crewed or robotic, may be unacceptably high, and/or that the cost of the retrofit mission may likewise be too high. The leading indicators for the opportunity are the technology readiness level for improved-resolution infrared cameras and the readiness level for the Space Launch System (SLS), including Orion if the mission is crewed. The leading indicator for the introduced risk pertaining to the probability of LOC or LOM is the most current predictive estimate of P(LOC) or P(LOM) obtained from a probabilistic risk assessment (PRA) for an analogous SLS/Orion mission involving lunar orbit. The leading indicator for the introduced risk pertaining to cost is likewise the most current cost estimate for the analogous mission.
Table 4.9 Opportunity Roll-Up Template
 |
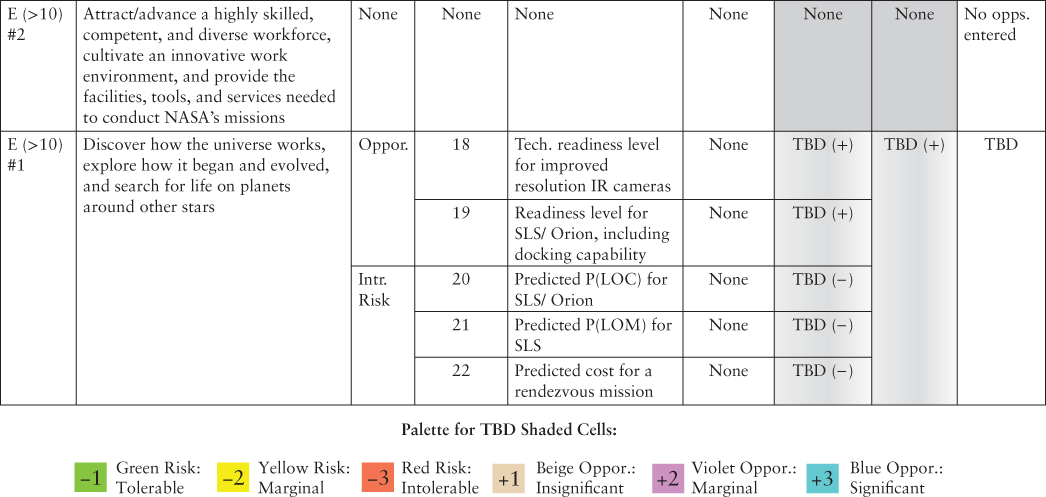 |
Since the only opportunity scenario for this example is introduced at the top level of the objectives hierarchy (i.e., at Objective E(>10) #1), there are no roll-ups for opportunity from lower-level objectives to higher level objectives. Rather, the roll-up in this example concerns only the relevant leading indicators for opportunity and introduced risk at the level of Objective E(>10) #1 (which is entered at the bottom of Table 4.9). Before performing this roll-up, the significance of the opportunity leading indicators and the tolerability of the introduced risk leading indicators are transferred from the Leading Indicator Evaluation Template (Table 4.3) to the column labeled “Leading Indicator Significance” in Table 4.9. The roll-up for the aggregate opportunity in the next-to-last column of Table 4.9 is based on the perceived balance between the opportunity and the introduced risks as informed by the values of the respective leading indicators. The rationale for the perception of balance is recorded in the last column of Table 4.9.
An example opportunity roll-up is shown in Table 4.10. In this example, the likelihood of being able to conduct a service mission to install a significantly improved IR camera is considered high based on anticipated technology developments, and so the opportunity leading indicators are colored blue (significant opportunity). Less happily, the present-day cost of a rendezvous mission is considered intolerable by today's standards, and hence the leading indicator for the introduced risk associated with cost is red (intolerable). However, the cost may be perceived to be more tolerable once the system is operational because of the following rationale:
Table 4.10 Example Entries for Opportunity Roll-Up for Objective E(>10) #1: Discover How the Universe Works, Explore How It Began/Evolved, Search for Life on Planets Around Other Stars
| Objec. No. | Objective Description | Type of Scen. | Lead. Ind. No. or Influencing Objec. No. | Description of Leading Indicator or Influencing Objective | Composite Indicator | Lead. Ind. Significance or Objec. Aggr. Opp. | Aggregate Opp. of Objective | Roll-Up Rationale |
| E (>10) #1 | Discover how the universe works, explore how it began and evolved, and search for life on planets around other stars | Oppor. | 18 | Tech. readiness level for improved resolution IR cameras | None | +3 Blue Significant |
+2 Violet Marginal |
Although the estimated cost of a rendezvous is intolerable based on current funding for the program, it may become more tolerable once the system is operational because:
|
| 19 | Readiness level for SLS/ Orion, including docking capability | None | +3 Blue Significant |
|||||
| Intr. Risk | 20 | Predicted P(LOC) for SLS/ Orion | None | −2 Yellow Marginal |
||||
| 21 | Predicted P(LOM) for SLS | None | −1 Green Tolerable |
|||||
| 22 | Predicted cost for a rendezvous mission | None | −3 Red Intolerable |
- Public enthusiasm for the program will likely increase substantially, as it did for Hubble, once the telescope is operational and its scientific value is fully appreciated.
- Issues about the feasibility of performing a rendezvous will likely abate once the SLS/Orion system becomes operational and is shown to be reliable and safe.
- The economic recovery will likely increase the willingness of the country to spend more on space.
Since it is considered likely that the perceived cost of the rendezvous will become more tolerable over time, the aggregate opportunity considering leading indicators for both opportunity and introduced risks is ranked as marginal rather than insignificant.
4.6.4 Composite Indicator Identification and Evaluation Template
In the examples shown so far, all of the leading indicators have been considered to be standalone indicators, even though the templates have included the possibility for introducing composite indicators. Considering them to be independent in setting trigger values is acceptable as long as the rationale for aggregating them accounts for the more complex relationships that may exist between them. Thus, ameliorating factors were introduced in the rationale column in Table 4.7 to justify an aggregated risk that was yellow (marginal) rather than red (intolerable), and in Table 4.10 to justify an aggregated opportunity that was violet (marginal) rather than beige (insignificant), even though one of the indicators in each case was red.
Using a composite indicator recognizes the fact that the trigger values of some of the indicators may depend on the values of other indicators. For example, in the example for the Leading Indicator Evaluation Template in Table 4.4, leading indicators 1, 2, and 3 have just such a codependency that would justify the use of a composite indicator. That is, the amount of schedule margin needed for cryocooler development (Indicator 1) depends on both the amount of cost margin from other tasks that can be diverted to the cryocooler development task (Indicator 2) and the severity of the technical issues that remain to be resolved (Indicator 3). Note that a composite indicator does not necessarily collapse all the individual indicators for a risk or opportunity scenario. For example, Leading Indicator 4, which concerns GAO's evaluation of the cryocooler development progress, remains as a separate indicator for the risk of not delivering the cryocooler subsystem when required.
The following box provides an example of how one might define a composite indicator to recognize the dependencies between leading indicators 1, 2, and 3.
Table 4.12 illustrates how the Known Risk Roll-Up Template example in Table 4.7 would change as a result of using this composite indicator. Note that the Roll-Up result remains the same but there is no longer a red (intolerable) risk indicator feeding into it.
Table 4.12 Example Entries for Risk Roll-Up Template for Objective P(1) #11 Using a Composite Indicator
| Objec. No. | Objective Description | Type of Scen. | Lead. Ind. No. or Infl. Obj. No. | Description of Leading Indicator or Influencing Objective | Compoiste Indicator | Lead. Ind. Concern or Objec. Aggr. Risk | Aggregate Risk of Objective | Roll-Up Rationale |
| C (1) #12 | Provide tech. support and expert review for design, building, testing, and validation of the cryo subsystem | None | None | None | None | −1 Green Tolerable |
−1 Green Tolerable |
No risks entered |
| P (1) #11 | Deliver the cryocooler subsystem | Risk | 1 | Remaining schedule reserve for cryocooler development | CompInd(A):= − 4 × Ind(1) − 4 × Ind(2) + Ind(3) +7 | −2 Yellow Marginal |
−2 Yellow Marginal |
Although the remaining schedule reserve for the cryocooler development has been depleted, the overall risk of not meeting the objective of delivering the cryocooler subsystem is yellow (marginal) because:
|
| 2 | Remaining cost reserve for the program that can be allocated to cryocooler development | |||||||
| 3 | Severity of unresolved technical issues for cryocooler development (scale 1–5) | |||||||
| 4 | GAO evaluation of cryocooler development problems (scale 1–5, 1 = very low confidence, 5 = very high confidence) | None | −2 Yellow Marginal |
|||||
| C (1) #12 | Provide technical support and expert review for design, building, testing, and validation of cryocooler subsystem | None | −1 Green Tolerable |
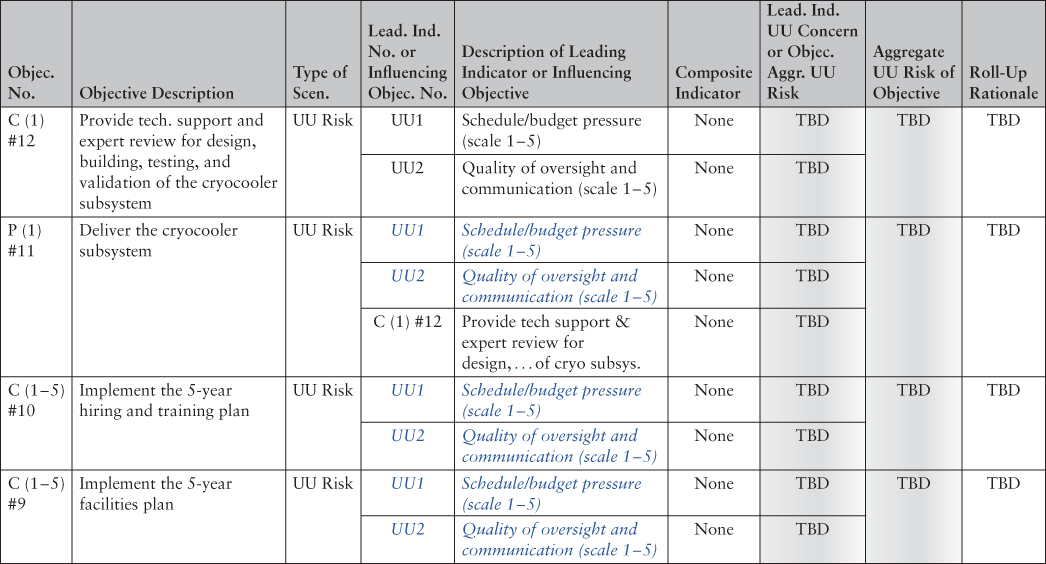
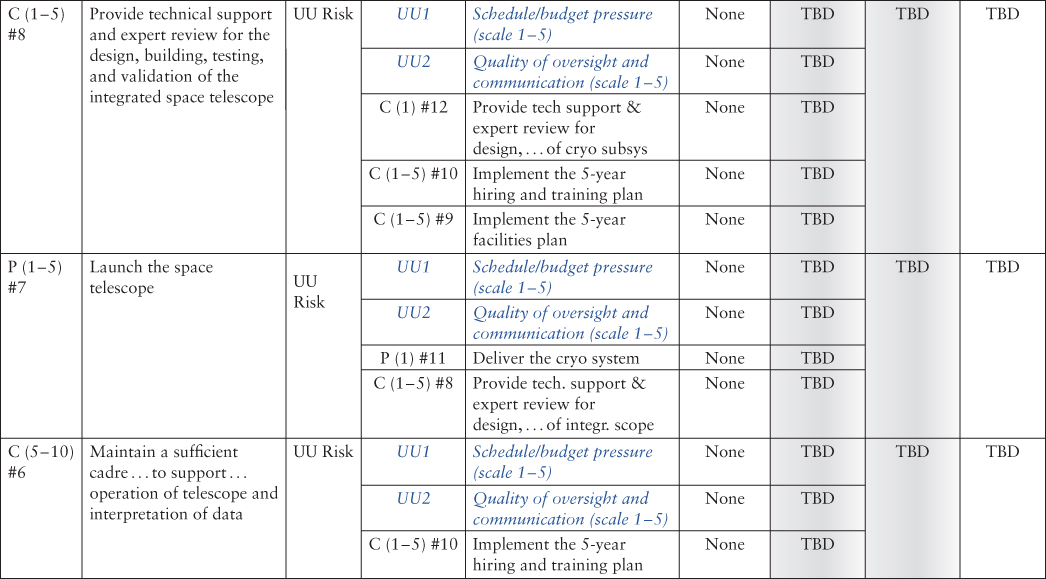
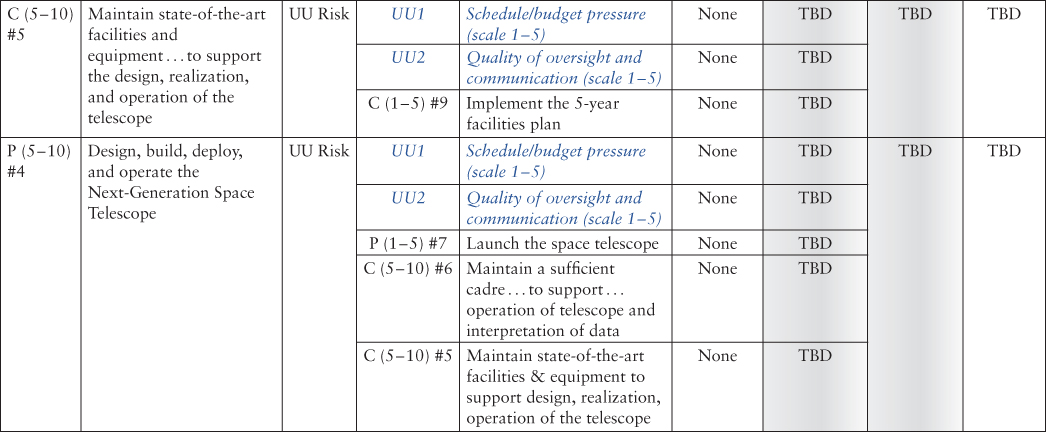
4.6.5 UU Risk Roll-Up Template
In addition to the leading indicators for known risks provided in the Risk and Opportunity Identification Template, Table 4.2, and the Leading Indicator Evaluation Template, Table 4.3, there is an additional set of leading indicators that correlate with the relative importance of UU risks. Some of the more important ones were identified in Sections 3.4.5 and 4.4.3.
Just as the known risks were rolled up via the Known Risk Roll-Up Template, Table 4.6, to obtain insight into how known risks are affecting the likelihood of being able to satisfy the top objectives of the organization, it is possible to roll up the leading indicators for UU risks via a UU Risk Roll-Up Template to obtain insight into how UU risk indicators are affecting the likelihood of successful objectives achievement. For this example, we postulate the following two UU leading indicators to be the most significant sources of UU risk:
- Schedule/budget pressure
- Quality of oversight and communication
Both indicators are measured on a scale of 1 to 5 for each objective, with the lower end indicating lowest concern and the upper end indicating highest concern. The steps in the Roll-Up are identical to Section 4.6.2. The example template is shown in Table 4.13.
Table 4.13 UU Risk Roll-Up Template
| Italic typeface denotes repeated instances of leading indicators Asterisk denotes secondary interfaces |
 |
 |
 |
 |
 |
4.7 Example Templates for the Identification of Risk and Opportunity Drivers, Responses, and Internal Controls
4.7.1 Risk and Opportunity Driver Identification Template
As discussed in Section 3.6.1, a risk driver causes the cumulative risk for one or more top organizational objectives to change color from green to yellow or red or from yellow to red. Risk factors might include any combination of departure events, underlying causes of departure events, leading indicators, unprotected key assumptions, deficiencies in internal controls, or other factors that affect the risk of meeting the objectives. Similarly, an opportunity driver can be any combination of opportunity factors/elements that collectively cause the cumulative opportunity for one or more top organizational objectives to change color. Risk or opportunity drivers, as already defined, constitute a detailed resolution of the principal factors that contribute to the cumulative risk or opportunity. They therefore are suitable for identifying the constituents of risk mitigations, opportunity actions, and internal controls.
As discussed in Section 3.6.2, a risk or opportunity scenario driver is any combination of risk or opportunity scenarios that cause the cumulative risk or opportunity of one or more top objectives to change color. Risk and opportunity scenario drivers provide a higher-level view of the concerns that need to be addressed, and are therefore suitable for summary presentations.
The Risk and Opportunity Driver Identification Templates facilitate the process of identifying both drivers (henceforth called constituent drivers for clarity) and scenario drivers. Table 4.14 illustrates the process schematically for the next-generation space telescope example. A table similar to Table 4.14 is prepared for each strategic/top objective of the organization.
Table 4.14 Example Risk and Opportunity Driver Identification Template
| Objec. Index | Objective Description | Objective Cumulative Level of Concern or Interest | Candidate Scenario Driver Number | Scenario Number(s) | Candidate Scenario Driver Description | Objec. Level of Concern or Interest if Candidate Driver Is Removed | Qualify as Driver? | Time-frame to Complete Response | Driver Consti-tuent Number | Driver Constituent Description | Time-frame to Begin Response |
| E (>1) #1 | Discover how the universe works, explore how it began and evolved, and search for life on planets around other stars | −2 Yellow Marginal Risk |
1 | 1 | Failure to complete the cryocooler subsystem on time | Remains −2 Yellow Marginal |
No | ||||
| 2 | 2 | Unavailability of expert technical staff for review | Remains −2 Yellow Marginal |
No | |||||||
| 3 | 1 and 2 | Failure to deliver the cryocooler subsystem on time and unavailability of expert technical staff for review | Changes to −1 Green Tolerable |
Yes | 6 Months | 1 | Cryo delivery schedule reserve | Now | |||
| 2 | Subcontractor mgmt. issues | Now | |||||||||
| 3 | Compressor performance for brazed unit | Now | |||||||||
| 4 | Thermal vac. testing of cold head assy | Now | |||||||||
| 5 | Cross-project competition for qualified review personnel | Now | |||||||||
| +3 Blue Significant Opportunity |
4 | 3 | Commitment to develop new IR camera and demonstrate ability to conduct retrofit mission | Becomes +1 Beige Insignificant |
Yes | 5 Years | 6 | TRL for IR camera | 1 Year | ||
| 7 | Readiness of SLS/Orion docking capability | 2 Years | |||||||||
| 8 | Predicted P(LOC) for SLS/Orion | 2 Years | |||||||||
| 9 | Predicted cost for rendezvous mission | 2 Years | |||||||||
| 10 | Congress may cancel or defer other SLS/Orion missions | Now | |||||||||
In Table 4.14, two risk scenarios are identified as candidate risk scenario drivers for the objective “Discover how the universe works” The first is “Failure to deliver the cryocooler subsystem on time,” a scenario that most directly affects the lower-level objective of delivering the cryocooler subsystem but also propagates up through the Known Risk Roll-Up Template to the top objective. The second is “Unavailability of expert technical staff for review.” This second risk scenario was not included in the earlier development of risks for this example, but is added here to make a point.
As shown in Table 4.14, neither of the risk scenarios causes the color of the cumulative risk for the top objective to change from yellow to green, but the combination of the two scenarios does.
Therefore, the risk scenario driver consists of the combination of the scenarios. The associated risk driver constituents, or principal factors that contribute to the cumulative risk, are shown in the next-to-last column of Table 4.14. They are the factors that are noted in the Known or UU Risk Roll-Up Template as being of particular concern, such that all of them have to be addressed in order for the cumulative risk to be reduced to a tolerable state.
It may be noted that although there are no UU risks included in this example for identifying risk drivers, there is no reason why they should not be included if the UU Roll-Up Template shows that they are a large source of concern.
The lower part of Table 4.14 concerns the identification of opportunity drivers. In this example there is only one opportunity scenario, and it is a driver because the deletion of the scenario causes the color of the cumulative opportunity for the top objective to change from blue (significant) to beige (insignificant). The associated opportunity driver constituents, shown in the next-to-last column, are the factors that are noted in the Opportunity Roll-Up Template as being of particular concern.
Also indicated in the Risk and Opportunity Driver Identification Template is the spare time available to initiate a response to mitigate the risk drivers or an action to avail the opportunity drivers without exceeding the available time frame to complete the response. The combination of the identified driver scenarios, the driver identified constituents, and the time frame available to begin a response for each constituent can be illustrated in a matrix format, as shown in Figures 4.13 and 4.14. This form of display is particularly useful for high-level presentations.
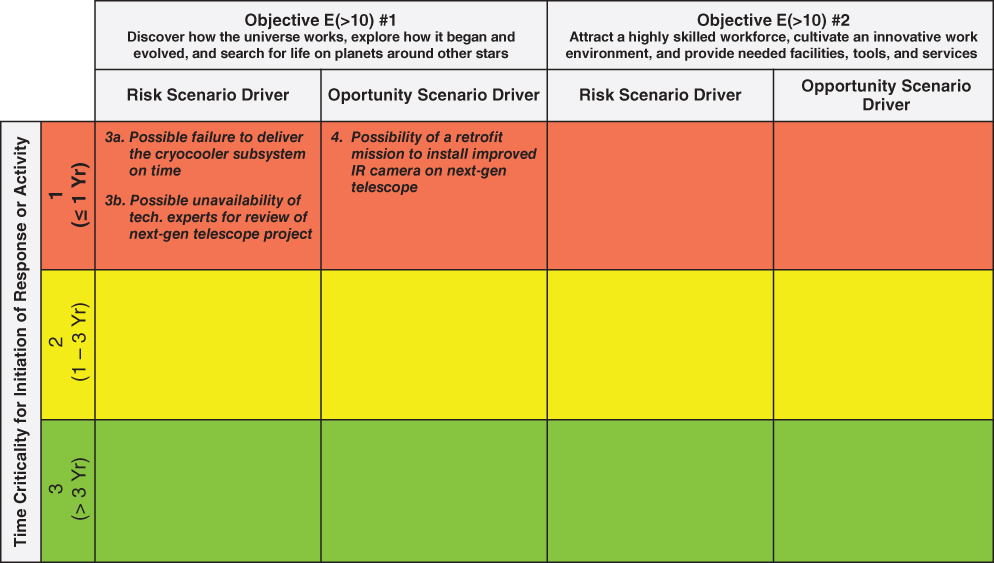
Figure 4.13 Illustration of risk and opportunity scenario drivers and their time-frame criticalities

Figure 4.14 Illustration of risk and opportunity constituent drivers and their time-frame criticalities
4.7.2 Risk and Opportunity Scenario Likelihood and Impact Evaluation Template
As discussed in Sections 2.5.3 and 2.5.4, the likelihoods and impacts of individual risk and opportunity scenarios need to be assessed separately by virtue of the latest draft of OMB Circular A-123. In Section 3.6.3, a ranking scheme of high, medium, and low was presented for likelihoods based on the decision maker's risk tolerance and opportunity appetite, and for impacts based on the identification of risk and opportunity scenario drivers. Suggested ranking criteria were depicted in Tables 3.3 and 3.4. The Risk and Opportunity Scenario Likelihood and Impact Evaluation Template in Table 4.15 provides a means for actualizing the approach in Sections 2.5.3, 2.5.4, and 3.6.3.

Table 4.15 Example Entries for Risk and Opportunity Scenario Likelihood and Impact Evaluation Template
4.7.3 Risk Mitigation, Opportunity Action, and Internal Control Identification Templates
As discussed in Section 3.6.4, the identification of risk mitigations, opportunity actions, and internal controls is directed at finding viable ways to act on the risk and opportunity drivers that are identified after the risk and opportunity roll-up processes. This identification is performed on the Risk Mitigation and Internal Control Identification Template, demonstrated in Table 4.16 for the next-generation space telescope example, and on the Opportunity Action and Internal Control Identification Template, demonstrated in Table 4.17 for the same example. The former starts from the risk drivers and the latter from the opportunity drivers that were identified in the Risk and Opportunity Driver Identification Template, Table 4.14.
Table 4.16 Example Entries for Risk Mitigation and Internal Control Template for Objective E (>10) #1: Discover How the Universe Works
| Top Objec. Index | Top Objec. Descrip. | Risk to Objective (Level of Concern) | Risk to Objec. if Driver Removed | Driver/ Constituent No. | Driver Constituent Type | Driver Constituent Description | Proposed Mitigations | Rationale for Proposed Mitigations | Internal Control No. | Type of Control | Deficiency Needing Control or Assumption Needing Watchfulness | Proposed Internal Control |
| E (>10) #1 | Discover how the universe works, explore how it began and evolved, and search for life on planets around other stars | −2 Yellow Marginal Risk |
−1 Green Tolerable Risk |
3 / 1 | Risk | Cryo delivery schedule reserve | Borrow personnel from Task X | Task X has a larger schedule reserve than needed | 1 | Assumption | Personnel that can be transferred from Task X to cryo task are available and have applicable skills | Monitoring of Task X schedule and cost reserve assigned with responsibility to report status |
| 2 | Assumption | Appropriate person has authority to move personnel between tasks | Responsibility to shift personnel assigned to a manager who has authority over both tasks | |||||||||
| If necessary, approve overtime | Cryo devel. task has adequate cost reserve | 3 | Assumption | Appropriate person has authority to approve overtime | Process for elevating overtime decision to the proper level | |||||||
| 3 / 2 | Risk | Subcontractor management issues | Strengthen subcontractor management team | GAO evaluation | 4 | Deficiency | Acquirer's expectations not met | Process for acquirer to review qualifications and concur with subcontr. management choices | ||||
| 5 | Deficiency | Provider not motivated to provide best management team | Penalites for underperformance | |||||||||
| Increase oversight of subcontractor | GAO evaluation | 6 | Deficiency | Spotty and irregular communications | Regularly scheduled meetings and progress reports | |||||||
| 7 | Deficiency | Action items not properly tracked and resolved | Process for assigning action items and monitoring progress | |||||||||
| 3 / 3 | Risk | Compressor performance for brazed unit | Add tests with modified brazing of compressor to platform | Brazing is a design reqt., and present brazing has not yet performed to spec. | 8 | Assumption | Needed test facility is available for the amount of time required | Process for elevating facility allocation decision to the proper level | ||||
| 3 / 4 | Risk | Thermal vac. testing of cold head assy. | Add thermal vac. testing of cold head assy. using replacement valves | Replacement valves have not yet been tested | 9 | Assumption | Needed test facility is available for the amount of time required | Process for elevating facility allocation decision to the proper level | ||||
| 3 / 5 | Risk | Cross-project competition for qualified review personnel | Establish project review priority | Project with highest impact on top objective should have highest review priority | 10 | Assumption | Appropriate person has authority to assign qualified review personnel to highest priority task | Responsibility to assign personnel to a manager who has authority over competing projects |
Table 4.17 Example Entries for Opportunity Action and Internal Control Template for Objective E (>10) #1: Discover How the Universe Works
| Top Objec. Index | Top Objec. Descrip. | Opportunity (Level of Interest) | Opportunity if Driver Removed | Driver Constituent No. | Driver Constituent Type | Driver Constituent Description | Proposed Actions | Rationale for Proposed Actions | Internal Control No. | Type of Control | Deficiency Needing Control or Assumption Needing Watchfulness | Proposed Internal Control |
| E (>10) #1 | Discover how the universe works, explore how it began and evolved, and search for life on planets around other stars | +3 Blue Significant Opportunity |
+1 Beige Insignificant Opportunity |
4 / 6 | Opp. | Technical Readiness Level for new IR camera | Increase priority of new IR camera R&D | Scientific value as described below | 1 | Assumption | TRL progress is being tracked and reported | Protocol for tracking and reporting on IR camera TRL progress |
| 4 / 7 | Opp. | Readiness to launch a crewed mission to retrofit the space telescope with a new high-resolution IR camera | Increase priority of SLS/Orion usage for a space telescope retrofit mission | Camera replacement will greatly improve the mission's scientific value such as increasing the likelihood of understanding dark matter and energy | 2 | Assumption | Early success of space telescope will increase public support for improving its capability when new technology becomes available | Extremely high quality control and qualification testing to ensure that the telescope has no flaws at the time of launch that would degrade its scientific value | ||||
| 3 | Assumption | The economic recovery will increase the willingness of the country to spend more on space | Provisions to factor trends in economic conditions and public sentiment into planning for upgrades to the space telescope | |||||||||
| 4 / 8 | Intr. Risk | P(LOC) during retrofit mission exceeding P(LOC) threshold | None | None | 4 | Assumption | A rigorous probabilistic risk assessment of the retrofit mission will be performed | Provisions to ensure that adequate funding will be available to perform a rigorous PRA | ||||
| 5 | Assumption | P(LOC) reserve for unknown and under appreciated (UU) risks will be sufficient to avoid significant P(LOC) underestimation | Protocol for ensuring that P(LOC) reserves are consistent with prior experience pertaining to UU risks | |||||||||
| 4 / 9 | Intr. Risk | Cost of retrofit mission | None | None | 6 | Assumption | Cost reserve for UU risks will be sufficient to avoid significant cost underestimation | Protocol for ensuring that cost reserves are consistent with prior experience pertaining to UU risks | ||||
| 4 / 10 | Intr. Risk | Increased priority on space telescope retrofit could result in other SLS/Orion applications being canceled/ deferred | None | None | 7 | Assumption | Congress and the public are aware of the benefits of all the SLS/Orion planned projects | Provisions for educating Congress and the public about the benefits of all the SLS/Orion planned projects |
For each risk or opportunity driver, there are one or more proposed mitigations or actions intended to respond to the driver, and for each mitigation or action, there are one or more internal controls intended to provide assurance of success. The internal control is labeled “Assumption” if the intent is to protect an assumption made in defining the mitigation or action, and “Deficiency” if the intent is to address a shortcoming in the present internal controls. These proposed mitigations, actions, and controls are purely hypothetical and intended for illustration purposes only.
4.7.4 High-Level Display Template
The High-Level Display Template, shown in Table 4.18, displays results obtained from the preceding templates in a condensed form. It also includes suggested responses and internal controls that address the risk and opportunity drivers. The entries that are completed in Table 4.18 correspond to those presented in Tables 4.7 and 4.10 and in Tables 4.16 and 4.17.
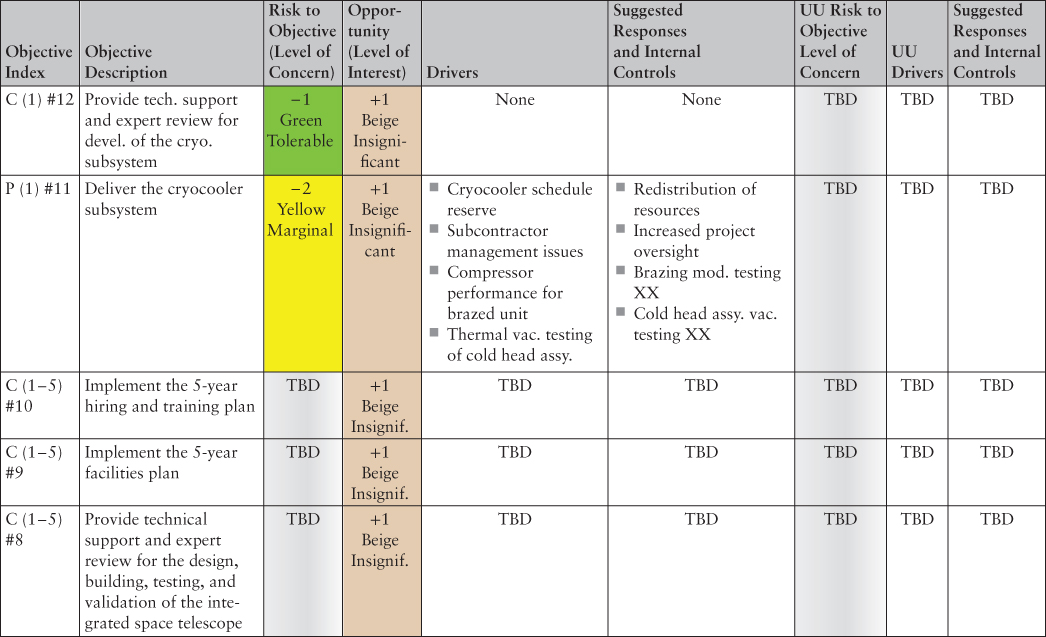


Table 4.18 High-Level Display Template
4.8 Upward Propagation of Templates for Full-Scope EROM Applications
4.8.1 Scope of the Problem
The demonstration in the preceding sections was of limited scope, involving only 12 objectives, of which two were strategic objectives with time frames greater than 10 years, four were top programmatic and mission support objectives with time frames of 5 to 10 years, four were mid-term performance objectives with time frames of 1 to 5 years, and two were short-term performance objectives with time frames of less than or equal to 1 year. Comparatively, this represents a very small sampling of all the objectives that NASA has listed in its 2014 Strategic Plan and its 2015 Performance and Management Plan, including 15 strategic objectives and hundreds of medium-term and short-term performance objectives. For an undertaking of this size, the volume of information to be collected, encoded, and integrated is challenging, to say the least.
4.8.2 Propagation of Templates
The development and population of templates for a full-scope EROM effort involves collaborative participation of all the organizational units in the enterprise, from the bottom to the top. Each unit should have its own objectives hierarchy, individual risks, individual opportunities, and leading indicators. Each should complete the templates described in this book in a consistent manner, as shown in Figure 4.15, and pass the completed templates on to the next level of authority in the organization. Each higher level in the organization should utilize the templates provided by the organizations subordinate to it to create its own set of templates. Cross-organizational communication (vertically and horizontally) should freely occur during this process so that the templates produced by any one organizational unit are complete and consistent with those produced by other interfacing organizational units.
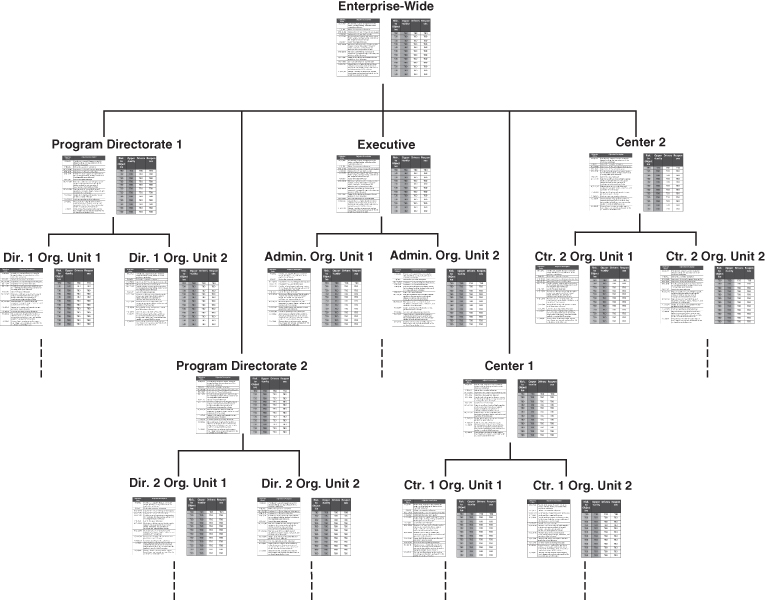
Figure 4.15 Schematic showing the upward propagation of templates for full-scope EROM applications
Obviously, this process requires that all organizational units use the same format in preparing their templates. Using the same format ensures that the information gleaned from the analysis can be passed readily up the chain of authority. It does not mean, however, that the information provided in the templates should be constrained to only risks and opportunities that are already recognized by others. Rather, each organizational unit should be creative in determining the risks and opportunities that influence the likelihood of success in meeting its objectives.
After receiving templates from its subordinate organizational units, the organizational unit at the next level up should determine whether the completed templates it receives are consistent in terms of assumptions made, the interpretation of input information, recognition of important interfaces, and overall conclusions. If there are inconsistencies or misunderstandings in these areas, then the higher-level unit has the obligation of determining why that is the case and how to resolve them.
The highest level of analysis in the EROM analysis scheme is the enterprise-wide level, as illustrated in Figure 4.15. The templates at enterprise-wide level represent a compilation of the templates from all the entities in the organization. Any differences between organizational units in terms of assumptions, interfaces, interpretations, and conclusions should be resolved at the enterprise-wide level. Once completed, the enterprise-wide level templates are passed back down the organizational chain of authority so that the individual organizational units can review them and provide their assent or dissent.
4.8.3 Development of an Integrated EROM Database
The templates prepared by the various units become part of an integrated database. Databases of risks, opportunities, and leading indicators that exist at each unit in the organization are integrated upward first to program directorate, center, and executive levels, and then into an enterprise-wide integrated database. At the extended enterprise level, the integrated database should typically include the information in the risk and opportunity templates, the owner for each risk and opportunity, the organizational entities that are involved, corresponding working groups and management boards, change plans, change history, and status. The development of an enterprise-wide database helps to ensure that cross-cutting risks and opportunities are correctly identified, consistently analyzed, and treated in an integrated manner. It also helps to facilitate the process of rolling up individual risk and opportunity scenarios from lower levels to an aggregate view of the organization's overall likelihood of success in meeting its strategic objectives.
A later section will discuss the challenges of creating and managing a database that integrates risk and opportunity information vertically and horizontally across an extended enterprise consisting of both internal organizational entities and external partners. It will also discuss some best practices for doing so.7
4.9 Application of the Templates to Organizational Planning and the Selection from among Alternative Candidate Portfolios
The templates developed in the preceding subsections can be applied, with some modification to the inputs, to examine EROM's role in organizational strategic and performance planning. In this application, the organization is interested in examining its likelihood of success in meeting its top objectives for various candidate sets of programs, projects, activities, and initiatives that are in the conceptual stage. There may be no detailed designs and likewise no direct experience in the development, fabrication, testing, deployment, and operation of the systems that would eventually unfold.
The form of the templates for organizational planning can be the same as the form of the templates for the evaluation of organizational performance, but the entries into the templates would need to be different in the following ways:
- Any risks, opportunities, leading indicators, and associated trigger values would have to be inferred from historical experience with related systems and from the judgment of those who are expert in the missions to be pursued and the challenges they bring, rather than from real-time experience with the actual systems to be used.
- Short-term objectives (e.g., those with time frames of a year or less) in most cases would not be applicable since they tend to relate to milestones that emanate from a well-defined design.
Consider, for example, what would be included in the entries to the templates if the JWST project was in a conceptual stage and had not yet been initiated. The JWST challenges highlighted in the GAO report and other sources mentioned in Section 4.2 would not yet have been identified. The principal information for identifying risks and opportunities for a next-generation space telescope would be from the experience gained for the HST system, which would already have been launched and operating. The risks in Table 4.2 associated with development and delivery of the cryocooler subsystem would probably not appear in the Risk and Opportunity Identification Template, because the design of the next-generation telescope would probably not yet be known in enough detail to identify that the cryocooler subsystem had to be completely unlike previous cryocooler subsystems. The potential status of leading indicators associated with shortages in cost and schedule reserves would have to be inferred without any direct information from the JWST project, but rather, from HST experience and from the anticipated overall complexity of the next-generation mission.
In accordance with these observations, Table 4.19 shows how the entries in the Risk and Opportunity Roll-Up Template might appear if the next-generation telescope was being considered for inclusion in the agency's portfolio but was not yet past the concept stage. Those entries associated with the short-term (1-year) objectives relating to the cryocooler subsystem are no longer present, and the ones associated with cost and schedule reserves for the system as a whole are based on inference from the HST project (see highlighted entries in Table 4.19).
Table 4.19 Example Risk Roll-Up Template for the Next-Generation Space Telescope as Applied to Alternative Selection during Organizational Planning
| Italic denotes repeated instances of leading indicators Asterisk denotes secondary interfaces Bold/enlarged denotes Hubble precedent |
 |
 |
 |
 |
The other templates presented in Tables 4.2 through 4.18 would similarly be modified.
Notes
References
- Foust, Jeff. 2014. “NASA Facing New Space Science Cuts.” (May 31). http://news.nationalgeographic.com/news/2014/05/140530-space-politics-planetary-science-funding-exploration/
- Government Accountability Office (GAO). 2014b. GAO-15-100, Report to Congressional Committees, “James Webb Space Telescope: Project Facing Increased Schedule Risk with Significant Work Remaining.” Washington, DC. Government Accountability Office (December). http://www.gao.gov/assets/670/667526.pdf
- Harwood, William. 2009. “The History of Hubble: A Grand Space Telescope.” SpaceflightNow.com (May 9).
- HubbleSite.org, 2016. “Team Hubble: Servicing Missions.” http://hubblesite.org/the_telescope/team_hubble/servicing_missions.php
- Leone, Dan. 2014. “Manufacturing Issues Plague James Webb Space Telescope.” SpaceNews (November 14).
- National Aeronautics and Space Administration (NASA). 2009. “Hubble Space Telescope Servicing Mission 4.” http://www.nasa.gov/mission_pages/hubble/servicing/SM4/main/Summary_FS_HTML.html
- National Aeronautics and Space Administration (NASA). 2014c. FY 2014 Annual Performance Report and FY 2016 Annual Performance Plan. Washington, DC. National Aeronautics Space Administration, http://www.nasa.gov/sites/default/files/atoms/files/fy14_apr-fy16_app.pdf
- National Aeronautics and Space Administration (NASA). 2016b. “Explore James Webb Space Telescope.” www.jwst.nasa.gov