
Chapter 6
Special Considerations for EROM Practice and Analysis at Commercial TRIO Enterprises
6.1 Overview
The bulk of the discussions so far have focused on TRIO enterprises whose primary objectives concern the development and implementation of risky technologies aimed at scientific advancement for the benefit of the public. These enterprises tend to be government or nonprofit organizations. However, as discussed several times in earlier chapters, many of these government and nonprofit enterprises rely heavily on commercial partners, who often play the role of a prime contractor. Others take the role of subcontractors under the direction of a prime contractor, or under contract directly to the government or a nonprofit sponsoring organization. Thus, it is obviously in the interest of both the noncommercial and commercial enterprises to form EROM alliances and foster consistencies of approach that work for both.
The top objective of TRIO enterprises that operate for profit is ultimately to provide monetary gain for their companies and their shareholders. Like the objectives of a public enterprise, the financial objectives of a commercial TRIO enterprise involve short-term, mid-term, and long-term goals. The shorter-term financial objectives satisfy the more immediate needs of the shareholders, whereas the longer-term ones help ensure the viability of the company. Unlike noncommercial enterprises, however, the implementation of technical research, integration, and operations for commercial enterprises serves as means objectives rather than as a fundamental objective. The fundamental objective is financial gain.
Thus, a distinguishing feature of commercial TRIO enterprises, compared to noncommercial ones, is that their performance is evaluated in terms of quantitative measures such as dollars, rather than qualitative measures such as understanding the universe in which we live. At the same time, however, the risks and opportunities that affect the likelihood of future success for commercial TRIO enterprises tend to be qualitative, similar to those that affect noncommercial TRIO enterprises. For example, risk issues such as recurrent management problems are fundamentally qualitative in nature (i.e., management performance may be rated on a qualitative scale such as excellent, good, fair, or poor), but their ultimate effect on a company's financial state is quantitatively measurable. This implies that the qualitative methods described in earlier chapters for analyzing risks and opportunities carry over to the commercial sector, but they have to be integrated with quantitative models for assessing the present and potential future states of the financial objectives of the organization.
This quantitative-qualitative duality is illustrated in Figure 6.1. The figure shows how the qualitative processes developed earlier, as exemplified by the templates in Chapter 4, act synergistically with the quantitative modeling needed for financial evaluation. For example:

Figure 6.1 Integration of qualitative and quantitative modeling to evaluate the likelihood of success of a commercial TRIO enterprise
- The treatment of risk and opportunity scenarios in the financial model is informed by the risk and opportunity scenarios developed in the templates.
- The key variables in the financial model are informed by the leading indicators and risk/opportunity drivers identified in the templates.
- The functional relationships between financial outcomes and key variables in the financial model are informed by the watch and response trigger values developed in the templates.
- The aggregation of financial factors in the financial model to evaluate cumulative monetary gain or loss is informed by the risk and opportunity aggregation rationale developed in the templates.
The feedback loop works in the other direction as well:
- Predicted values of financial gain or loss obtained from the results of the financial modeling can be used as leading indicators in the qualitative analysis.
- Modeling assumptions used in the financial quantitative analysis can help define the assumptions needing to be watched or controlled through internal controls.
Because of the fact that there may be large epistemic uncertainties (stemming mainly from incomplete knowledge) in the inputs to the quantitative models and in the models themselves, the quantitative assessment is often performed using different sets of assumptions. In many assessments, three different calculations referred to as (1) optimistic, (2) most likely, and (3) pessimistic are performed, as shown in Figure 6.1. In other assessments, referred to generally as Monte Carlo assessments, thousands of mechanized calculations are performed to explore the effects of different parameter choices and/or modeling choices over their ranges of uncertainty on the financial model results. Monte Carlo assessment results are often presented in terms of mean values and values at different confidence levels (e.g., 5%, 50%, and 95%).
The following subsections discuss the nature of the risks, opportunities, and leading indicators that attend commercial TRIO enterprises and the ways in which the EROM templates described earlier can be applied along with quantitative modeling to evaluate the cumulative financial risks and opportunities, identify the risk and opportunity drivers, and deduce strategies for risk mitigation, opportunity action, and internal control.
6.2 Risk and Opportunity Scenarios and Leading Indicators
6.2.1 Risk and Opportunity Taxonomies
The risks and opportunities that commercial TRIO enterprises face are as numerous and as diverse as those faced by noncommercial TRIO enterprises, if not more so. To illustrate, Figures 6.2 and 6.3, respectively, depict example taxonomies of enterprise risks and opportunities that might apply to a representative large commercial TRIO enterprise that serves as a prime contractor on large projects for commercial and noncommercial customers. Note that the diversity of second-level subcategories in Figures 6.2 and 6.3 is comparable to that in Figure 3-7.

Figure 6.2 Example enterprise risk taxonomy for a commercial TRIO enterprise

Figure 6.3 Example opportunity taxonomy for a commercial TRIO enterprise
The specific categories contained within the taxonomies would generally be different for different kinds of companies.
6.2.2 Risk and Opportunity Branching Events and Scenario Event Diagrams
In addition to the many categories of risk and opportunity they encounter, commercial TRIO enterprises often have to make rapid tactical management decisions on risks and opportunities to keep pace with changing conditions in the marketplace. For example, pricing decisions may have to be made quickly if a key competitor suddenly lowers their prices. The decision options appear as a branching event in the risk scenario. If management decides to lower its prices to compete with its competitor, its financial risk will be different from what it would be if it decides not to. In the near term there may be an increased risk of reduced profits, but in the longer term the overall financial risk may be lower.
Thus, for commercial TRIO enterprises, it is often advisable to generalize the risk and opportunity scenario statements discussed in Section 3.4.2 to include risk and opportunity scenario event diagrams. A simplified example of a scenario statement augmented by a scenario event diagram is shown in Figure 6.4. In this example, a prime contractor (named Company XYZ) that manufactures products and develops systems for the aerospace and defense industries identifies, as a risk, that a competitor might start a new manufacturing company, intending to take market share from some of the key areas now served by XYZ. To compete, XYZ determines that it would have to either lower its prices in those markets or abandon the markets altogether. Either choice could result in significant loss of revenue in the near- and mid-terms (e.g., one to three years). The scenario event diagram depicts these choices and identifies the financial consequences.

Figure 6.4 Example risk scenario statement and scenario event diagram for a risk in the taxonomic category “Competition from other companies”
Similarly, Figure 6.5 depicts a risk scenario statement and accompanying scenario event diagram that pertains to the prime contractor for the next generation space telescope. This example, as it was developed in Chapter 4 from the point of view of the integrating government agency, identified schedule risks in the cryocooler subsystem development task that were exacerbated by management issues. From the viewpoint of the prime contractor, the most attractive solution is to move the project manager of another project (Project AA) to head the cryocooler development task in the space telescope project. But while reducing the risk of further missed milestones in the space telescope project, the proposed solution increases the risk of delays and added costs for Project AA. The possible consequences of making such a move involve lost revenue in the near term and lost customers in the long term. The latter leads to monetary loss in the long term. These choices and consequences are depicted in the scenario event diagram.

Figure 6.5 Example risk scenario statement and scenario event diagram for a risk in the taxonomic category “Customer satisfaction”
Other risks and opportunities that might be of concern to Company XYZ and the accompanying scenario event diagrams are illustrated in Figures 6.6 through 6.11.

Figure 6.6 Example risk scenario statement and scenario event diagram for a risk in the taxonomic category “Leadership mortality and succession issues”

Figure 6.7 Example risk scenario statement and scenario event diagram for a risk in the taxonomic category “Accident causing human deaths”

Figure 6.8 Example risk scenario statement and scenario event diagram for a risk in the taxonomic category “Changes in foreign exchange rates and interest rates”
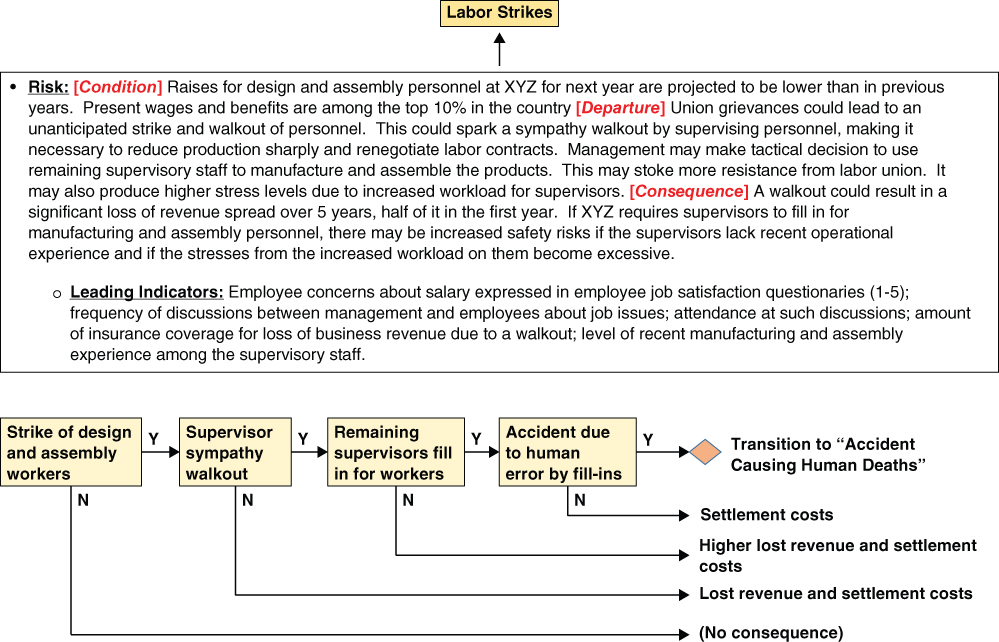
Figure 6.9 Example risk scenario statement and scenario event diagram for a risk in the taxonomic category “Labor strikes”
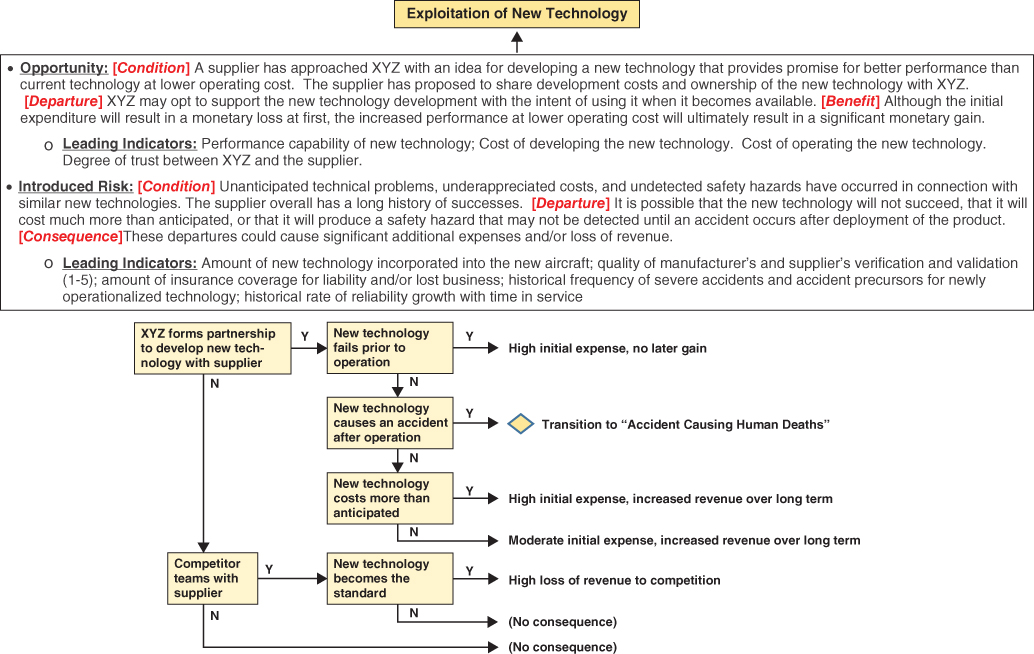
Figure 6.10 Example risk scenario statement and scenario event diagram for a risk in the taxonomic category “Exploitation of new technology”

Figure 6.11 Example risk scenario statement and scenario event diagram for a risk in the taxonomic category “Act of terror”
6.2.3 Risk and Opportunity Templates
The evaluation of risks and opportunities at the pathway level, the scenario level, and the financial objective level can be qualitatively addressed by utilizing templates similar to those developed in Chapters 4 and 5. For purposes of these templates, each path that leads to a consequence is treated as though it were an individual scenario. Tables 6.1 and 6.2 illustrate, in abbreviated form, what the risk and opportunity identification and evaluation templates and the risk and opportunity roll-up templates of Chapter 4 might look like for the XYZ Company. As shown, the results start with a qualitative assessment of the degree of concern or interest associated with each leading indicator (Table 6.1), continue with the degree of concern or interest associated with each pathway through each scenario event diagram (Table 6.2 middle column), and end with the overall cumulative degree of concern or interest pertaining to the company's ability to meet its financial objectives rolled up over all pathways and scenarios (Table 6.2 right-hand-side).
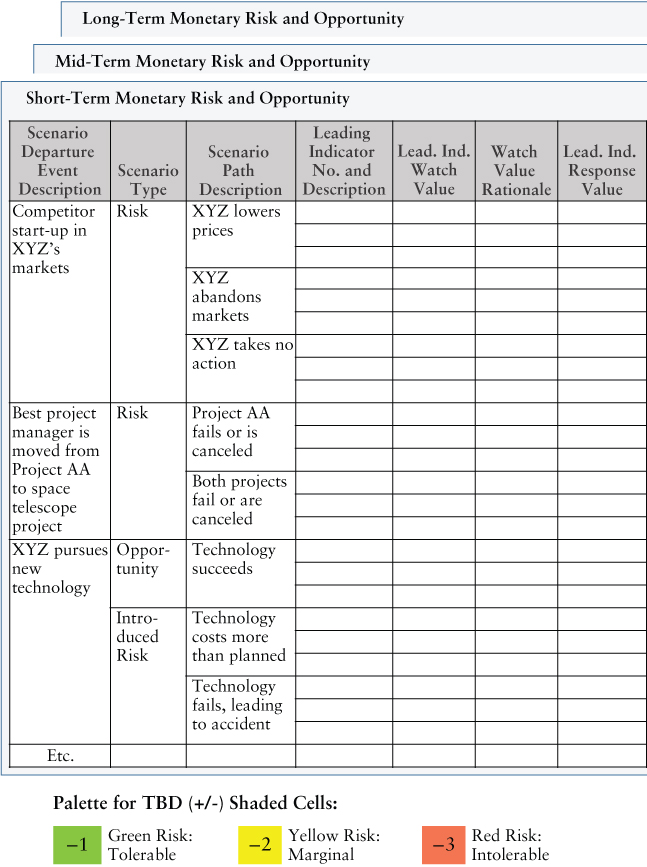
Table 6.1 Form of the Risk and Opportunity Identification and Evaluation Templates (Combined) for the Commercial TRIO Enterprise Example
 |
 |
When the objective being evaluated is monetary, each pathway in a scenario event diagram can also be evaluated quantitatively. The results of the quantitative analysis include an assessment of the likelihood of each pathway, often using event tree/fault tree techniques, and an assessment of the financial consequence of each pathway using financial models. As mentioned in Section 6.1, the qualitative results should be consistent with the quantitative results because the rationale used to obtain the former is carried over into the rationale used to obtain the latter (and vice versa).
Table 6.3 introduces a template designed to verify consistency between the qualitative and quantitative assessments. Referred to as the Risk and Opportunity Roll-Up Comparison Template, it displays the results obtained from the qualitative and quantitative approaches at each stage of the roll-up. The qualitative results are depicted as “levels of concern” for risk scenarios and “levels of interest” for opportunity scenarios, and utilize the same color coding that was introduced in Chapter 4. Three sets of quantitative results are listed in this template and are labeled “optimistic,” “most likely,” and “pessimistic.” If a Monte Carlo approach were to be used wherein the calculations would be performed in combination with a rigorous sampling process, the different sets of results obtained could then be associated with confidence levels (e.g., 5%, 50%, and 95%) rather than qualitative indicators such as “optimistic,” “most likely,” and “pessimistic.”
Table 6.2 Form of the Risk and Opportunity Roll-Up Templates (Combined) for the Commercial TRIO Enterprise Example
 |
 |
Table 6.3 Qualitative/Quantitative Risk and Opportunity Roll-Up Comparison Template for the Commercial TRIO Enterprise Example (Excerpt)
 |
 |
6.2.4 Risk and Opportunity Matrices
Traditionally, rankings of individual risk scenarios have been an important part of risk management at the program/project level. The most commonly used display format for these rankings has been a 5 × 5 matrix, in which likelihood or probability, ranked on a scale of 1 to 5, comprises the rows in the matrix, and impact or consequence, similarly ranked on a scale of 1 to 5, comprises the columns. This type of display works well for enterprise risks and opportunities where the top-level objectives are monetary, since the measure of each objective is quantitative and interpreted consistently across objectives. It works less well when the top-level objectives are qualitative.
For enterprise risk and opportunity management, where risk and opportunity share complementary status, it is useful to include both risk and opportunity on separate mirror matrices, as shown conceptually in Figure 6.12. In that figure, each X represents a risk or opportunity scenario. The numbering of the cells from 1 to 25 provides the basis for rank-ordering the importance of each scenario. For example, the X in cell number 25 on the risk matrix is judged to be more important than any of the other risk or opportunity scenarios denoted by X's in the figure.

Figure 6.12 Example risk and opportunity matrix for quantitative financial objectives
When the top objectives are monetary, as for a commercial TRIO enterprise, the meanings of the 1-to-5 rankings in Figure 6.12 are easy to interpret both qualitatively and quantitatively. Qualitatively, a ranking of 1, 2, 3, 4, or 5 translates to an assessment of “very low,” “low,” “moderate,” high,” or “very high,” respectively. Quantitatively, the measures of 1-to-5 for likelihood and 1-to-5 for impact basically reflect the judgment of the decision maker(s) as to what constitutes “very low,” “low,” “moderate,” “high,” and “very high” for the objective being considered. They may therefore vary from objective to objective. For example, the decision maker's judgment about what constitutes “very high” monetary gain in the near-term may be very different than for long-term monetary gain.
A risk and opportunity matrix can be used as a mapping device for the likelihood and impact of each risk and opportunity scenario pathway developed in a scenario event diagram. The quantitative results recorded in the Risk and Opportunity Roll-Up Comparison Template (Table 6.3) can be used for this purpose. Illustrations of such mappings are provided in Figure 6.13 for a risk scenario and in Figure 6.14 for an opportunity scenario.

Figure 6.13 Example risk scenario statement, scenario event diagram, and scenario matrix for a risk in the taxonomic category “Competition from other companies”

Figure 6.14 Example risk scenario statement, scenario event diagram, and scenario matrix for a risk in the taxonomic category “Exploitation of new technology”
6.3 Controllable Drivers, Mitigations, Actions, and Internal Controls
Many of the risk and opportunity drivers for a commercial TRIO enterprise are shared with those for its noncommercial sponsors, and so it should not be surprising if the list of drivers, risk mitigations, opportunity actions, and internal controls for the former are the same as those of the latter. For example, the prime contractor for the next-generation space telescope will be just as concerned about depletions in schedule and cost reserve as the funding government agency.
In addition, however, a commercial TRIO enterprise will have many more risk and opportunity drivers that pertain to their financial well-being. Table 6.4 provides a representative list of such drivers for the XYZ Company. The term “controllable risk drivers” in the table refers to the fact that these drivers are amenable to responses such as risk mitigations, opportunity actions, and internal controls. Accordingly, an example or two of these potential responses are included in the table for each controllable driver.
Table 6.4 Example Controllable Drivers and Corresponding Existing Safeguards, Risk Mitigations, Opportunity Actions, and Internal Controls for XYZ Company
| Example Controllable Drivers | Example Existing Safeguard(s) | Example Mitigation/Action | Example Internal Control | ||||
| CD1 | Insufficient diversification of customers | ES1 | Over 500 customers served | MA1 | Close out nonprofitable contracts and market new customers | IC1 | Monitor and report on revenue status/projections for each customer and potential customer |
| CD2 | Insufficient capital funds and/or liquidity to purchase new materials and parts in an inflationary market | ES2 | Available capital funds and liquidity sufficient for current market with 10% margin | MA2 | Convert certain long-term investments to short-term investments or cash | IC2 | Develop a robust and peer reviewed investment plan and continually monitor it |
| MA3 | Merge with a competiting company (increases capital funds and/or liquidity) | IC3 | Assess and report on track record of potential companies for merging | ||||
| CD3 | Insufficient insurance to allay unusually high liability costs | ES3 | Current liability insurance covers up to $200M per incident | MA4 | Increase deductible in order to increase maximum coverage | IC4 | Continually monitor sufficiency of coverage |
| CD4 | Insufficient insurance to cover cost of loss of business | ES4 | Current loss-of-business insurance covers up to 6 months loss-of-business | MA4 | Increase deductible in order to increase maximum coverage | IC4 | Continually monitor sufficiency of coverage |
| CD5 | Inadequate market analysis of competition | ES5 | Market analysis is part of business plan | MA5 | Hire market analysts as consultants | IC5 | Assess and report on credentials and track record of candidate analysts |
| CD6 | Inadequate strategy for competing in low cost market | ES6 | Cost accounting system | MA6 | Prepare a cost-cutting plan for contingency implementation | IC6 | Vet cost-cutting plan with affected entities |
| CD7 | Insufficient public relations focus to bolster reputation in event of a crisis | ES7 ES8 ES9 |
Crisis outreach and hotline Community involvement Publicized donations to charities |
MA7 | Improve responsiveness to customers in everyday communication | IC7 | Monitor and report on customer satisfaction |
| CD8 | Lack of early discussions with labor to avert walkouts | ES10 | Current wages and benefits in top 10% of Industry | MA8 | Organize/attend social events with labor leaders | IC8 | Monitor and report on labor leader views and sentiments |
| CD9 | Inadequate problem-solving approach with labor | ES11 | Problem solving and communication training for labor relations staff | MA9 | Problem solving and communication training for managers | IC9 | Monitor and report on managers' participation in training |
| CD10 | Organization too dependent on CEO | ES12 | CEO succession plan in place | MA10 | Shift responsibilities to lower levels | IC10 | Develop processes for overseeing delegation of responsibilities and effectiveness of execution |
| CD11 | Stress levels causing human error | ES13 | Employee assistance program | MA11 | Track stress levels through employee questionnaires and reduce workload when stress is too high | IC11 | Report to upper management on stress levels and worker error incidents |
Table 6.5 shows an excerpt from a Risk Mitigation, Opportunity Action, and Internal Control Identification Template that pertains to the XYZ example. The example entries that are included in this figure pertain to the risk and opportunity scenarios that were previously presented in Figures 6.4 6.5, and 6.10. In Table 6.5, each listed driver constitutes a collection of driver constituents. None of the constituents in themselves constitutes a driver because no single constituent results in the cumulative risk or opportunity changing from one color to another. (See Section 3.6.1 for a discussion of why this criterion is one of the conditions defining the term driver.) As illustrated in the figure, it is the combination of constituents that causes the changing of the status of the cumulative risk or opportunity, as evidenced by its change of color.
Table 6.5 Excerpt of the Risk Mitigation and Internal Control Template and the Opportunity Action and Internal Control Template for the Commercial TRIO Enterprise
 |
 |