
General introduction

So it is, said the Wise Eagle, that the cure to uncertainty is transparency, and the cure to chaos is control.
Darloz
Feasibility studies that can be accessed through various sources, such as websites, and companies’ documentation show limited scope in analyzing projects that are put forth with regard to vulnerability. Yet, the notion of “vulnerability” is at the center of any project. Some authors see project vulnerability as a sensitivity to negative events that entail a difficulty in coping with them,1 thus reducing a project’s value. Others define vulnerability as the incapacity of an organization to deal with the threats it is exposed to.2 Other definitions include the following:
The characteristics and circumstances of a community, system or asset that make it susceptible to the damaging effects of a hazard. Comment: There are many aspects of vulnerability, arising from various physical, social, economic, and environmental factors.3
Examples are given thereafter, among which are (Plan and Processes) poor design and the construction of buildings; (People) lack of public awareness; (Power) deficient contingency measures, the inadequate management of assets, little concern for environmental impacts, and tainted recognition of the risks. Vulnerability is subject to the social context and time.
A model has also been offered4 whereby vulnerability is linked to exposure to hazards, which trigger a disquieting response and which have some impacts. It has been explained that “vulnerability is the degree to which a system, subsystem, or system component is likely to experience harm due to exposure to a hazard, either a perturbation or stress/stressor.”5 I pretend that vulnerability does not relate exclusively to the effects of hazards, but also to any source that can have a damaging effect, such as voluntary deceitful human interventions.
Essentially, we prefer to see vulnerability as a “potential for failure,” with this potential being augmented as the various negative forces that affect the project (hazards, human threats, etc.) become more vigorous.
I.1 Definition of vulnerability
Vulnerability: condition experienced by any of the four Ps (Plan, Processes, People, Power) of a project that make it susceptible to failure.
I derive the definition of points of vulnerability from this explanation, as follows:
I.2 Definition of points of vulnerability
Points of Vulnerability (POVs): temporal and physical points along the various stages of a project that impede on the calendar, costs, and/or quality of the project as it faces adverse conditions (negative forces), whether these conditions are under human control or not.
From this, I derive the first law of feasibility (there will be six in total), as follows:
I.3 First law of project feasibility: Law of positive and negative forces
A project is not feasible if the positive forces (which play in favor of the project, which maintain a functional g-spread6) are smaller than the negative forces (which play against the project, such as risks7).
Thus, a project8 is not feasible if [F–> F+]. When positive forces (F+) are coupled with opportunities, it provides a path for success; otherwise, mayhem is likely in sight. If not managed, POVs weaken managers’ Dominant and Contingency strategies and fuel the likelihood of them resorting to Short strategies. A Dominant strategy is one whereby the project manager has more forces going in his/her favor (positive forces F+) than against him/her (negative forces F–). A feasibility analyst would normally want to ensure that he/she examines the negative forces, whether in the form of incapacities or so-called threats that plague a project.
Table I.1 provides just a few examples of feasibility studies retrieved from the World Bank.9

I found many documents among a vast number of studies (including those from the World Bank)15 in the public and private sectors that addressed the issue of vulnerability—that of crops, not of the processes or humans in the case shown in Table I.1. The concept has been used in feasibility studies.
One project leader sees vulnerability as follows:
Before commencing a project, we at AF Thériault pose ourselves four questions:
Do we have the necessary technology?
Do we have the labor skills?
Are we underestimating the challenges? and
Are we overestimating our capabilities?
Any one of these questions point to vulnerabilities and we make a continuous effort to root out these vulnerabilities as far in advance as possible. When well assessed from this perspective by using a proactive approach, our projects benefit from better projections (planning), improved cost management if not elimination of costly issues altogether and reduction of problems down the road. Correcting vulnerabilities early on allows us to remove potential hurdles along the critical path. We also learned that when people feel more in control, they naturally try to improve, which for us, translates in highest quality effort and products. When people do their best because they feel respected and protected from vulnerabilities, they tend to do their best. We have come to realize that every one of our team members is capable of doing quality work beyond what they ever imagined.16
Roughly speaking, about 30% of projects succeed (meaning that they evolve exactly according to the initial plan),17 45% experience difficulties, and 25% derail.18 These numbers meet my estimates based on various sources, including consulting firms such as KPMG (merger of Peat Marwick International and Klynveld Main Goerdeler). Some authors mention that a third of software projects experience excess costs ranging from 150% to 200% and time overruns of 200% to 300% compared with the original schedule.19 There are notorious examples, which everyone is familiar with, such as that of the Denver International Airport’s automated baggage system that crashed on its opening day of operation. Cost overruns are no light matter: the U.S. 1983 Nunn–McCurdy Act requires the Department of Defense to report to Congress when they occur in certain projects. Average cost overruns are higher in Asia and Europe, followed by North America and to a lesser extent South America, Africa, and Oceania, perhaps reflecting the fact that projects are more complex in more advanced nations (as exemplified by the costs of projects).20 It has been stated that project overruns are common,21 and that problems arise from overcomplexity. Poor planning (Plans), lack of training (People), and poor management (Power) are also to blame.
Some authors are convinced that overruns are due to two causes22: (1) forces that are external to the project, such as community or political intervention, customer order changes, government changes, inflation, weather, and so forth; and (2) strategic miscalculations (these are internal forces). Of note, however, is that not all changes are detrimental; some can have a positive impact on a project. In the case of the QMA, as an example, a change in the surface of the exterior landing dock from concrete to partial concrete cut the project cost by C$216,000 while maintaining the integrity of the infrastructure. Epoxy was used for the terrazzo of the main passageway and granite for the main hall, saving C$2,012,500.
From my perspective, this means that at least part of overruns can be avoided by adopting a Dominant strategy during the planning stage. The other important argument here is that there are external and internal forces, and positive and negative forces that foster or sink a project. If I were to put this in a Strengths, Weaknesses, Opportunities, and Threats (SWOT) table, I would obtain the simple frame of analysis shown in Table I.2.
Positive forces | Strengths | Opportunities |
Negative forces | Vulnerabilities (weaknesses) | Risks (threats) |
The word “vulnerabilities” depicts with a greater sense of urgency the presence of weaknesses and implies a trust factor that I will methodically examine in this book (in Chapters 5 and 6 in particular). One can say that projects stand the best chance of success when strengths respond to the opportunities given that risks and vulnerabilities are kept under control, or better yet, are under control and at a minimum level of activity. In the case of the QMA, interestingly enough, there is a provision in the budget document for so-called risks and opportunities; this goes to show that opportunities exist not only in the conception/vision stage, but also during the entire project (e.g., an opportunity to improve on a design or to reduce costs). Based on my experience and after interviewing feasibility analysts, I feel indeed that the probability of the success of a project is related to strengths and opportunities, given set risks and vulnerabilities. For the same amount of risks and vulnerabilities, the project with more strengths that respond to a better opportunity is likely to have more value to a project manager than a project without such strengths and opportunities.23 This seems to make intuitive sense. On the other hand, given a set of strengths and opportunities, a project with more vulnerabilities and facing more risks is more likely to fall flat than a project with fewer risks and vulnerabilities. This, again, seems to match the natural flow of things.
As for strengths, some examples have been mentioned by various authors, such as an economically rational project with cost benefit returns, appropriate management, and a safe and ethical social and political climate.24 A fifth factor has also been added, that of the favorable corporate strategic environment.
One can impute delays, which are a sign of vulnerability, on one or more of the four P components (Plans, Processes, People, and Power) of projects.25 Delays may be due to poor planning (Plans). Examples stem from the design and conception being riddled with errors, ineffective penalties (where applicable) weighing on the system, legal disputes poisoning the atmosphere, the original schedule being too tight, or else external conditions (e.g., weather) altering the plan. Delays may also be incurred due to poor processes (Processes): changes or last-minute modifications (changes are regularly cited as one critical cause of delays), material supply difficulties, payment issues, production errors, reworking, or else accidents. Projects may suffer delays due to stakeholders’ actions (People) or a lack of proactive actions in regard to conflicts, cultural differences, inexperience, poor communication, regulators’ intervention, or else a shortage of skills. Finally, delays make for blight projects due to poor management (Power): disagreements between managers and promoters, misalignment in the line of authority, slow decision-making, supervisory inefficiencies, or else corruption.
When one looks at who is blaming who or what between consultants, contractors, equipment, external factors, promoters, teams, or plans, by far the vast majority of the blame is thrown at others, not on the machines, plans, or processes. Contractors impute their woes first to promoters then to consultants. Consultants consider that their woes are due to labor, promoters, and contractors. For all stakeholders combined, those held accountable for delays are first promoters, then contractors, then consultants, and finally labor.26
In short, the human factor is what comes out as the number one cause of delays. This points to the importance of understanding human behavior and of treating it like a mechanism (a Swiss watch of sorts) that can be decomposed into various parts—something I will do in the section dedicated to People (Chapters 5 and 6).
I.4 Three examples
Let us take three examples to support my argumentation on the four Ps (Plans, Processes, People, and Power): the 1976 MOS, the 2015 QMA briefly discussed in the preface, and the 2015 Mervel27 farm project.
I.4.1 Montréal Olympic Stadium (MOS)
On December 4, 1969, Montréal’s mayor, Mr. Jean Drapeau, officially proposed his city as a contender for the XXIst Olympic Summer Games. The International Olympic Committee (IOC) was convinced that Montréal was the best choice to host the Games, to be held from July 17 to August 1, 1976. Montréal, the financial heart of the province of Québec (Canada) was the largest French-speaking city in the world after Paris, of course. In the early 1970s, the province became the victim of bombings and kidnappings orchestrated by a small political faction in an attempt to found an independent state. The tragic sequence of violence produced zero heroes. The city and the province probably needed to restore their image and would work hard to impress the world with the upcoming Games.
The Montréal Olympic Games took place 40 years ago, in the summer of 1976; yet to this day, one of the iconic structures of the Olympic complex remains problematic. The stadium’s roof has never been completed according to the original specifications set by the main architect, Roger Taillebert. All of the Olympic complex’s structures, including the stadium (which was supposed to cost C$300 million), far outstretched their original budget, culminating in a cost of C$1.5 billion (Figure I.1).

In April 1972, the international press was invited to the unveiling of the first model of the future Olympic stadium, which looks like a gigantic shell, composed of 12,000 prefabricated components. A major dual technical challenge was an integral part of the design: a 574 foot high inclined tower capable of supporting a retractable roof. Construction began a year later. Unfortunately, between May and October 1975, some trade workers went on strike. The City of Montréal was suddenly facing failure and, even worse, embarrassment in the face of the entire planet.
The Québec government replaced the City of Montréal as the key manager of the project with the Régie des installations olympiques (RIO), or Olympic Games Steering Board. The RIO was responsible for the entire complex, including the Vélodrome, the Aquatics Center, and the Olympic Village where the athletes were to live for two weeks. Changes from the initial plan had to be adopted in a rush in a desperate effort to complete most of the work in time for the opening day. It soon became obvious that the stadium’s tower would simply not be completed on time. Furthermore, unanticipated challenges complicated matters. The foundation rock was found to be unstable in many areas. To make matters worse, U.S. steel producers bumped up their selling prices from US$200 to US$900 per ton in 6 months, and then to an astonishing US$1200 per ton!
In short, two Forces of Production jeopardized the project: trade people and steel dealers (they certainly didn’t fit in the plan set for the project!).
One week prior to the opening of the Games, the stadium construction was formally declared complete (despite the roof being a portion of what it was supposed to be). On July 16, 1976, one day before the grand opening, the laying of the turf at the Olympic Park was finalized. The next day, 12,000 athletes from five continents paraded before 76,000 spectators and half a billion TV viewers.
I.4.2 Québec Multifunctional Amphitheatre (QMA)
As of 2014, the Québec arena was the 100th largest project in Canada28,29 and has been a vibrant example of a successful venture.

Very few articles or books on project feasibility discuss the success of a particular project. I thought it would be most important in this book to do so; first because it feels good to see that projects can, indeed, be completed on time, within budget, and with all the forces working together—strategic planning, processes, people, and line of authority—to produce the expected quality.
Second, this will allow us to shed a positive light that may help us to understand how dealing with points of vulnerabilities (POVs) can lead to great outcomes. I now review briefly each of the four Ps of this project (Plans, Processes, People, and Power).
I.4.2.1 Plan
The QMA was conceived out of a cultural and sport-related necessity. The existing arena—the Pepsi Centre30 —was built in 1949; it currently has a seating capacity of more than 15,000 people. It was approaching the end of its useful life when it was decided to build a new structure. The development of Québec City,31 which is the capital of the Québec province (in Canada), and which hosts a population of half a million people, required that a new building be constructed to accommodate entertainment and sporting events.
The idea of a multifunctional amphitheater replacing the aging (Colisée) Pepsi Centre started long before the QMA was finally built. City planners saw an opportunity to provide the population with a state-of-the-art building. Several versions of the plan were proposed. A company was hired by the city as the project manager for all of the trades.
Some of the key contractors are listed in Table I.3.

On top of these services, of course, a number of other services were required, ranging from security to insurance.
I.4.2.2 Processes
Several processes took place even before the construction actually began. Among those were: audits and meetings with the public, the approval by the city and the various partners in order to go ahead with the project (based on a feasibility study), the design of the structure and competition for awarding the various contracts needed to complete the project, technical choices with respect to the exact location of the structure, and so forth. A massive public demonstration took place on October 2, 2010, in favor of the project.
Table I.4 shows the main participants in the project (each work awarded to a separate company).
Of course, a whole range of other suppliers provided products ranging from office furniture to woodwork.
I.4.2.3 Power
The project was headed by the City of Québec, with the mayor, Mr. Régis Labeaume, having the final say. An important financier helped with the funding—“Groupe Québécor.”
Figure I.2 shows the line of authority along with the flow of money for the entire project.


I.4.3 Mervel Farm project
I now turn to a smaller scenario, that of the Mervel Farm.32 My goal here is to show that whether the project is a multibillion-dollar (e.g., MOS) or a few-thousand-dollar venture, the same principles apply. Some of the principles I will use are anchored in existing project management theory, as we shall see. Others are rather innovative, and this book is all about that—an innovative way of analyzing projects—because common project feasibility analyses often fall short of many essential steps that may explain why experiences such as the Montréal Olympic Stadium are repeated may times over at different levels of drama and in different countries.
In 2015, three entrepreneurs approached a local business center located in Pierreville, a small village squeezed between two large cities amounting to more than a million people and located across the river from Ottawa, the national capital of Canada. They wanted to develop a one-time summer project whereby the decaying Mervel Farm would be transformed into an “agritouristic” event that would include the participation of local farmers and artisans. The Mervel Farm is a historic site sitting in the heart of Pierreville. It consists of an 8.5-acre farmland that is owned by the National Capital Commission (NCC) and an old farmhouse adjacent to a barn. The land has not been put to agricultural use in decades. The house and barn have received basic maintenance, but little upgrades (e.g., to its electrical system) have been implemented. The site has been virtually abandoned. The idea of the three entrepreneurs was to capitalize on an emerging trend: that of “agritourism.” Thus, they wished to receive funding from the local business center—an office that gets government funding aimed at encouraging local business ventures with the goal of creating jobs and promoting the area. Additionally, they had managed to convince the National Capital Commission that it would be worth attempting to revitalize this emblem of local history, at least for one summer. Should the project be successful, there would be an opportunity to turn the idea into a year-long operation, with winter activities that would include ice rinks, sledding, Christmas treasure hunts, and so forth.
The promoters estimated that they would need roughly C$150,000 in cash flow; also, C$50,000 would be spent to buy equipment and C$3,000 to acquire furniture. Funds would expectedly be invested by the promoters (C$20,000), the local business center (C$50,000), and the local tourism agency (C$100,000). Banks would loan C$50,000. The National Capital Commission would offer the site at no cost for the first year, providing that the promoters prioritize the proper maintenance of the land and buildings. The project would start at the end of May 2016 and end on the Labor Day weekend, for a total duration of approximately 3.5 months.
Research done by the promoters indicated that 46% of similar tourist-oriented agribusinesses received approximately 2500 visitors a year for average revenues of C$250,000. Very few of these businesses are located in town for obvious reasons. It was estimated that roughly 3% of the 5 million tourists in the greater area of Pierreville-Ottawa favored agritourism; in reality, only 2% visit the Museum of Agriculture located across the river, in Ottawa.
The City of Pierreville and the local business center see the concept as an additional opportunity to attract tourists, most of whom flock to downtown Ottawa, where the national Parliament buildings are located or venture in the nearby large Gatineau Park with its attractive outdoor sporting options (cycling, kayaking, swimming, etc.).

The core operating hypothesis was that an army of volunteers would come and work the land. These would be local people who cherish the idea of local farm products and teenagers who would want to gain some experience in a work environment. Tourists would show up and pick up, say, strawberries, and pay for the bucket at a premium of 20% over average local store retail prices. The cost of space for local producers and artisans offering their products out of temporary kiosks would be of C$15.00 per square foot.
There would be a full-time agronomist, a temporary site architect who would redesign the site given its new mission, one full-time project manager, and a small team of employees assigned to the various functions that the project entails (cleaning the site, coordinating the parking flow, guiding tours, etc.). The entrepreneurs would also hire a part-time marketing manager who would promote the site in all venues susceptible to attracting tourists.
The organizational structure would be that of a cooperative, a system that is very popular in Québec, whether in the agribusiness or in financial activities. Local farmers and crafts people who would set up shop around the farmhouse in the summer would have to become members of the cooperative, at a nominal fee of C$50.00 per year.
Some areas of farmland that would not be used for farming crops (e.g., pumpkins and strawberries) or for growing flowers would be rented out to other interested parties, such as small businesses offering donkey- or horseback-riding activities or else groups necessitating an outdoor space for special events (e.g., a company picnic).
Should the project not be found viable once the project is tested over the summer, there would be an opportunity to rent out the farming land to local citizens who would want to grow their own farm products on a dedicated parcel of land.
The Mervel Farm project was expected to have various impacts: it would attract tourists and generate an influx of money in the local economy (estimated at C$0.5 million/year). As it is now, the Mervel Farm is surrounded by houses owned by citizens much like a golf course in the middle of a town is bordered by houses. There is no parking site dedicated to accommodate a sudden influx of tourists, so that a new parking area would have to be built.
Once the project was completed, the project managers would write a report that they would submit to the funders (the City of Pierreville and the National Capital Commission).
I gave this example because it is easy to get a feel for what could go wrong. There can be no feasibility study worth its name without a full appreciation of the project’s DNA. In fact, one of the major causes of project failure is the lack of understanding of the project’s goal and structure. Being careless in evaluating all of the components that define a project is turning a blind eye on it, thus giving POVS an opportunity to cause havoc as the project evolves. This can spell considerable financial trouble down the road. POVs can invade inputs, transformation, and outputs.
Throughout this book, I will use a number of keywords and core concepts. The keywords of process modeling include “inputs,” “transformation,” and “outputs” (Figure I.3).

Figure I.3 is very simple yet it is at the core of the concept of any project. From it, I derive a number of submodels that create the canvas upon which feasibility studies can be commenced.
As put forth by a project leader: “We deliver our products in 80 countries. Each market is unique. Each market is a project in itself. The key is the capacity to handle change. A project is simply a change process.”33
In the Mervel Farm project, inputs include all of the equipment that will need to be brought to the site, such as temporary sanitary facilities. Transformation refers to the changing farmland that has been abandoned for decades into a safe and friendly venue where families can come, walk, shop, and play. Outputs include waste blithely thrown away by visitors, and, from an intangible point of view, the positive city reputation that the event will engender if things go well.
One of the core models fostered in this book is, indeed, that of inputs–transformation–outputs. This is not news, of course. What is an addition to project management theory and especially to feasibility analysis is the four Ps.
I.5 Four Ps
Since the 1960s, marketing theory has adopted the four Ps system, which stands for “product, price, promotion, and place (distribution).” In project feasibility, four Ps are also used: Plans, Processes, People, and Power34,35
I suppose that the four Ps normally form positive forces driving the project (I know that there are also negative forces). They are most active during the transformation process, at which point I classify36 them as Plans’, Processes’, People’, and Power’.
I thus complement the input–transformation–output model by specifying what “inputs” mean, as shown in Figure I.4.
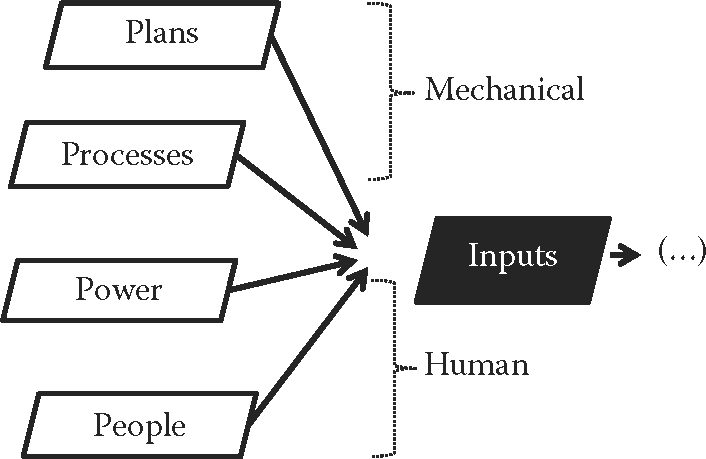
In my basic model, inputs are actually composed of four key elements: “Plans” and “Processes” deal with the internal mechanics of projects; “People” and “Power” represent its human aspect (the psychodynamics or an organization’s internal cultural forces). The Plans and Processes, People, and Power, form the four Ps of project management, and are sine qua non elements that the analyst must dutifully take into account when doing a feasibility study. In the Mervel Farm project, roughly speaking, the Plan is the vision of a tourist venue for an old farmhouse; Processes are, for example, the means used to direct the traffic of cars and visitors; People are the tourists, the staff, and the army of volunteers; and Power is the site manager and the promoters.
The sine qua non condition is partly set forth by posing the question: “Can there be a project without a plan?” The answer is “No”; therefore, the plan is likely a sine qua non condition. In the present model, I assume there is no colinearity between the four Ps so that they don’t interact with each other before the project actually enters into the transformation phase. The absence of colinearity is proved by the question posed at the input stage, prior to the phase of transformation: “Can the plan be established without team members actually transforming inputs into outputs?” The answer is “Yes.” “Can the plan be established without all transformation processes being carved in stone?” “Yes.” “Can the plan be set out without having found the right project managers to take on the challenge?” “Yes.” Then, the same types of questions are posed for the other variables. For example, “Can the processes take place in the planning stage without committing specific people?” and so forth. Therefore, a sine qua non condition is set when (1) the variable must be present to define the project’s inputs and (2) each variable is independent.37 Of course, as the project moves from being an idea to being a concrete endeavor, colinearity builds up because people will handle certain processes, will need some lines of authority (Power), and will produce deliverables according to plan.
The four Ps will work together during the transformation stage, but for now, the plan is decided by the promoters (Power) independently of the staff (People) that will be hired later on, and the processes are being set but not put in motion just yet. Ultimately, a project is composed of inputs, a transformation process, and outputs, given a calendar of tasks and activities (time).
Time is entered as a constraint38 because time is what links inputs to transformation and ultimately to outputs. For the four Ps set as inputs, prior to being brought together through the process of transformation, we have
Assume that each P has its one beta (β) expressing the contribution of the respective P to the inputs; we then have39
However, during the transformation stage, the four Ps are brought together and interact intensely with one another. In other words, the characteristics of each P affect the other Ps: as an example, what People do has an influence on the line of authority (Power), which could potentially trigger a change in the project plan or on some of its processes. Indeed, changes compared with the initial plan are one of the major complaints that project staff use when trying to explain their shortcomings.
In the case of the QMA for example, about 2 months prior to its completion, there had been no less than 1100 DDM (requests for changes or “demandes de modifications”), for a total value of approximately 17 million dollars, with each and every one having to be reviewed and approved or else dismissed by the chief project manager. On a 400 million dollar project, this represents a change request of roughly 4% (17/400); it turns out that 4% is also a usual measure for waste in a production line. For example, on a printing press, it is generally estimated that 4% of ink and paper loss is due to the warming up of the machines. When I look at the cost of changes related to construction and to equipment, I find that it is an average of 6% (for a budget of 30 million dollars involving 46 requests for change [DDM]). From this perspective and if I expand my thinking a bit (setting each change as a POV), I can estimate that there are a minimum of 4%–7% of POVs in projects in general. On a chessboard, even before starting the game, one POV exists among the 16 pieces of the same color (6%): the pawn on the F2 square is technically less protected compared with any of the other pieces on the board. This measure is by no means scientific, but serves to highlight the fact that there is a real possibility of POVs existing within any project and that, if they do, they are not insignificant.40 If 100% of projects have POVs and knowing that POVs account for 4% of their content, it seems fair to say that the POVs must be dealt with.
Simply identifying the four Ps in the preliminary analysis of the project is useful (indeed, this is already a more complete view of the project compared with what is done customarily), but it is far from reflecting the manifold aspects of their interactions once the project gets into its transformation stage. In other words, there is plenty of room for points of vulnerability to be avowed after the project has been given the go-ahead; that is, once the project enters into the transformation stage. The project manager may be caught off guard because, on paper, everything seems to be in marching order. The more we can do to understand the four Ps that are tied to a particular project ahead of time, the more equipped we are to avoid unpleasant surprises. To account for this possibility, I add an error term (ɛ) to my project definition formula, but instead of having a positive sign in front of the error term, I use a negative sign. The reason is that in theory, the sum of the four Ps should deliver a perfect project, but points of vulnerability will come and reduce the potential for perfection. We all know that humans make errors (except for our wives!) and that processes don’t always go according to plan, that the plans themselves can be faulty, and that power struggles can spoil a work atmosphere. We thus express the sum of all points of vulnerabilities as they materialize with their devastating effects by ɛ, which is, as we shall see later (see Equation 4.9), a measure of chaos (and more particularly, of deviance to norms of quality). We have
In terms of a “Plan” for the Mervel Farm project case, one must assume that the weather will be favorable, but nothing is less certain. What if it is a wet summer? Will tourists venture in an outdoor open field to buy regional products they can probably find one way or the other in a close, tidy, and warm environment such as a local specialty store? That is, for sure, a POV (no proper shelter) versus a given risk (that of bad weather).
In terms of Processes, the Mervel Farm concept relies heavily on the willingness of local craftspeople and farmers to adhere to its cooperative: an obligatory step in order to participate in the project. What if these people do not think the setup is worth their time and money? This is a risk.
In this same project, “People” refer to all stakeholders, including clients, fund providers, managers, staff, the media, and so forth. PMBOK would have it that the following groups would be present: initiators (Plans), clients (People), start-up group (Process), process group (Process), execution group (Process), surveillance group (Power), and control group (Power). The start-up group includes the three entrepreneurs that came up with the idea as well as the City of Pierreville and the National Capital Commission. To the process group, I add the project manager, the agronomist that will necessarily have to be hired, as well as disparate sources of financing such as banks, and a head coordinator of the crew of volunteers (as the project relies heavily on the participation of local volunteers). For all intents and purposes, I characterize these People’ as inputs that participate in the chain of transformation, which then produce outputs that will be delivered to the end customers.
The execution group includes people specifically hired to do the work on the site. The surveillance group is simply the project manager and some of his key staff. The same applies to the control group, except that the National Capital Commission and the City of Pierreville will be sending their own inspectors to ascertain compliance with the farm’s and city’s strict rules of operation.
A typical POV when it comes to People, whom I refer to as Forces of Production (FP) when dealing with a transformation process, is the existence of so-called uncontrolled Forces of Production (FPnc, or the “Unfits”), who are people acting in a detrimental fashion during the transformation stage.41
Forces of Production (who are People acting favorably during the transformation phase) are assumed to be under control (FPc): a project manager directs them, evaluates them, and pays them. He thus has control over them. Technically, if one such Force of Production (team member) falls below a preset performance requirement, an action can be taken to rectify the situation, by way of docking bonuses, training, reprimand, or layoff. However, there are Forces of Production that remain amply uncontrolled or uncontrollable (FCnc): these individuals or groups of individuals have their own agendas. An excellent example is the strike by the construction/trade individuals that plagued the construction of the Olympic Stadium in Montréal in 1976 a few months prior to its grand opening. Management had been “painted in a corner” so to speak: over a billion dollars had been invested to show the entire world what Montréal was made of. Evidently, there was a risk and a point of vulnerability (not having an internal specialized trade force) because a large workforce (apart from trade people) was uncontrolled. In the case of the Mervel Farm, there is also a certain number of possible Unfits (FPnc)—the army of volunteers whom the project promoters assume will rush to adhere to the ideology of the project (“a more natural way of life within a city”). However, what if this army of teenagers decides to not show up on the next workday for whatever reason (the teenagers went to bed too late, the nice weather commanded a picnic at the beach with their boy/girlfriends, etc.)? This is an ominous point of vulnerability (taking for granted that there are employees of this sort—albeit unpaid—available to the promoters).
A project is a cluster of people that is bound by a calendar of tasks and activities, costs, and norms of quality; that has specific objectives to meet; and that deals with problems and challenges. For example, a construction project such as the QMA includes agents such as architects, builders, experts responsible for establishing work schedules, subcontractors, and tradespeople (carpenters, electricians, etc.).
There are two broad categories of people: external (e.g., banks), to whom risks can be attributed; and internal (often busy performing daily operations), to whom vulnerabilities can be attributed. In the case of the QMA, external people are trade people hired by the construction manager, Pomerleau. Internal people are the crew headed by Mr. Jean Rochette, from the City of Québec. We can also divide People according to whether they are producers, consumers (such as the Olympic athletes and visitors to the Montréal Games), regulators (such as government or private professional associations), or so-called bad apples (who consist of unethical pressure groups, illegal workers, etc.—they act outside of the social norms and cause collateral damage). Unfits (uncontrolled Forces of Production) are one category of people acting up. All external uncontrolled people represent a risk, and may negatively affect projects by empowering points of vulnerability; all internal uncontrolled people represent a POV. We can represent People, before they become Forces of Production by way of the transformation process, as shown in Figure I.5.

Some authors have separated people depending on whether they are customers (consumers), the parent organizations (producers), project teams (producers), or the public (consumers).42 Neither they nor PMBOK43 mention bad apples, but any experienced project manager will recognize their presence and devastating role without difficulty. By definition, internal bad apples are a POV. External bad apples were especially active in the construction industry in Québec—the 1974–1975 Cliche Commission exposed the fact that the mafia integrated many layers of construction projects with rippling effects in terms of costs and delays.
Power is the line of authority (both formal and informal) that sees that the project comes to a successful end. It includes the project managers and the various jurisdictional authorities who make sure codes and rules are respected. It is intimately linked to decision-making, a core topic of this book (see Chapter 7).
An example of Power is found in the QMA. Any change to the content of the project had to be formally authorized by the project director and scrupulously entered into a register.
As previously put forth, POVs may exist within each one of the four Ps. With respect to Power, there is a POV readily identifiable in the Mervel Farm project: the fact that the City of Pierreville (of provincial jurisdiction), which is an integral part of the project, must cooperate with the National Capital Commission (of federal jurisdiction). Often such political setups lead to bureaucratic or political upheaval.
Project promoters (acting as producers) design projects and find ways to fund them. Project leaders are more into day-to-day operations: they plan project activities, establish costs and schedules, lead and motivate teams, and implement a certain project culture. They measure risks, plan for the long term, and share their vision. Project managers, on the other hand, execute—they manage activities, costs, resources (including human resources), and schedules. They are task-oriented, they conform and administer and tend to avoid risk. They understand the importance of people in the organization, of competencies, culture, leadership, and performance.44 Their approach to risk is what differentiates promoters from leaders from managers. Project leaders should be able to foresee POVs and project managers should be able to implement solutions that minimize them in earnest.
Judging from the Mervel Farm project, one can see that on paper all seems quite promising: the Plan is set and approved by expert committees, People who will work at the farm are assumed to be hardcore believers in the value of such an undertaking, Processes have been well laid out, and the promoters are enthusiastic and competent (Power). However, once all four elements (the four Ps) are put together, the scenario may not be as rosy. A group of volunteers (People) may not be willing to abide by the processes set in place. Intentions and reality differ. A project is by definition just that: intentions (hence the term “project”).
So far, I have demonstrated that a project is a transformation process that receives inputs and that generates outputs, such as deliverables, thereafter. These inputs consist of the four Ps (Plans, Processes, People and Power) which interact during the transformation stage (Plans’, Processes’, People’, and Power’). All four Ps are susceptible to POVs for whatever type of project, be it a construction endeavor or a touristy park of sorts.
I.6 Projects and vulnerabilities
Between 1990 and 2007, the interest in the concept of “vulnerability” in scientific literature has increased sevenfold.45 Back in 1983, some authors46 postulated that vulnerability had two sides: an external one consisting of risks and an internal one whereby the subject of risk lacks the means to cope without suffering from a damaging loss. Some scholars invoke the idea that vulnerability is at the center of the value-creation process.47 Other authors present the reduction of vulnerability as an element of risk management.48 The following formula has been proposed: risks are a mix of hazard, exposure, and vulnerability.49
Some of these authors rightfully assume a mathematical link between risk and vulnerability. This makes intuitive sense. Suppose a person is a champion swimmer. Going out and swimming in a turbid river with its load of rapids and hazards (rocks, turbulence, etc.) is indeed a gutsy venture. However, because he is an excellent swimmer, he does not feel vulnerable and will take on the challenge. On the other hand, a person who has never learned how to swim will judge that a still pond that is no deeper than 12 inches (approx. 30 cm) is a great source of danger. The perception of danger (threat) is tied to one’s own perception of one’s vulnerability.
I prefer to separate risk and vulnerability and not to consider that they are two sides of the same coin, they certainly are interconnected. My vision of projects is thus to differentiate between risks and vulnerabilities. Risks are actually external and vulnerabilities are internal, just as opportunities are external and strengths are assumed to be internal. In Table I.5, we have what we called the SVOR (strengths, vulnerabilities, opportunities, and risks) replacing the SWOT (the SVOR will be included in the six analytical Ps that I will discuss in Chapter 7 under the simple heading “POVs”).
| Internal | External |
|---|---|---|
Positive forces | Strengths | Opportunities |
Negative forces | Vulnerabilities (weaknesses) | Risks (threats) |
It is possible to establish degrees of gravity with respect to POVs. In Table I.6,50 I connect high and low vulnerability with the four Ps.51

As can be seen, POVs can affect any one of the four Ps. This is important. In the literature on project management, SWOT analyses rarely encompass all of the major components of the project—meaning the four Ps. However, forgetting that each of the four Ps may contain a POV is diminishing the chances of success. We know that colinearity builds up between the four Ps as the project moves from the conception to the transformation phase; this means that Plans, Processes, People, and Power become more and more entangled and interdependent as the project is being materialized. The net result is that forgetting POVs on one or more of the four Ps at the project’s initiation stage is really inviting problems to gain in momentum—the bad apple will contaminate the rest of the tree. Brutus will act on his hidden agenda.
Let’s revert to the example of the Mervel Farm. Suppose for a moment that the army of volunteers that is assumed to be happily working at the farm has a sudden change of heart and decides that it wants better working conditions. The plan is altered; processes such as welcoming visitors are shaken, of course, and the few managers at the helm start to worry.
The QMA provides another example of how POVs can be regarded. The crew addressed potential problems with what it called “main concerns” (Principales préoccupations), which were concerns worth keeping a close eye on. In the main logbook, these were classified as follows: initial level, present level, and critical level, with each level having a status: critical, high, medium, low, and resolved. Concerns are included in Table I.7 as examples.
As can be seen, POVs in the case of the QMA evolved around four elements: Plans, Processes, People, and Power. These in turn are mandatorily tied to three constraints—those related to time (the calendar), those related to costs, and those related to norms of quality—that interacted with the four Ps themselves once they were in the transformation phase (which are then referred to as Plans’, Processes’, People’, and Power’). As explained by a project manager,52 “Constraints are parameters that deplete the number of solutions that can be implemented to solve a problem.” We can illustrate this classification of POVs as shown in Table I.8.

POVs related to | … Given … | Constraint |
|---|---|---|
| |
Of note, risks and POVs exist in both national and international projects: they are without frontiers. Let’s call them “Problems without borders!” Factors deemed to harbor an international project’s risks and vulnerabilities include inappropriate localization (Plans), insufficient funding (Plans), dubious contractor’s business behaviors (People), a lack of desirability in the host country and poor public support (People), strenuous relationship with the government (Power), and unfair contractual conditions (Power), among many others.
Even though risks are at times said to be the result of an encounter between threats and vulnerabilities,53 I prefer to refer to the term “Apprehension” instead of using the term “threat” and to separate this concept from risks. Apprehension is an internalized reaction to a “perceived threat,” which is a well-documented psychological phenomenon that affects Dominant, Contingency, and Short strategies in different ways. It is an internal phenomenon. Assessing threats (and feeling apprehensive) is a useful self-protective mechanism54; it is an assessment upon which Dominant, Contingency or Short strategies are drafted.
The concept of vulnerability can apply either to a system or to persons.55 There could be a large threat and a sense of invulnerability and hence, no risks would be deemed to exist. Therefore, I choose to allocate the word “threat” (under the form of “apprehension”) to a psychological phenomenon that affects stakeholders (People). The coming of a snowstorm does not actually threaten the pouring of concrete to set the foundation of a new building. It’s hard to imagine that inanimate objects or events actually threaten anyone, including a house builder. Rather, they represent a risk. Therefore, I keep the expression of “threat” where it belongs: in the psychological field, and I relate it to Apprehension, and I use risks instead of threats. This is why I do not use the SWOT system, but rather the SVOR system. Being circumspect is sensing a possible threat or danger from the outside world; this in turn leads to reduced trust. Apprehension is a cognitive state resulting from an appraisal of the outside world, which can take at times a mere fraction of a second, whereas distrust is the emotional state that takes time to build (yet less time than to build trust56). When one is apprehensive, one anticipates to a certain degree that one can get hurt in vulnerable weak spots. We will see how this plays out in the context of a project where people and teams interact, often in the midst of great uncertainty. In sum, Apprehension can be viewed as the cognitive equivalent of distrust, which is considered to be an emotional state. However, beware! With Apprehension comes a sense of vulnerability; this is not necessarily true with distrust. One can distrust another person without feeling vulnerable. In fact, he will probably distance himself and feel untouchable.
The term “vulnerability” has been given different meanings by a slew of authors, ranging from adaptability, capacity, exposure, potentiality, resilience, robustness, sensitivity, or even wound.57 Some scholars propose a methodology to deal with vulnerabilities58 as follows: There should be a management group assigned to identify vulnerabilities; once POVs are identified, they should be analyzed. Then, a response plan must be prepared (the model excludes the fact that it must be implemented). Finally, monitoring and control must take place with a provision for lessons learned.
The present book proposes a more thorough methodology (the six Ps of strategic management thinking—PRO, the four Ps, POW, POV, POE, and PWP), but at least we are comforted by the fact that attempts have been made to establish a procedure to address vulnerabilities, something that escapes the various versions of PMBOK. In the same vein, some authors envision to measure risks and vulnerabilities along a supply chain.59 I provide some samples of measurements that could potentially be utilized to gauge the presence of POVs in Table I.9.60

This is not to say that these items should be actual measurements of POVs, but simply that feasibility analysts and project managers are not short of potential metrics—these are incremental when having to meet norms of quality. In other words, there are no managerial reasons to dodge the reality of POVs.
Vulnerabilities, just like risks, nourish uncertainty; uncertainty intensifies the sense of looming external risks and vulnerability (and thus the level of apprehension). Uncertainty is forged by both external and internal forces, such as the novelty of particular equipment and materials (Processes), or by political changes (Power). Ambiguity is often fed by questionable planning (e.g., with respect to contracts, financing, material procurement, and scope changes)61 and reckless individuals (e.g., people with poor competencies—unfits in their own right). Adding to the ambiguity is the existence of what I call hidden truths62 or what is also known as hidden agendas when it comes down to people’s behaviors—something we will study in detail in the sections on People (Chapters 5 and 6). In this respect, some authors refer to nonquantifiable factors, which include labor disputes, a lack of discipline, and the overlapping of project stages.63
The point I make is that POVs cannot be taken lightly; they exist and they thwart efforts to ensure that the calendar of activities, cost structure, and preset norms of quality are respected. They can be measured, and strategies can be implemented to deal with them. Dominant and Contingency strategies are available.
I highlight the fact that the human factor (People) is critical in POV assessments, even when they primarily concern equipment, machinery, or mechanical processes, for example. Finally, I emphasize the fact that POVs can be somewhat tricky, especially when they involve human behavior.
I.7 Need and opportunity
The term “opportunity” is the other important term in the SWOT or its equivalent, the SVOR (strengths, vulnerabilities, opportunity, and risks, which really have a role to play in the mental process of apprehension) analysis. Most books and articles on project management refer to the concept of “need,” but this concept must be enlarged. Quite a few projects have commenced not because of needs per se, but by pure opportunism: a political party in power will grant a massive fund for a community project not based on the population’s needs but on electoral motivations.
Hence, I prefer to resort to the term opportunity. I like to classify the opportunities into four categories: actual needs, desires, problems, or sources of discomfort.64 Let us explain. A customer’s (the people who will use the deliverables) motivation can be a need: there is an urgent need to provide a Canadian aboriginal community with a proper water supply system and with electricity. What makes this example a need are the dire consequences of not responding to the situation the community is in by way of a project. A customer may have a desire—it has come to the attention of some promoters that people in Pierreville (Québec, Canada) liked the idea of a farm located right downtown. Citizens don’t need a tourist-oriented farm; they can live without this farm producing crops of fruits and vegetables, or flowers for that matter, as they have for decades. However, it sounds desirable to revitalize tourism in the region, including agritourism. A customer may also face a particular problem: say the customer is a city with high levels of pollution. The problem may be addressed by developing better access to cyclists in order to reduce car usage. This is neither a need nor a desire, but certainly, it is a situation whereby a problem could potentially be solved or alleviated through a particular project. Finally, a source of motivation for a customer may be discomfort; say, for example, that a group of office employees has been working in less than adequate conditions in an older building. Some even get sick due to dust and mold. There is no need per se to build a new office, nor is there a desire or a fancy to get into a new building with pink walls, nor is there a problem per se since employees who will use the new building continue to work while it is being built. However, perhaps their productivity would be higher if they were relocated to a modern building. The bottom line is that there is a source of motivation for the client or potential client (need, desire, problem, or discomfort) which, from the project initiator’s point of view, is an opportunity.
We somewhat encompass not only need, but also desire, problems, and discomfort as a source of motivation from a client’s point of view and as an opportunity from the project promoter’s point of view as what justifies, in the end, a project. This is not just pure semantics: the public will usually be much more critical if the project addresses a specific need (e.g., a sewer system) than if the project serves a fancy political agenda. Hence, feasibility analysts will look at POVs with a critical eye trained to recognize the nature of the opportunity the project is conceived upon.
Put simply, there is no requirement for a feasibility study if there is no opportunity, in whatever form it takes. A so-called needs analysis should really be an opportunity analysis.
I have referred in the previous paragraphs to the notion of a “mathematical link” between risk and vulnerability. I have conducted a number of studies on the subject and results are communicated throughout this book.65 More specifically, I assume that there is a mathematical link between Total strengths and Opportunities, as shown in Figure I.6.
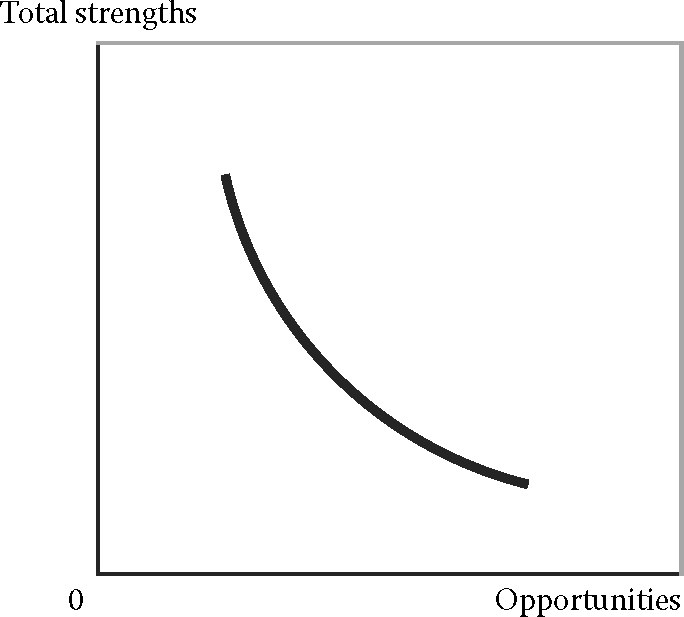
The mathematical function is assumed to be:66
This is the function of a rectangular hyperbola when x is a constant (actually, we only use a portion of the hyperbola). Large opportunities weaken total strengths because they entail more POVs. The model I present here posits that both strengths and opportunities are important, at the same time. A company in charge of realizing a project may possess substantial strengths related to technical expertise, for example, but if the opportunity does not exist, what is the point of spending money on the proposed project? Similarly, the opportunity may be vast, but if the project is flaccid (e.g., if it does not respond to a real need), how can one benefit from it? Perhaps the MOS is a good example in this regard: the opportunity to present Montréal to the world was outstanding … but were there enough strengths within Québec society to take on the challenge?
Hence, Total strengths and Opportunities go hand in hand. A rectangular hyperbola has a particularity: the surface under any point along the curve is the same regardless of this point. In essence, a project manager will elect to be consistent with himself:67 he will choose to adjust his strengths to the opportunities by augmenting one and reducing the consideration of the other, or vice versa. The numerator x is, in this case, a variable that belongs to each project; the larger the value of x, the more strengths are assumed in order to complete the proposed project given the opportunity. From this perspective, we assume that x refers to infrastructures, that is, anything that is already in place and that can provide a solid base for the project and which is pretty much a given (it is hard to change infrastructures—see the Africa vs. Haiti case, Chapter 5, for example). A company wishing to construct a well in a remote part of Africa on behalf of an international organization may be full of resources (strengths) and see a great opportunity to provide a community with water, but if the infrastructures are not in place (roads, electricity, etc.), the project will be that much more difficult to realize; the strengths will be of no use. For the Mervel Farm project as another example, the infrastructure that is particularly lacking is a large parking area.
For all intents and purposes, therefore, let’s set our equation as follows:
Note that our model exists given time (in fact, we will see that time is just one element of a triple constraint). Infrastructures decay with time; thus, time must be part of the equation.
We can set a similar equation with respect to the relationship between risks (which are external) and vulnerabilities (which are internal), as shown in Figure I.7.
The mathematical relationship is expressed as follows:68

I provided the example of the swimmer in a previous paragraph. Placed in a project context, this equation means that risks are risks only with respect to vulnerabilities, and vice versa. The project manager cannot escape risks nor can it be assumed that there are no POVs among the four Ps of the project. Instead, the project manager must learn to find a balance between them both, a stand which allows him to remain equal to himself, that is, to respect the project plan, to properly use processes, people’s efforts, and power. I discuss in more details the nature and value of k that I estimated based on my multiple studies in further chapters.
For now, what matters is that, overall, a project manager is best positioned when he balances each element of the SVOR (strengths, vulnerabilities, opportunity, and risks), given their mathematical interactions. We have Table I.10.
| Internal | Mathematical link | External |
|---|---|---|---|
Positive forces | Total Strengths | Total Strengths | Constraints (Time) = (Infrastructures/Opportunity) | Opportunities |
Negative forces | Vulnerabilities | Risks | Constraints (Time)= (k/Vulnerability) | Risks |
Of course, an ideal scenario is one whereby there are strengths matching opportunities (positive forces) and few risks or vulnerabilities (negative forces). A remark for the feasibility analyst to be made here is to note the importance of the state of the infrastructures where the project takes place.
It would be nice to know what the mathematical relationship is between strengths and vulnerabilities and between opportunities and risks. To help us with this challenge, I resort to two disciplines that seem disconnected from the present reality, but which will help us throughout this book to comprehend project feasibility.
In the game of chess, there are two basic strategies: an offensive strategy, and a defensive strategy consisting of two options: contingency retreat and short retreat (most players only refer to offensive and defensive strategies though). The offensive strategy is aggressive and seeks to take advantage of the opponent’s vulnerabilities. A contingency option is elected when the player wants to secure his position and his pieces, anticipating that he may have some vulnerability (some POVs). For example, typically, after acquiring an opponent’s piece, a player will not immediately deploy an additional attack. He/she will make sure his position is not subject to assaults given the new piece layout on the check board. He is adopting a Contingency strategy. A Short option occurs when the player is forced into a defensive position because he is under relentless pressure from his opponent. In chess, a defensive retreat strategy of this kind is mandatory after suffering the loss of an important piece, such as a bishop or a strategic pawn.
From a neurobiological point of view, there are also two main behavioral positions anchored in the brain—offensive and defensive—when experiencing apprehension (perceived threat). The lateral hypothalamus hosts the Instrumentally hostile aggression center often referred to in this book as simply “Hostile position”69—IP—or “predator dynamic”; the direct perceived threat in this case is the fact that the predator’s needs will not be fulfilled if action is not taken70 —the tiger is hungry. The medial hypothalamus is responsible for what is called “defensive aggression” (prey position or, as referred to in this book, “Defensive position” —DP, or else, figuratively, a “lonely sheep” position).71 This is true for both humans and animals (e.g., in cats). If someone inadvertently walks on a cat’s tail, the cat may react by attacking the leg of the offender. This reaction is not planned, but it helps the cat survive or else escape danger (defensive aggression). By contrast, a cat will methodically stalk and attack an innocent, naïve, and cute wandering mouse (!). This is predatory, instrumental (offensive) aggression. In cats, most particularly, the lateral and medial hypothalamus cannot operate at the same time: the cat acts in either an offensive or a defensive position, but absolutely no behavior takes place with part of one and part of the other. In humans, it seems the frontier is not as sharply divided—this remains to be further studied by neuroscientists.
What counts for us with the foregoing explanations is that we can assume that “strengths” in the SVOR model refers to total strengths, which would be the sum of a Dominant strategy, a Contingency strategy, and a Short strategy, as follows:
As previously touched on, a Dominant strategy (DS) contains strengths that allow the project manager to take a responsible lead on a project. A Contingency strategy (CS) encompasses strengths that allow the project manager to minimize the effect of risks and vulnerabilities to the project. A robust project is one that sees both DS and CS operate at the right time. The point here is that while total strengths are mathematically connected to opportunities, Short strategies—SS—(calculated as [Total Strengths - (DS + CS)]) are more directly connected to vulnerabilities.72 A Short strategy is a strategy that reveals itself when a project manager is caught by surprise following the surge of an unsuspected POV in front of an unsuspected risk. If a project manager cannot develop Short strategies in the heat of the action, his vulnerabilities augment. Think of a gazelle caught by surprise by a hungry tiger; if the gazelle cannot find a way to deal with the threat (the risk of being eaten), it will make itself completely vulnerable.
People use Dominant, Contingency and Short strategies to deal with their vulnerabilities at large, not only with the unsuspected vulnerabilities. Thus, let’s assume that there is a reverse relationship between “Total strengths” and “Vulnerabilities,” giving us the following:
We know that Total Strengths is equal to Infrastructures over Opportunities (given time, in particular), so we have
We can now complete our SVOR table as shown in Table I.11.
I do not pretend this to be the Holy Grail of management, but it can serve as a guideline when trying to capture the relationships between the elements of the SVOR (more traditionally, of the SWOT). Assume for now that k expresses the ideal position of a project manager (an efficient position, by which he would want to remain stable over the entire course of the project). We will see that k is related to the sense of apprehension in Chapters 5 and 6 addressing People and to control and transparency in Chapter 7 dedicated to the study of Power. For now, what matters is that we have found a useful way to connect vulnerabilities (or more exactly POVs) to important managerial considerations such as strengths, risks, and opportunities.
| Internal | Mathematical link | External |
|---|---|---|---|
Positive forces | Total Strengths | Total Strengths | Constraints = Infrastructures/Opportunities | Opportunities |
Mathematical link | Vulnerabilities | Constraints = 1/Total Strengths | k = 1.3 | Opportunity | Constraints = 1/Risks |
Negative forces | Vulnerabilities | Risks | Constraints = (k / Vulnerability) | Risks |
Overall, the SVOR model seems much more complete than the traditional SWOT analysis. We know that the probability of the success of a project is related to the interaction between the strengths, opportunities, vulnerabilities, and risks. Hence, a feasibility expert should keep the SVOR method in mind when analyzing a project.
The lesson learned here is that it is advisable to link POVs to managerial considerations. Hence, in my opinion, evaluating POVs should be part of any project managerial action, for whatever type of project is undertaken.
I.8 Book layout
This introduction gives you a flavor of how this book deals with project management theory, and more particularly with project feasibility analysis, and more particularly still, with analyses of POVs. As mentioned, I will endeavor to tie in new concepts to existing concepts and terminology found in project management literature so that the reader does not feel overwhelmed by the flow of new information.
This book offers a range of tools that allow project evaluators to anticipate what can go wrong with the project proposal that is put in front of him. The theory I present here is in large part my own; in fact, I rely heavily on my own experiences, hypotheses, intuition, previous writings, and on researches I have conducted, especially with respect to neurobiological research that I completed in 2013, addressing the process of decision-making under uncertain circumstances. I would like to claim that my theoretical assumptions are well documented, but I will let the reader be the judge of the usefulness of the tools that I present. I invite the reader to refer to my previous works, some of which are listed in the reference section but not abundantly documented throughout the text, so that my name does not keep popping up, thus giving the reader the impression that I suffer from narcissism, which is certainly not the case!
The next sections are as follows: first, I discuss Plans (Chapters 1, 2 and 3). I focus in particular on the definition of a project, and then offer an overview of prefeasibility and feasibility studies. The subsequent section focuses on the second P —processes (Chapter 4). I provide examples of real firms engaged in project and production processes and elucidate some elements of modeling in project feasibility analyses. In Chapters 5 and 6, I discuss People, beginning with an attempt at understanding key stakeholders; I examine how People interact with each other. A number of psychological studies performed in the course of multiple projects provide valuable data that shed light on the intricacies of human behavior in the context of project deployment. Chapter 7 is dedicated to Power; I resort to neurobiological research to show how the brain goes about making decisions (and decision errors) in the context of apprehension and opportunities, considering both project leaders and project funders as decision-makers. The conclusion outlines the various unique findings of this book. Each chapter ends with real cases pertaining to a food plant facility in North America, an artistic venture, and so forth. I believe these cases may help the reader to apply the knowledge I put forth to particular contexts. I also include some fun brainteasers to get those neurons firing after the reader has become exhausted by reading the present book!
As the reader can already judge, I refer throughout the book to various projects in which I have been participating either closely or remotely, some valued at many hundreds of millions of dollars and others brought to completion within a minimal budget. The Table of Contents lists the major sections of this book with their key topics.
I.9 Conclusion to the general introduction
I hope I have given the reader a fair picture of reality. In all, from the three examples we have discussed—the MOS, the QMA, and the Mervel Farm—it is easy to see, or at least to get a gut feeling, that something in the project went wrong, could have gone wrong, or will continue to deteriorate. This emphasizes the importance of fully comprehending a project’s DNA before it takes place. This is a bit of a soothsayer work, but there are tools that we shall discover that will help us in this endeavor. The other important element that calls for attention in my three examples is the role of the stakeholders—it is nice to examine a project from a financial, marketing, or technical point of view, but in the end, it all comes down to people working together, and in the worst-case scenario, not wanting to work together because of some Machiavellian agendas.
I have defined some key concepts, examined and contrasted some expert opinions, made a brief effort at modeling, and provided concrete examples. Further sections of this book continue along these lines with a study of each of the four Ps, starting with Chapter 1 on Plans.
I.10 What we have learned about POVs: General introduction
POVs …
That are not managed impair managers’ Dominant and Contingency strategies
That are managed can help a manager to achieve success
Spell trouble down the road
Are present in any project at a minimum level of 4%–7%, in 100% of the projects
Exist within each one of the four Ps
Have degrees of gravity
Are sensitive to the triple constraints, but are mostly associated with costs
Exist in both national and international projects
Can be somewhat tricky
Are directly connected to risks
I.11 Key managerial considerations: General introduction
POVs cannot be ignored
POVs exist for each of the four Ps: Plans, Processes, People, and Power
Managers must strive for a Total strength position (Dominant + Contingency + Short strategies)
Risks cannot be assessed without assessing POVs at the same time
Endnotes
- Le Moigne (1990).
- Durand (2007).
- Website: http://www.unisdr.org/we/inform/terminology. Accessed August 13, 2015 (United Nations).
- Turner et al. (2003, p. 8075).
- Turner et al. (2003, p. 8074).
- See Chapter 6 on processes.
- Especially uncontrolled Forces of Production active in a poorly planned projects.
- Please note that I use brackets […] to isolate formulas from the text for ease of reading and understanding, and that when used for equations, again, this is meant to replace parentheses in order to ease reading and understanding.
- Website: http://documents.worldbank.org/; World Bank (2010)
- 10. By Paradi-Guilford (2013), The World Bank.
- 11. By Ministry of Agriculture and Fisheries (2011). The World Bank.
- 12. By The World Bank. Transport Anchor.
- 13. By The World Bank.
- 14. By Bagazonzya et al. (2009). The World Bank.
- La Banque Mondiale (n.d.).
- Oakley, G. Interviewed March 2nd, 2016.
- See for example Assaf and Al-Hejji (2006) for a measure of success in the case of Saudi Arabia’s projects.
- See Dalal (2012).
- See https://www.standishgroup.com; Doloi (2011).
- See Mackenzie (2011).
- Buchanan (1991).
- Morris (1988).
- In Chapter 7, we will see how the fear of missing out on an opportunity (greed) inflates a positivity bias (positive outlook or overoptimism) assigned to a project.
- Morris (1988).
- See, for example, Sauser et al. (2009).
- Assaf and Al-Hejji (2006).
- The case is real but the names have been changed.
- See http://top100projects.ca/2015filters/?yr=2015. Accessed August 1, 2015.
- See http://www.ville.Québec.qc.ca/en/webcameras/amphitheatre/amphitheatre_ensemble.aspx. Accessed August 15, 2015.
- See http://www.Québecregion.com/en/theatres-auditoriums/colisee-pepsi/. Accessed September 12, 2015.
- See https://www.ville.Québec.qc.ca/en/. Accessed August 21, 2015.
- Names have been changed.
- Deveau, J.-P. Interviewed March 1, 2016.
- Alternatively, “Propósito, Procesos, Personas, Poder” in Spanish and “Plan, Processus, Personnes, Pouvoir” in French.
- Note: throughout this book, when I want to emphasize the fact that I am referring to a concept or construct, I use a capital letter at the beginning of its name.
- Note the prime.
- See Chapters 4 and 5 on modeling.
- In fact, we will see two more constraints in Chapter 3.
- Note: To facilitate the reading, I do not transform most of the text into symbols; many equations are simply meant to be a way of illustrating the text. Most of my equations are thus meant to be a stylized expression of the core concepts being discussed.
- In statistics, a common p-value is of 0.05, or 95% level of confidence. It is the most common error allocation value used in general in marketing research, for example. This value is the proportion of false alarm that can be tolerated and that is related to a population of events or people.
- I will be using a number of similar expressions and terms in this book and will proceed to explain them and link them to existing project management theory so that the reader can easily adopt them and understand their usefulness.
- Meredith and Mantel (2009, p. 11).
- For example, PMBOK 5 (pp. 31–36).
- Mantel et al. (2011, p. 86).
- See Vidal and Marle (2012).
- Chambers (1983).
- Bogataj and Bogataj (2007). See also Schneider (2008).
- See Neuvel et al. (2015).
- Blaikie et al. (1994).
- Inspired by Buchanan (1991).
- This, of course, is subject to the context of the project.
- Tardif, P.M. Interviewed April 2016.
- Birch and McEvoy (1992).
- Frijda (1986); Lazarus (1991a,b); Levenson (1994); Ekman (1999); Keltner and Gross (1999); Kunzmann et al. (2014).
- See Nienaber et al. (2015).
- One moves more rapidly to distrust than to trust; hence, in this book, distrust is not considered in a pure sense or to be the exact opposite of trust. One may have zero trust toward someone without experiencing any distrust per se. This is why I introduce the term “negative trust” which is simply trust placed on flipped axis, as we shall see in Chapter 5.
- See Deng et al. (2014); Kelly and Adger (2000).
- Vidal and Marle (2012).
- Bogataj and Bogataj (2007).
- Inspired by The project management scorecard (Phillips et al. 2002, p. 144).
- Khodakarami and Abdi (2014).
- Hidden truths are what People know and refuse to admit, or don’t know but that still exist and infect People’s motives.
- del Caño (1992).
- PMBOK 5 lists opportunities (p. 10)—for need: market demand, business need, social need, customer request; for problems: environmental concern, technological advance (solved problem); and for sources of discomfort: legal requirement (improving life conditions). Also listed are (p. 69)—organizational needs and problems in relation to ecological impact.
- All of my studies were performed in an academic context, meaning that they followed a strict research code and had to have the clearance of an ethics committee.
- I did not have a chance to test this hypothesis but I use it as an assumption worth its while in my analyses.
- Consistency with oneself is a core tenet of my model.
- This equation revealed itself out of the analysis of my database, as we will see later in this book.
- I feel constantly referring to “Instrumentally hostile” would make the text cumbersome. So I simplify this by using two different behavioral positions: “Hostile” and “Defensive”.
- For example, a tiger will adopt a predatory position when his life is threatened by hunger, which is an internal state.
- See Chapter 6, and in particular, the section entitled “Hostile and Defensive behaviors” as well as Appendix 6.1.
- Total strengths is the sum of Dominant, Contingency, and Short strategies; these are three strategies the manager can choose to face his challenges, hence the name “Total strength position.”