p.123
BEST PRACTICES OF “INNOVATOR” TV METEOROLOGISTS WHO ACT AS CLIMATE CHANGE EDUCATORS
Katherine E. Rowan, John Kotcher, Jenell Walsh-Thomas, Paula K. Baldwin, Janey Trowbridge, Jagadish T. Thaker, H. Joe Witte, Barry A. Klinger, Ligia Cohen, Candice Tresch, and Edward W. Maibach
THIS RESEARCH WAS SUPPORTED BY THE NATIONAL SCIENCE FOUNDATION (AWARDS DRL-0917566 AND DRL-1422431).
Introduction
The Challenge of Educating About Slow Onset Hazards
Social scientists studying natural disasters distinguish slow onset events such as drought, desertification, coastal erosion, and climate change from suddenly occurring harms such as hurricanes, wildfires, and landslides (e.g., Alexander, 1999; Gaile & Willmott, 2003). In health and risk communication, similar distinctions are made between acute health hazards such as heart attacks or strokes and slow onset harms such as increasing rates of Type II diabetes, sedentary behavior, and obesity associated with poor health outcomes (e.g., Slovic & Peters, 2006; Swain, 2007). In general, people are more able to become concerned about acute harms like wildfires and heart attacks—especially when such harms affect them—than they are about slow onset hazards. That is, as Sandman (1993) noted and numerous risk scholars have also shown (e.g., Slovic & Peters, 2006), the hazards that upset people are often not those most likely to kill or harm them and the hazards that kill or harm may not be especially upsetting. To illustrate this pattern further, possible transmission of the Ebola virus in the United States received widespread media coverage even though only two people were killed by it (Ashkenas et al. 2015). In contrast, excessive sedentary behavior such as watching television or sitting at a computer increases many sources of mortality risk (Matthews et al., 2012).
p.124
Given the challenge of galvanizing concern about slow onset hazards, research on the conditions under which people do learn about these harms is especially important. One line of work in which there are intriguing findings has to do with how people learn about the gradual hazard of climate change. Climate science says that the average global temperature is increasing because of the growing amount of heat-trapping gas emitted by human activities such as transportation, heating, and cooling. This rising global temperature causes a wide array of increasingly harmful effects including flooding, changes in patterns of insect-borne disease, increased risk of extreme weather, increased numbers of dangerously hot and humid days in warm, wet regions as well as increased risk of drought in drier regions (IPCC, 2007; National Research Council, 2011).
Unfortunately, many Americans’ beliefs about climate change are currently out of step with the scientific consensus (e.g., IPCC, 2007). In one recent nationally representative survey, while 70% of Americans believed that global warming is occurring, 11% said that it is not happening, and 19% reported that they “don’t know” whether global warming is occurring or not. Additionally, only 53% correctly indicated that it is caused mostly by human activity, while 34% said they believe it is caused mostly by natural forces in the environment (Leiserowitz, Maibach, Roser-Renouf, Feinberg, & Rosenthal, 2016). A growing body of research shows that there appear to be at least five key beliefs that are highly predictive of individuals’ attitudes toward climate change and their support for taking societal action to address it: 1) belief certainty that climate change is real; 2) belief that climate change is caused mostly by human activity; 3) belief that climate change is harmful to people; 4) belief that climate change is a solvable problem; and 5) belief that most scientists agree that human-caused climate change is happening (Ding, Maibach, Zhao, Roser-Renouf, & Leiserowitz, 2011; Krosnick, Holbrook, Lowe, & Visser, 2006). From the standpoint of informal science education initiatives on climate change, these five key beliefs provide both a set of educational objectives for educators as well as a collection of important indicators for measuring the success of such efforts.
p.125
TV Meteorologists as Informal Climate Change Educators
In addition to systematically selecting important communication goals, research has long stressed the importance of strategically selecting a set of trusted messengers to communicate key messages to target audiences (Maibach & Covello, 2016). For a variety of reasons, local television meteorologists—a workforce of about 2,000 professionals nationwide—seem well positioned to act as important informal educators when it comes to the issue of climate change, and to help achieve better educational outcomes based on the key beliefs discussed above. The majority of American adults indicate that they learn about science primarily from television (Miller, Augenbraun, Schulhof, & Kimmel, 2006). Additionally, a majority of adults also regularly watch local television news and network television news (Miller et al., 2006). Since 2008, nationally representative surveys of the American public have found that most Americans trust television meteorologists as a source of information about climate change (Leiserowitz, Maibach, & Roser-Renouf, 2008). A September 2012 analysis found that television meteorologists are among the most trusted sources of information on the issue, with 60% of Americans saying they trust television meteorologists—a belief topped only by respondents’ trust in climate scientists (76%) and other kinds of scientists (67%) (Leiserowitz et al., 2012).
Bases for TV meteorologists’ credibility. But what exactly are TV meteorologists doing to be trusted? One source of their credibility is that they provide crucial information when people perceive they need it most: during storm and extreme weather coverage. As Daniels and Loggins (2007) explain, “Viewers of . . . commercial stations expect a weather forecaster to tell them when to take cover or other protective actions before it is too late. . . . Stations that ignore weather forecasters in favor of news talent may be ill-advised. Most stations in our sample chose to build wall-to-wall coverage of hurricanes around the forecaster” (p. 62). That is, local television stations are in competition for viewers. One way of winning viewers is to invest in TV meteorologists credentialed by the American Meteorological Society to provide evidence-based forecasts, computerized images of storms’ locations, and useful, informed coverage during breaking weather news.
Another source of credibility for TV meteorologists—which may be more directly relevant to educating viewers about slow onset hazards, like climate change—are factors that have been identified more generally in research on source credibility and message reception: likability, knowledgeability, and attractiveness (O’Keefe, 2015). Positive evaluations of message sources generally lead to perceptions of increased credibility of the source, which lead to greater learning of message content (Petty, Wegener, & Fabrigar, 1997). Indeed, in an experimental study, Anderson et al. (2013) found that viewers who liked a TV meteorologist learned more from an educational video about climate change presented by the meteorologist than those who did not view the meteorologist positively. As Anderson et al. (2013) noted, this finding is consistent with research on credibility of sources and message reception.
p.126
Best Practices for Informal Science Education
To guide our investigation, we drew from a consensus report by the National Research Council (Bell, Lewenstein, Shouse, & Feder, 2009) reviewing research on “best practices” for informal science education. Informal science learning environments are not school or work environments, but rather those where people choose to learn science, such as voluntarily selected television viewing, Internet exploration, visits to museums, science centers, or national parks, or play with computerized science games, and so forth. The report identified six “strands” or best practices that support science learning.
Best Practice 1: Educators engage audiences’ emotions and interests. Research shows people learn science in informal settings when learning is exciting, interesting, and comfortable; that is, the learner feels physically comfortable and stimulated but not overwhelmed. For example, Sachatello-Sawyer et al. (2002) found museums usually design exhibits for families with children rather than adults and tend to over-use didactic methods such as lectures, which adults find dull. These authors report that adults want interactive experiences that let them build relationships with fellow enthusiasts.
Best Practice 2: Learners generate and use scientific facts, arguments, and models. For example, Randol (2005) found audiences were likely to learn when encouraged to discuss procedure and control variables (e.g., what happens when you turn this wheel or, perhaps, how might warming rivers affect fish like brook trout); that is, they learn when prompted to generate and use scientific observations and information.
Best Practice 3: People learn science when focused not just on content, but also on the scientific method. Specifically, people benefit from asking questions, exploring, experimenting, applying ideas, predicting, drawing conclusions from evidence, and thinking with others. For example, scientists and some TV meteorologists encourage involvement with the Community Collaborative Rain, Hail, and Snow Network or “CoCoRahs.” Network members gather and report data on weather patterns. Taking and reporting careful measurements teaches aspects of scientific reasoning (Brossard, Lewenstein, & Bonney, 2005).
Best Practice 4: Learners benefit from understanding that science is not an established set of facts but rather involves ongoing knowledge construction. Some feel that helping audiences think about human, social, and historical processes affecting scientists confuses more than it helps. But informal science education scholars disagree. The Ontario Science Center has an exhibit, “A Question of Truth,” exploring frames of reference (sun-centered vs. earth-centered) and bias as manifested in research on race and intelligence testing. Pedretti (2004) found through assessing comment cards on this exhibit by visitors that “84% of the comments were positive” (p. 146).
p.127
Best Practice 5: People learn science best in informal settings where they are active and participate, using scientific language and tools. Studies show interactive exhibits where visitors turn dials, make predictions, and compete with one another in “races” tend to attract more visitors and engage them for longer periods of time than do static exhibits (e.g., Allen, 2007; Borun, 2003). Goldowsky (2002) studied a penguin exhibit where visitors could move a light beam at the bottom of the penguin pool, and penguins would chase it. Those who used the light were more likely to reason about the penguins’ motivations than those who did not (p. 141).
Best Practice 6: Informal science education should encourage people to like science and perhaps even enjoy contributing to it. For example, this best practice is instantiated in citizen science projects, which involve non-scientists in conducting research. A website, (www.citizenscience.org), identifies 50 articles published on citizen science projects such as reporting wildlife struck on highways or classifying galaxies. Citizen science networks support members in seeing themselves as individuals capable of science learning (Brossard, Lewenstein, & Bonney, 2005).
The NRC’s (Bell et al., 2009) six strands or best practices may be critiqued for being interrelated. For example, finding ways to have audiences be active (Best Practice 5) seems to be encouraged as well in Best Practice 2, where learners are said to learn most when they generate observations and use scientific concepts to explain phenomena to one another as well as to educators. Overlaps among the best practices, however, may not be a limitation for this study. The purpose of this investigation was to learn the extent to which TV meteorologists’ already established practices and outreach products were consistent with the National Academy’s best practices for informal science communication and to generate new questions about the most effective ways to communicate about a slow onset hazard, climate change, in an informal science education outlet, television.
Thus, we had one research question:
RQ1: To what extent do TV meteorologists’ practices, attitudes, and approaches to educating about weather and climate science align with the best practices delineated by the NRC (2009) report on best practices for informal science education?
p.128
Method
Participant Recruitment
To answer our research question, in 2009 we conducted in-depth interviews with 18 television meteorologists known to communicate climate change science. These “innovators” were identified using a snowball sampling approach, starting with several TV meteorologists known to the authors (including one of the authors, who himself was a TV meteorologist: JW), and proceeding with each person interviewed; additional suggestions were made by employees of an environmental science news service. Identification and recruitment continued until no additional “innovators” could be identified through this method. Each participant was offered $200 to participate in the study.
Of the 18 participants, 17 were from the United States and one was from Canada. Most (16) worked at local TV stations—in a range of geographic locations and media market sizes—although two worked at national channels or networks. All held a bachelor’s degree, and seven also had master’s degrees; 14 were men, and 4 were women.
Subsequent to the interviews being conducted, three specific criteria were specified for inclusion is this study. To qualify, weathercasters must have made clear in their interview that they: (a) educate audiences about climate science; (b) read peer-reviewed climate science; and (c) refrain from substituting peer-reviewed science with personal opinion. Of the 18 interviewed, 16 fit these criteria.
Interview Protocol
Interviews were conducted by phone, and were audio-recorded and transcribed. On average, interviews lasted approximately 75 minutes. Interviews explored motivations for explaining weather and climate science to television audiences, perceptions of what works well and what does not, and the extent to which interviewees enacted the best practices for informal science education described by NRC (Bell et al., 2009). A single experienced research interviewer—who is also an author of this study—conducted all interviews (PB). The interviewer was trained to use the interview protocol by conducting two practice interviews with a meteorologist and a climate scientist, receiving feedback from the first author.
Data Treatment and Qualitative Analysis
The transcripts were rendered “blind” so that coders were unable to determine the participant’s name or geographic region. Three teams of coders (seven individuals) read and analyzed the data. Each team focused on differing aspects of the interviews and used different approaches to coding. This report is guided by both sets of findings of those coding teams, whose focus was on the extent to which TV meteorologists’ practices matched the National Academy’s evidence-based best practices for informal science education. That is, we used a theory-guided version of the constant comparison method for qualitative coding (Creswell & Clark, 2007). It involved reading and re-reading both the transcripts and the coding team’s analyses to identify attitudes, approaches, or steps participants discussed when thinking about the best practices. The steps, attitudes, and message strategies reported are used by TV meteorologists in a wide range of media including community presentations, talks to school children, blogs, websites, and on-air reporting.
p.129
Results and Discussion
The 16 innovator TV meteorologists who educate their audiences about climate change do so in a variety of ways. Since they work on television, one might assume their outreach concerning climate change occurs mainly for their on-air audiences, but, consistent with Wilson’s findings (2009), they are more likely to teach about climate change during invited presentations to schools and community groups and through websites and blogs. Here are their reported educational steps followed by analysis and further questions this analysis suggests.
Best Practice 1: Engaging Audiences’ Emotions and Interests
Innovator meteorologists reported at least three ways they engage children and adults emotionally when sharing weather and climate science (Table 7.1). One approach involves using visual aids and props to intrigue and entertain audiences. Participant 1 brings a radiosonde, a set of weather instruments connected to a helium- or hydrogen-filled balloon, to his school presentations. Radiosondes are sent up to measure temperature, pressure, and humidity and send data back for analysis (NOAA, n.d.). As he notes, “Kids like balloons, and then they see this giant weather balloon. They get pretty excited about that. . . .There’s that slim chance . . . a child could find one, [so he tells children] pay close attention because one of these might land in your front yard” (156–166).
Participant 11 uses props to engage adults emotionally as he explains the science of climate change: “For one of the talks I actually took out a loaf of bread and started eating a slice of bread. (Imitates having a mouth full of food) ‘. . . just eating this slice. Sorry, I know this is rude eating in front of you, but . . .’” (4116–4120). Poking fun at himself is also a tactic for explaining the greenhouse effect and climate change in a vivid, memorable way. That is, the Earth is like a greenhouse because radiation from the sun passes through the atmosphere, heating the planet. This radiation bounces back from the Earth into space, but some of it is blocked by heat-trapping gasses, like carbon dioxide, which function like the glass roof of a greenhouse. This capturing of heat-trapping gasses helps the Earth to have an atmosphere. But excess carbon dioxide, somewhat like crust on bread or an extra blanket on a sleeper, captures extra heat, increasing Earth’s temperature. As Participant 11 explained: “You can’t just go up there and . . . give a lecture unless you’re in [a] collegiate educational setting where that would be appropriate. . . . [I use] nonverbal cues [such as chomping on bread] to make sure that they’re responding. I’m asking questions, seeing how [they are] getting what [I’m] saying” (4817–4859).
p.130
Table 7.1 Best Practice 1 Summary Table: Engaging Audiences’ Emotions and Interests

A second way several TV meteorologists engage audiences in weather and climate is by connecting the study of weather and climate to personal and professional ambitions held by their audience. For example, Participant 13, who often speaks to school groups, says:
At the beginning of the presentation I ask, “Does anybody want to be a scientist? Does anybody want to talk about the weather? Do you want to be in meteorology?” Maybe a few of the kids hold up their hands. [Then I say], “Does anybody want to be on TV?” And everybody raises their hand because everybody wants to be on TV for some reason. So I say, “What we’re going to talk about today . . . [is] how to be a meteorologist and how to be on TV.” And so those two things are very closely related because you have to know something to be on TV, you’ve got to have some information of some sort to share with people.
(4886–4899)
p.131
Participant 13 also said that “people are very eager to ask extreme questions that I maybe don’t have the answers to, and I always encourage people, I say, ‘Look up peer-reviewed science. Look up what kind of new studies are coming out.’ Because if you can get your hands on the latest information that’s coming out from the researchers, you’ll be way ahead of even what they’re talking about on television” (P13, 4945–4949). Her approach is an interesting way of both legitimizing an audience’s engagement in asking “stump the expert” sorts of questions, but also using that tendency to motivate audiences to learn peer-reviewed science.
A third way innovators manage emotions is by avoiding polarizing statements. Often, they begin their discussions by focusing on observable, not future, phenomena or by reporting science, not politics. Other times they discuss environmental policy, but do so in a positive way rather than assigning blame. For example, Participant 16 describes his region’s steps to reduce heat-trapping emissions as an approach to educating about climate change:
I think talking about our air quality on a fairly regular basis and really showing people that air quality has improved on a regular basis simply because of regulation, which a lot of people don’t want to hear, but showing that literally we have reduced the amount of emissions by more than half since the ’80s, for example, just purely based on how we make our cars.
(5956–5962)
As Wilson (2009) reported, some participants prefer to discuss climate science in community or school presentations; that is, in face-to-face settings rather than on air because face-to-face settings are contexts where they are invited to speak. In such a context, there is less likelihood of personal attacks or heightened emotions that could harm the chances of learning.
Further questions. The NRC (Bell et al., 2009) consensus report says learners need sufficient emotional engagement to want to learn science in informal settings but not so much stimulation that they feel overwhelmed. To engage their audiences, interviewees use visually intriguing props, appeals to audiences’ interests and goals, and avoidance of polarizing statements. These tactics may have successfully assisted in providing sufficient, but not excessive, emotional engagement in why the climate is changing. Their use suggests that health and risk educators communicating slow onset hazards should explore:
What are the emotional conditions that encourage or discourage interest in slow onset health and risk hazards?
p.132
Best Practice 2: Explaining Key Science Concepts
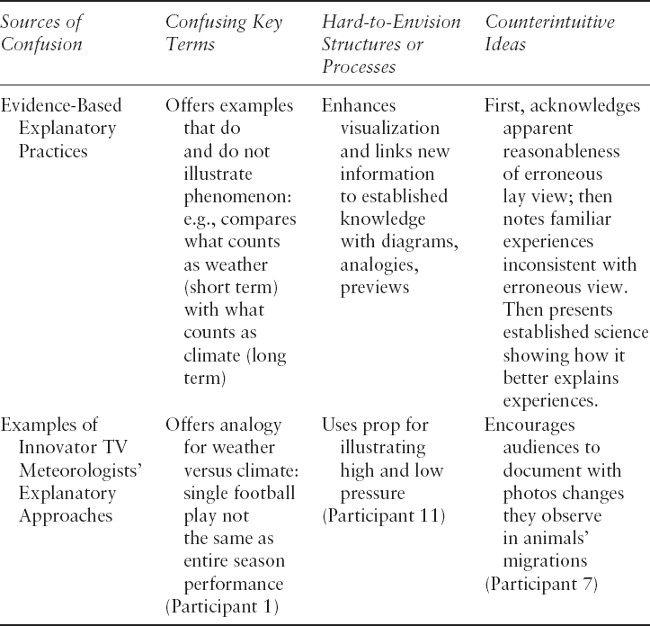
NRC (Bell et al., 2009) does not offer a taxonomy of the types of scientific explanations learners generate in informal settings. To supplement that portion of NRC (Bell et al., 2009), we drew from Rowan’s theory of explanatory discourse (1988, 1990, 1999, 2003), which identifies three classic sources of confusion in learning complex subjects and evidence-based steps for addressing each. Although we were unable to examine audiences’ abilities to generate scientific concepts and information, we wondered whether TV meteorologists used steps similar to the approaches identified in research on explaining. Steps for addressing each difficulty are tailored to overcoming each type of confusion and are listed in Table 7.2’s second row. Interestingly, as Table 7.2’s third row illustrates, some innovator TV meteorologists discussed each confusion source but address these confusions with a range of tactics, sometimes tapping evidence-based approaches and sometimes using alternative approaches.
Table 7.2 Best Practice 2 Summary Table: Explaining Key Terms, Structures, Processes
p.133
Distinguishing related concepts. Participants offered several tactics for helping audiences “break apart” related notions such as climate versus weather or event versus trend. Here is Participant 1’s approach to teaching audiences the climate versus weather and trend versus event distinctions:
P: [It’s] actually not a difficult stretch to go from weather to climate. Well, weather first being a short-term, fast-changing, then climate of course being much longer term. . . . I’ll use [a football] analogy. . . . Weather is to climate as one play in a football game [is] to the entire season for all the teams. [You] can’t decide that . . . this weather event means that we’re having global warming, or it’s because of global warming that this tornado occurred. That’s absolutely not correct.
(221–229)
Continuing his analogy, and reinforcing the distinction between a trend and a single event and the sorts of conclusions one can draw from single events as opposed to trends, Participant 1 says:
P1: But . . . just because the greatest player in the league struck out doesn’t mean, or threw an interception, doesn’t mean they’re not the greatest player in the league over the long term. And that’s the way you kind of have to look at it, because it’s too often that people would say, “Well how’s it climate change, it was 10 below zero this morning, it can’t be global warming.”
(231–234)
Using visualization to help audiences build simple mental models of complex structures or processes. Frequently, scientific accounts of complicated structures and processes are difficult to understand because their many parts or steps overwhelm the audience. If there are too many steps or processes, learners cannot find a simple way to visualize these phenomena, just as one might find a photograph of an anatomical part hard to understand and wish to locate instead a simplified diagram (Mayer, Bove, Bryman, Mars, & Tapangco, 1996; Rowan 1988, 2003). Several TV meteorologists recognized this challenge and described steps to assist visualization when they educate about climate change. For example, Participant 11 says:
P11: So I developed this technique to use one of the props . . . which is a kids’ squishy ball. . . . . I use [that] to represent the bulging ridges of high pressure.
(4110–4112)
p.134
Participant 11 makes an unfamiliar phenomenon—bulging ridges of high pressure in the atmosphere—familiar by squeezing a child’s toy ball and noting that the bulge created when the ball is squeezed is similar to what is occurring in the atmosphere with increasing levels of heat-trapping gasses.
Countering erroneous notions. Two techniques were used to counter erroneous notions. Some participants use visualization techniques to counter erroneous notions or unscientifically supported lay views. For example, Participant 5 discussed using a graphic to explain why, in spite of local weather variation (e.g., cool in some spots, hotter in others around the globe), there can still be an overall trend of global warming:
P5, T22: On television . . . you have very limited time. And you can’t go into detail on anything. But what we can do in a picture is worth a thousand words. So when, for instance, like last month, we at National Climate Data Center released the global temperature anomalies for the whole planet in June, July, and August. The oceans were the warmest on record. And they produced a great graphic that showed that with dots . . . the bigger the red dot on the map, the more the temperature was above normal.
P5, T23: And most of the Midwest had a very cool summer this year, so even in [our state] I’d get [people saying], “We had a cool summer. What happened to global warming?” So I put that map up there on air and said, “Okay, now look at this. If you think it’s been a cool summer, if you live in the Midwest in Denver or say North Dakota, it has been a cool summer, but look at the rest of the world. This is the temperatures for June, July, and August across the entire rest of the world, and it was way above average.”
An important aspect of visualization techniques such as props, analogies, and graphics is that they function as “bridges” (Ausubel, 1978). That is, they link familiar, concrete, and tangible ideas to less familiar ones, rendering the newly introduced and less-familiar information more accessible and plausible. Photographs of glaciers shrinking over time (i.e., comparing glacier size near the beginning and the end of the 20th century) may function both as intellectual bridges and as compelling exemplars. Participant 5 reported his use of such photos:
P5, T32: There are still a lot of people who don’t even believe the planet is warming. I mean, I mean a lot of people. Of the people that are really skeptical on climate science, I’d say 60, 70% of them don’t even think the planet’s getting any warmer. And so what I have shown . . . is that USGS has an incredible array of photos—based on before and after—taken from the same spot of glaciers around the planet. And I will throw those on at the end of a weathercast or put them up on my blog.
p.135
Participant 5 is also taking steps to render his explanations accessible by placing them in a variety of media. He discusses US Geological Survey before-and-after photos on the air, on his blog, in slides that are accessible through his website, and in presentations.
Several TV meteorologists reported countering erroneous notions by showcasing data from the past and emphasizing its status as already occurring phenomena rather than events predicted for the future. For example, Participant 6 said:
P6, T50: [One] of the things that I talk about in the blog [is that] this [change in precipitation patterns from gentle rains that benefit crops to droughts and extreme downpours that do not] is not a computer projection. This is based on observation [italics inserted]. This was collected from the Global Precipitation Climatology Project. And it is covering a period of time from 1979 to 2007.
Similarly, Participant 7 encourages viewers to send her photos documenting environmental changes they have observed in their lifetimes, such as animals washing up on beaches in recent years that viewers do not recall seeing in their childhoods in the same locations, or photos of sea ice and glaciers that were considerably larger in their youth than in their adulthood. She incorporates these photos into slide shows that she shares at community presentations.
Further questions. Innovator TV meteorologists reported awareness of each difficulty noted in Rowan’s (1999, 2003) taxonomy and offered intriguing steps for addressing them. For the most part, their steps were informed by intuition and experience rather than formal training. Some tactics such as analogies and visuals may be especially effective because they report using them frequently. It would be interesting to see if these innovators could be even more effective with exposure to brief educational materials alerting them to research on steps they already take and on other techniques backed by research but not used by the innovators. Further, the NRC best practices emphasize the value of learners explaining science to one another, not solely having experts handle all explaining. This peer-to-peer explaining occurs in museum settings, classrooms, and online interaction. Questions for further work are:
Would formal training in explanatory strategy assist health and risk educators in explaining the complexities of slow onset hazards to lay stakeholders?
p.136
What social conditions support learners in explaining complexities of slow onset health and risk hazards to one another in face-to-face interaction or online?
Best Practice 3: Encouraging Audiences to Learn Scientific Methods and Reasoning
Best Practice 3 encourages informal educators to help audiences learn not just scientific results, but also the scientific methods that lead to results. In this study, innovator TV meteorologists were asked whether they helped audiences think about the scientific method, evidence, hypotheses, and how scientists test an idea in any context, but particularly in the context of climate change science.
Answers to this question were mixed (Table 7.3). Some said they do not cover the scientific method in presentations for schools or community and professional groups. For example, Participant 2 said, “When I talk about the climate models, I’ll explain, for example, how the scientist tries to design these computer models that predict climate. I think that there are parts of the discussion that probably do discuss the scientific method, but I don’t give the presentation with the goal of demonstrating the scientific method, if that makes sense” (49–54). Others said they do not help audiences to think about the scientific method, but were intrigued with the idea of doing so. Said Participant 7: “No, but I’m interested in being a better weathercaster, so maybe I should.”
Those participants who said they do teach the scientific method take one of two approaches. Either they said that this step is essential, or they said that teaching aspects of the scientific method is not their principal goal, but likely an indirect effect of their presentations, discussions, or materials. Table 7.3 illustrates their approaches to teaching audiences about the scientific method. In the first group was Participant 5. Describing his websites for teachers and students, as well as his presentations, he said:
Table 7.3 Best Practice 3 Summary Table: Encouraging Audiences to Learn Scientific Methods and Reasoning

p.137
I start with what science is, and what a theory is and what the definition of science is. I also run through things so they know . . . what isn’t science, and what is science. And questions that science can answer. And I talk about, you know, religion is not a question that science can answer, because that’s based on a belief system and science is based on testable evidence [italics added]. And I also point out to them that just because science can’t answer it doesn’t mean something’s not true. It just means it’s not science.
(133–148)
Similarly, Participant 9 said: “That’s one of the key things that I talk about. . . . If I talk about how scientists do their job, . . . I’ll usually say, ‘Okay, what’s the first thing that you do? And we sort of guide them through things that they do that are basically showing that they’re applying the scientific methods themselves, they just don’t recognize it” (408–415).
In the second group were innovators who illustrated ways in which they demonstrate scientific reasoning that underlies weather forecasting or supports an anthropogenic explanation for climate change in the current era. Said Participant 4: “I definitely touched on it as well as the issue of certainty and uncertainty, which is what we call probability in our daily forecast. That what’s happening has high certainty, but it doesn’t have 100% certainty” (123–127). Another, Participant 13, illustrated her teaching technique, which involves prompting elementary school students to reason as scientists: “For example, [I ask students], ‘What do you think happens with the sun? How does that work? Does it really heat the earth? Or does it heat the air?’ I mean I try to give them an opportunity to come up with their own guess, and then I don’t just give them the answer right away. I say, ‘Here’s some evidence, let’s think about it. Now let’s, let’s say what do you think the answer’s going to be?’” (469–473). Additionally, she explains the reasoning underlying her forecasts:
p.138
We don’t just come up with a conclusion of what it’s going to be like by hitting the dart board, or stealing the forecast from NASA weather services. We come up with our own work every day. And the way we do that is, we sit down with a piece of paper, and we draw out what the week is going to be, what highs and low we think we’re going to have, and we base this on the computer models and the satellite and radar imagery. . . . So, I do go through some sort of . . . conceptualization of how that works without really saying, hey this is science, and here’s the hypothesis, and here’s the conclusion.
(488–498)
Participant 15 noted that when an audience member objected that, in prior decades, scientists have said there is evidence of global cooling, not warming, he showed slides comparing and contrasting simulated climate models with models based on observed data. He showed one audience that these models match well, until they remove increased carbon dioxide in the simulation. When that step is taken, one sees that the last 30 years should have been cooler than they have been, he said. Participant 15 emphasized that the models were not the work of a few individuals, but rather “a whole bunch of different simulations. It isn’t one person’s idea; I said this is an average of a whole bunch of models for differing simulations. They’ve all converged to this idea. . . . And they [the audience] got fairly quiet. I didn’t have a lot of people saying, this is a bunch of hooey. . . . I think I convinced them. . . . I had stuff. I had pictures with me on my person to show them that I’d given this some thought” (560–596).
Perhaps this response is one of the clearest instances where an innovator reported a step-by-step argument, describing evidence for the claim that climate change is associated with increased heat-trapping gasses in the atmosphere. This participant reminded his audience that there were not just a few people making this argument, that instead there were multiple models converging on the same conclusion, and that conclusion led to the claim that increased levels of heat-trapping gasses being emitted by human activities is the best explanation for why global temperatures have risen at an alarming rate over the last century.
Further questions. Many of the innovators were either emotionally supportive of or already taking steps to involve their audiences in the reasoning and methods underlying scientific findings. Their apparent success with explaining scientific methods and connections between evidence and claims suggests these steps may be helpful in many contexts where audiences choose to learn science. Further questions for research raised by their responses are:
In what contexts are people most interested in learning scientific reasoning and methods?
How might experiences using scientific tools affect emotional engagement with and understanding of slow onset hazards such as climate change?
p.139
Best Practice 4: Helping Audiences See Scientists and Scientific Institutions as Fallible
According to NRC’s (Bell et al., 2009) fourth best practice, informal contexts are most apt to encourage science learning if science is not presented as coming from an infallible source, but instead as a human, fallible, and social process. This means that presentation of scientists as people with flaws and strengths is helpful to science in the long run, and that lay audiences benefit from learning about processes for adjudication of claims in science, such as peer review.
Perhaps because of the challenges associated with communicating about a politicized science topic, innovators interviewed for this study responded in several ways to the question of whether they communicate the fallibility of science and the mechanisms for managing error. As summarized in Table 7.4, there were some who discussed how they encourage disagreement as people learn about any scientific topic. Others talked about their concerns regarding the scientific credentials of some of their fellow TV weathercasters. Still others discussed their approaches to climate change skeptics who are informed by advocacy groups, but not informed by peer-reviewed research.
Some participants explained that they explicitly teach audiences about peer review and its importance to scientific progress. Participant 5’s website, designed for teachers and students in the English-speaking world, says, “Peer review is how scientists argue,” (153) and this sentence is followed by a brief explanation of the essential role peer review plays in science. Similarly, Participant 1’s endorsement of encouraging disagreement is emphatic and consistent with ethical theories of communication such as that of Habermas (Burleson & Kline, 1979). Habermas argues that ethical communication occurs when social conditions allow only the “force of the better argument” to be a consideration in deciding the merits of a claim, not concerns about power or consequences. Asked, “But do you address the fact that even within the field that there can be discussion and differing opinions, and that that’s a healthy part of the process,” Participant 1 said, “ Oh, yeah, absolutely. It’s very healthy. There’s nothing wrong with people being skeptical about things because hopefully that makes you think deeper and not be so convinced, oh, I’m absolutely right, I don’t need do anything anymore” (14–18).
Table 7.4 Best Practice 4 Summary Table: Portraying Scientists and Scientific Institutions as Fallible

p.140
Participant 5 also comments on the usefulness of peer review in settling scientific disputes. He says, “In science . . . one of the good aspects of peer review, is once something is settled, then you just can’t keep bringing that question up over and over. If you want to get your paper published, you need to provide something new. If you just say, ‘No, I still am right,’ your paper is not going to get published” (143–153).
Still others commented on the joy of science being the process of disagreeing and discovery. Participant 6 said: “Science is not just a monolithic thing, it’s very dynamic. That’s one of the things that I think that scientists enjoy. It’s like detective work. They enjoy exploring and finding the truth, and they will debate you to the nth degree if they think they’re right. But it always comes back to the facts. What is debated is not the facts, but the interpretation of those facts” (164–169).
A few respondents discussed an internal professional debate on credentials for TV weathercasters. There are science-based programs throughout the world where students study meteorology and can be certified as meteorologists. However, television companies will also hire some individuals who obtain a bachelor of arts or an associate of arts, rather than someone with a grounding in science. Participant 8 commented on this situation saying: “[These individuals] don’t have the true degree in science. It’s not a bachelor in science. It’s a bachelor in arts. Or it’s an AA or it’s simply a certificate that allows them to communicate weather information, and the AMS [American Meteorological Society] decided years ago to recognize this group, that doesn’t have the physics- and calculus-based true bachelor in science degree” (312–315). He continued: “I understand if the morning weather anchor in [city] is going to be a pretty girl who wears tight sweaters, because it’s the reality of what TV is, okay?” (348–350).
This debate over who should be a TV meteorologist is an important part of the conditions outlined in Best Practice 4. This best practice says that audiences should learn about the flaws and strengths of the people who do science as well as the flaws and strengths of social institutions like the AMS. Encouraging public discussion of a professional debate of this sort is not easy, but in the long run, according to NRC (Bell et al., 2009), airing of such matters is apt to enhance stakeholders’ abilities to learn from science and to trust scientists because it casts scientists as people with both strengths and limitations.
p.141
A third way interviewees responded to this question about discussing the fallibility of scientists and scientific institutions was to illustrate ways they manage advocacy groups who insist that global warming is not occurring or is occurring but is not caused by humans increasing the amount of heat-trapping gas pumped into the atmosphere. Participant 2 said:
There are some very prominent [groups] in expressing those opinions and putting their opinion out to the public. They are very well-funded. That’s why there’s still some confusion among the public. . . . If you go back fifty years or so when the very first medical studies came out that cigarette smoking made you predisposed to a number of health risks and conditions, when those first studies came out, there were doctors that said “No, that can’t be.”
(45–53)
Further on, Participant 2 said:
So in the same way that there was a social aspect of the smoking issue with society, it’s kind of the same thing with this issue, in that people talk about if you’re going to do something about global warming there’s going to be ramifications. Now I don’t get into so much of the policy ramifications [in my community talks and talks with professional groups], I only talk about the science of global warming, but inevitably someone will ask a question, and you know I’ll have to talk about it, but I don’t go with the goal of talking about policy, so maybe there is a social [and] economic component to this, but the analogy is to the cigarette smoking issue (70–75). . . . I don’t always agree with the policy recommendations, but I don’t get into that in my talks.
(98–99)
Participant 2’s view was that some of the skepticism about climate change is a function of funded efforts to generate such skepticism. This sort of skepticism may differ from the questions and disagreements scientists and others thinking about the science of climate change might express when trying to make sense of the extent to which studies support scientific claims.
Participant 2’s comments on advocacy groups that promote skepticism about climate change science are consistent with the comments of other innovators interviewed for this study. They discussed the importance of helping audiences reflect on the differences between facts and opinions as well as between science and policy, and on reasons to take the science of climate change seriously, while still acknowledging uncertainty in its findings. For example, Participant 10 said:
p.142
The interesting thing is that, some of the preeminent scientists who were first looking at this . . . pronounced [that this] warming would take place at higher latitudes. And indeed, that’s what’s being observed. So the, even with the uncertainty, the observations of what appears to be taking place with the climate system, which is not just the air, it’s the land, it’s soil moisture, it’s the oceans, . . . [are consistent with the predictions].
(5415–5420)
Further questions. The notion of explaining the fallibility of science was daunting to some of the innovators. Some felt it best to stay focused on facts and not discuss ways the science of climate change might be wrong or its proponents might be individuals with human frailties. But others clearly accepted and even relished this task, saying that laypersons needed to understand that scientific argument among scientists is a healthy thing, an inherent part of good science. They also thought laypersons needed to understand the essential role peer review plays in adjudicating disagreements among scientists. Further questions suggested by the innovators’ responses are:
Is learning about specific climate scientists as individuals, their life stories, failures, and triumphs, associated with deeper understanding of climate science?
How does learning about scientific failures in the study of slow onset hazards such as sedentary lifestyles, nutrition, obesity, and climate science affect understanding of these hazards? How does it affect attitudes and behaviors associated with them?
Best Practice 5: Support Audiences in Being Active as They Learn Science
Participants reported two ways in which they created conditions for audiences to be active, not solely listeners or readers, when learning weather and climate science. As illustrated in Table 7.5, the first approach involved welcoming and encouraging communication about weather and climate from audiences. Several participants said that the simplest of steps, beginning a talk with students or an adult group with a question about the day’s weather, typically yielded response. For example, Participant 3 said, “When I walk in, especially with kids, I’ll say, ‘What’s the weather like outside?’” (75–76). Participant 6 encourages comments and questions about items he posts on his website. He said: “Look. Don’t worry about whether you’re wrong or not. Go ahead and respond. Because it’s the only way I know what you perceive to be the truth, and I can’t correct that thinking if I don’t know what it is. So I’m encouraging people to comment [on materials posted to his site], and they do think that they know a lot about the science” (218–222).
p.143
Table 7.5 Best Practice 5 Summary Table: Inviting Audiences to Be Active as They Learn Science

The second approach involves creating activities for data gathering and reporting. Several interviewees noted the popular program, “CoCoRahs,” [Community Cooperative Rain, Hail, and Snow Network], where volunteer weather observers measure rain and hail near their homes, sending their data to scientific organizations and local television stations. Participant 5 said, “Any time an adult or a kid or a teacher says, ‘What can I do to get my kids interested,’ . . . I say, ‘I can get you a great project for twenty-nine bucks. Go get a CoCoRahs gauge, put it out there . . . and it’s real science because that data is really helpful. It’ll be collected for a hundred years, and we’ve got several students using it now, and several classes using it” (137–141).
Participant 9 noted that his station has dozens of schools participating in weather watching activities: “We started out in [year], with 10 different school-based weather observation sites. And I think we’re up to probably close to 160 right now” (292–293). Participant 18 focuses on collecting weather emergency information: “I’m a great advocate of Sky Warn. . . . We will encourage students and parents and families to become Sky Warn trained and to provide weather” (485–487). Participant 13 discusses a weather watching program and activities he created:
We have a Weather Watcher program which they can email us . . . pictures. They can email us their storm report. . . . I created on [name].com a series of experiments for kids, basically making a thermometer from recycled materials, making a wind gauge, you know that kind of stuff. . . . I’ve also designed two weather activity books for kids. One’s a basic weather activity book and the other is how science and baseball are related.
p.144
(379–380)
These participants seem aware of the way hands-on learning engages audiences in science, and in the case of Participant 18 especially, makes them more alert to weather emergencies. They also see the marketing potential for television stations: involving dozens of schools in reporting weather data to a station is one way to enhance station visibility.
Some use activities to teach aspects of climatic change, such as documenting the times when flowers bud or birds arrive, and whether those times are changing. Participant 9 says: “Oh, what they call phenology, and that sort of thing. . . . And very often I’ll make that part of a . . . Weather Minds question because it’s just one of those nice teachable moments” (317–323). By “Weather Minds” he means an opening segment for his on-air weather report where he fields viewer-sent questions about, for example, why avalanches are occurring, whether trees are budding earlier, or other topics that teach viewers about regional weather and climate conditions, especially conditions relevant to outdoor recreation.
Further questions. Innovators were almost uniform in their support for finding ways for learners to be active by asking questions, using instruments, or becoming citizen scientists. Their intuitions and experience supported the benefits of having audiences be active, rather than solely listening, as they learn about a slow onset hazard. Their responses lead to the following questions:
Are some forms of active involvement in learning about a slow onset hazard more emotionally engaging and more likely to deepen scientific understanding than others? That is, do people gain more from asking questions, using scientific tools, observing phenomena in the field, or coding data?
When active involvement involves asking questions, drawing inferences, and peer-to-peer explanations of science—rather than using scientific tools or coding data along with scientists—to what extent do such experiences deepen understanding and affect attitudes about slow onset hazards?
Best Practice 6: Encourage Audiences to See Themselves as Scientists
Best Practice 6 involves encouraging audiences to see themselves as people who like and can contribute to science. As illustrated in Table 7.6, several participants encourage such identification and feel gratified when audience members report feeling that they identify with the TV meteorologist or take pride in their (the audience member’s) ability to learn science.
p.145
Consider, for example, Participant 13’s response when asked, “Do you think it [your action] encourages them, those individuals to see themselves as scientists?”
I hope so. I mean sometimes when the kids write back, you know they’ll say, I know what a front is. I think that that once kids have . . . a direct connection to somebody in some field, they think they feel a lot more a part of it. Definitely adults talk about it, if they’ve met you and . . . they have had an intimate time with you to talk about something. All of a sudden they know exactly what you know.
(560–570)
Similarly, Participant 4 and Participant 16 report that they believe everyone is a bit of a scientist.
[P4]: I get a lot of people who say that they always had some sort of interest in science, but either the math got in the way, or life got in the way, or something happened where they just didn’t pursue it, so I’m thinking there’s a little scientist in everybody.
(126–129)
Table 7.6 Best Practice 6 Summary Table: Encouraging Audiences to See Themselves as Scientists

p.146
[P16]: Oh sure. Especially when we talk about the need to have a thermometer, rain gauge of your own. That’s exactly what I’m trying to send across the message that anyone can be—and is—a scientist. And if you’re ever curious about anything, then you’re already asking the right questions, and you’re already going in trying to prove [your] own thoughts and theories.
(643–652)
Being scientific is generally viewed as a sophisticated state, a role in which one can take pride. Research shows that people value friends for their provision of ego and emotional support (Burleson, 2003), and if a TV meteorologist such as those interviewed in this study encourages an audience to take pride in their inherent curiosity and enjoyment of learning science, and treats them as friends, worthy of one-on-one, respectful interaction, that experience may lead to the audience feeling proud of themselves and motivated to learn science.
A second way in which innovators encourage identification with science, weather observation, and sometimes climate science is by celebrating or recognizing scientific contributions and accomplishments by audience members. For example, several interviewees discussed programs that involve schools, sometimes hundreds of schools, in sending observational data (measurements of temperature, rainfall at the schools’ locations) to the television station. Those contributing data to the television station are recognized on the air. Their school names may be listed in the crawl text that runs during weather reports. Another innovator gives school science fair winners recognition from the American Meteorological Association and rewards high school valedictorians with gifts of sophisticated calculators. A third recognizes and respects viewers by engaging them in what he terms “intelligent conversation” through a blog that reports peer-reviewed science with regional implications. He said:
[P5]: They love the fact that I will engage them in the conversation [when they comment on his blog and he responds]. Now, part of it may be the fact that I’m on TV. But if you look at the comments closely, you’re going to see that the sense I get from the comments is, they’re hungry for a conversation. They’re hungry for an intelligent conversation. They’re not hungry for a lot of the positioning that’s taking place.
(215–219)
A third way in which TV meteorologists encourage identification with science is to help audience members learn steps for becoming a scientist or doing science. This tactic, known as enhancing a person’s sense of efficacy, or perceived ability to do a task, is important because when people feel efficacious, they are more apt to address problems (e.g., Bandura, 1986; Witte, 1992). Some TV meteorologists explicitly encourage viewers to believe in their ability to do science. Says Participant 5:
p.147
You can do science yourself. You don’t have to be in a lab coat and have a PhD to do science. I did a blog awhile about how astronomy and meteorology are the two greatest sciences with the highest number of citizen scientists involved.
(153–158)
Participant 1 tells school children:
If you want to be the type of meteorologist that would fly into the eye of a hurricane or chase tornados or go to the South Pole . . . it’s really important that you have to be studying your science and your math. And even at the second grade level, they get this. If you’re not very good at it, work with your teachers to get better.
(11–14)
In summary, a number of TV meteorologist innovators who share climate science sense that their audiences like science and like learning, but feel somewhat intimidated by science. They address these feelings by providing emotional support and advice, with some explicitly encouraging audiences to recognize their inherent curiosity as a scientific trait and to get involved in scientific activities such as measuring rain fall and reading blogs that summarize peer-reviewed climate science. They also encourage audience members to study math in school and get involved in citizen science activities outside of school or work.
Further questions. The innovators generally like the idea of encouraging audiences to notice that they (the audiences) enjoy learning scientific information and processes and may think like scientists in some contexts. Several use this approach in their educational efforts to encourage mathematical skills and love of learning, assets important for professional success in science and other fields. Their responses suggest these questions for further research:
Under what social and educational conditions do people come to view themselves as individuals who enjoy science and would enjoy contributing to science?
Does enjoyment of science and viewing oneself as someone who likes science, across their lifetime, lead to understanding of slow onset hazards reported in traditional media?
p.148
Summary: What Did We Learn From Innovator TV Meteorologists?
From in-depth, theory-guided interviews with TV meteorologists already educating audiences about climate change in 2009, we learned—to a greater or lesser degree—these innovators are embracing the NRC best practices, or are open to embracing them, although few are currently using all of them. This offers some face validity to the findings of the NRC report, and it suggests that these innovators’ climate education efforts are likely having a positive impact (though their efforts are almost certainly informed more by their intuition, their willingness to take risks, and trial and error, than through any formal training).
Beyond the questions generated by responses to specific best practices, the NRC (Bell et al., 2009) framework as a whole may be helpful for addressing slow onset hazards. That is, risk perception and risk communication research indicates that adults feel ambivalent about being educated on health and environmental risks. On the one hand, as Douglas and Wildavsky (1983) argue, society itself is organized to protect people from dangers such as wild animals, enemy combatants, starvation, and so forth. On the other hand, research in interpersonal communication shows that adults do not like unsolicited advice (e.g., MacGeorge, Feng, & Thompson, 2008). Therefore, those who educate about slow onset hazards, even when there are compelling reasons to do so, need to communicate carefully.
The best practice framework places considerable emphasis on getting audiences to think with an educator, not simply listen and accept. Interviewees’ responses to questions about whether they discuss the scientific method and whether they discuss the fallibility of science were particularly illuminating. A number of interviewees embrace these ideas. That is, several reported that they do teach the scientific method to their audiences (i.e., Best Practice 3) by encouraging observation of changes in animals’ migration patterns or shrinking glaciers and by encouraging audiences to make observations or use scientific instruments like rain gauges.
Not all participants are comfortable inviting audiences to think about the fallibility of science, particularly when educating about a politicized topic like climate change, but several embrace this ethic. Recall Participant 5, whose website, designed for teachers and students in the English-speaking world, says, “Peer review is how scientists argue,” (153), and several other participants who said disagreement is healthy and essential in science. Why might such a stance contribute to the effectiveness of a slow onset hazard communicator? Although it makes that educator’s job difficult in some ways, it also invites the audience to see scientists as people like them, not infallible entities to be resented, but professionals worried about problems and trying to find ways to address them. Clearly, there are contexts when debating climate science with climate science deniers is a futile exercise, but recall that 70% of Americans say global warming is occurring, but many are unsure about why (Leiserowitz et al., 2012, 2016). This suggests that most audience members are not deniers, but are also not especially informed or emotionally engaged with this topic. These conditions indicate that education about the fallibility of science and about methods for adjudicating claims in science may, over time, be a way of educating and engaging audiences in how climate change matters in their region.
p.149
Finding ways for audiences to be active makes learning enjoyable. The new media environment increasingly shows that people enjoy being message senders as well as receivers, and they like environments where they are active in some way, whether the activity involves blogging, functioning as a citizen scientist, or taking a nature hike to study coastal plants and erosion. Best Practice 6, which encourages people to see themselves as individuals who like science, is a welcoming and flattering message strategy. Rather than setting up an “us versus them” context for learning about a hazard or insisting that only scientists know what counts as a danger, it invites audiences to learn more because they are scientist-like themselves. As Participant 5, says, “You can do science yourself. You don’t have to be in a lab coat and have a PhD to do science.” Interestingly, Kahan (2015) maintains that an adversarial context can be created simply by uttering words such as “climate change” or “vaccination.” For some, these words signal that people with an interest in such topics have little interest in their group’s needs and values. Encouraging people to become involved in community-relevant scientific concerns and the joy of scientific activities may help to de-politicize controversial science topics.
Linking This Study of the Innovators With Current Findings
In the few years since these interviews were conducted, there has been a significant shift in the views of TV meteorologists about climate change (Maibach et al., in press) and a marked increase in the number of TV weathercasters who are embracing the role of local climate educator (Maibach et al., 2016). This has occurred in part by building on the insights offered by these innovators, in part by leveraging their positive role modeling, and in part through systematic efforts of universities, government agencies (i.e., NASA and NOAA), AMS, and nonprofit organization Climate Central to make it easier for weathercasters to embrace this role through the provision of timely, localized information and broadcast-ready graphics (Placky et al., 2016). Climate Central develops content for TV meteorologists to use in their broadcasts, social media, and community presentations. For example, its team of meteorologists, research scientists, data analysts, journalists, and graphic designers is able to localize climate change stories and develop graphics effective on television and in social media for sharing this information. Climate Central analyzes data from NOAA and NASA and distributes it widely. These data show warming trends throughout the United States have accelerated since 1970 (Samenow, 2012). Articles like Samenow’s that highlight relevant information for readers of his publication (Washington Post) are apt to get attention because of their emphasis on hazards with local impact.
p.150
Implications of best practices for evolving media. There can be a tendency to adopt new technologies because they are new, rather than tapping a clear conceptual framework for why one might use new tools such as blogs, interactive graphics, animations, or compelling video as opposed to more traditional efforts such as news stories or nature hikes. The NRC (2009) best practices provide guidance for considering why one might want to use, for example, a cartoon one can share online versus creating an instructional activity, as well as what one wants to communicate about a slow onset hazard. TV meteorologists have frequently noted that constraints on the length of on-air segments hamper efforts to explain complexities (e.g., Wilson, 2009). The NRC (2009) best practices alert users to several key conditions that help audiences enjoy scientific material, learn complexities, and feel motivated to learn more, even when material is presented in short on-air formats. For instance, this framework says segments that encourage audiences to be active by participating in the methods of science, not just hearing about results, intrigue viewers. It also says casting audiences as people who like science encourages engagement with scientific material. Future work should explore the effectiveness of teaching the NRC (Bell et al., 2009) best practices to interdisciplinary teams comprised of natural scientists, social scientists, science educators, and communication professionals. Evidence of the effectiveness of interdisciplinary science communication teams is available in Zhao et al. (2014). These scholars showed that a series of explanatory videos developed by Climate Central and presented by chief TV meteorologist Jim Gandy (CBS affiliate, WLTX, Columbus, SC) increased understanding of the regional effects of climate change among CBS viewers over a one-year period. CBS viewers were more knowledgeable about the harmful effects of climate change (e.g., more high heat, high humidity days; more illness-inducing pollen in the air) than were viewers of the other major networks, the comparison groups.
Limitations
This study explored ways that innovator TV meteorologists approach the task of communicating about a complicated, slow onset, politically contested societal risk—climate change—in 2009, a time when relatively few TV meteorologists were educating audiences about climate change’s impacts. One limitation is that its theory-guided qualitative methods allow generation of further questions, not findings. Another is that the sample size (16) is small.
p.151
Conclusion
Studying best practices for educating about slow onset hazards in this evolving media environment is one of the more important goals applied communication research can pursue. Communicating the ethics and methods of science by inviting audiences to be active and scientist-like may be an effective approach to gaining stakeholders’ interest in slow onset hazards. We show through interviews with 16 innovator TV meteorologists, studied in 2009, that they, in general, either agreed with or already used many evidence-based best practices for effectiveness in informal science education contexts, such as television. However, they may benefit from formal training in these best practices.
Current approaches to informal science education may unduly emphasize insistence on scientific conclusions without sufficient opportunities for stakeholders to consider scientific methods, failings, systems for fixing error, and contexts where stakeholders can actively reason with and even conduct research with scientists. TV meteorologists, like many other science communicators such as resource managers, extension agents, park rangers, physicians, health communicators, docents, journalists, commentators, and bloggers, as well as scientists in other fields, may be able to draw from the National Research Council’s (Bell et al., 2009) best practices for guidance on involving audiences in learning science. Such steps may engage audiences emotionally and encourage them to learn more about slow onset hazards that are seemingly distant but often harm or kill more so than do acute harms to which people more easily give attention.
References
Alexander, D. E. (1999). Natural disasters. Dordecht, Netherlands: Kluwer.
Allen, S. (2007). Secrets of circles summative evaluation report. Report prepared for the Children’s Discovery Museum of San Jose. Available: www.informalscience.org/evaluation/sow/115 [accessed October 2008].
Anderson, A. A., Myers, T. A., Maibach, E. W., Cullen, H., Gandy, J., Witte, J., Stenhouse, N., & Leiserowitz, A. (2013). If they like you, they learn from you: How a brief weathercaster-delivered climate education segment is moderated by viewer evaluations of the weathercaster. Weather, Climate, and Society, 5(4), 367–377.
Ashkenas, J., Buchanan, L., Burgess, J., Fairfield, H., Grady, D., Keller, J., Lai, K. K. R., Lyons, P. J., Murphy, H., Park, H., Peçanha, S., Tse, A., & Yourish, K. (2015, Jan. 26). How many Ebola patients have been treated outside of Africa? New York Times. Available: www.nytimes.com/interactive/2014/07/31/world/africa/ebola-virus-outbreak-qa.html?_r=0 [accessed May 31, 2016].
p.152
Ausubel, D. P. (1978). In defense of advance organizers. Review of Educational Research, 48, 251–257.
Bandura, A. (1986). Social foundations of thought and action: A social cognitive theory. Englewood Cliffs, NJ: Prentice-Hall.
Bell, P., Lewenstein, B., Shouse, A. W., & Feder, M. A. (Eds.). (2009). Learning science in informal environments: People, places, and pursuits. National Research Council, Committee on Learning Science in Informal Environments. Washington, DC: The National Academies Press.
Borun, M. (2003). Space command summative evaluation. Philadelphia: Franklin Institute Science Museum. Available: www.informalscience.org/evaluations/report_24.pdf [accessed October 2008].
Brossard, D., Lewenstein, B., & Bonney, R. (2005). Scientific knowledge and attitude change: The impact of a citizen science project. International Journal of Science Education, 27(9), 1099–1121.
Burleson, B. R. (2003). The experience and effects of emotional support: What the study of cultural and gender differences can tell us about close relationships, emotion, and interpersonal communication. Personal Relationships, 10(1), 1–23.
Burleson, B. R., & Kline, S. L. (1979). Habermas’ theory of communication: A critical explication. Quarterly Journal of Speech, 65(4), 412–428.
Creswell, J. W., & Clark, V. L. P. (2007). Designing and conducting mixed methods research. Thousand Oaks, CA: SAGE.
Daniels, G. L., & Loggins, G. M. (2007). Conceptualizing continuous coverage: A strategic model for wall-to-wall local television weather. Journal of Applied Communication Research, 35(1), 48–66.
Ding, D., Maibach, E. W., Zhao, X., Roser-Renouf, C., & Leiserowitz, A. (2011). Support for climate policy and societal action are linked to perceptions about scientific agreement. Nature Climate Change, 1(9), 462–466. doi: 10.1038/nclimate1295.
Douglas, M., & Wildavsky, A. (1983). Risk and culture: An essay on the selection of technological and environmental dangers. Berkeley, CA: University of California Press.
Gaile, G. L., & Willmott, C. J. (Eds.). (2003). Geography in America at the dawn of the 21st century. New York: Oxford University Press.
Goldowsky, N. (2002). Lessons from life: Learning from exhibits, animals, and interaction in a museum. UMI #3055856. Unpublished doctoral dissertation, Harvard University.
IPCC. (2007). Climate change 2007: Synthesis report. Contribution of working groups I, II and III to the Fourth Assessment Report of the Intergovernmental Panel on Climate Change. (R. K. Pachauri & A. Risinger, Eds.). Geneva, Switzerland: IPCC.
Kahan, D. M. (2015). Climate-science communication and the measurement problem. Advances in Political Psychology, 36(S1), 1–43.
Krosnick, J., Holbrook, A., Lowe, L., & Visser, P. (2006). The origins and consequences of democratic citizens’ policy agendas: A study of popular concern about global warming. Climatic Change, 77(1), 7–43. doi: 10.1007/s10584-006-9068-8.
p.153
Leiserowitz, A., Maibach, E., & Roser-Renouf, C. (2008). Climate change in the American mind: Americans’ global warming beliefs and attitudes in November 2008. New Haven, CT: Yale Project on Climate Change Communication, Yale University and George Mason University. Available: http://environment.yale.edu/climate/files/Climate-Beliefs-September-2012.pdf.
Leiserowitz, A., Maibach, E., Roser-Renouf, C., Feinberg, G., & Howe, P. (2012). Climate change in the American mind: Americans’ global warming beliefs and attitudes in September 2012. Yale University and George Mason University. New Haven, CT: Yale Project on Climate Change Communication. Available: http://climatecommunication.yale.edu/wp-content/uploads/2016/02/2012_10_Americans%E2%80%99-Global-Warming-Beliefs-and-Attitudes-in-September-2012.pdf.
Leiserowitz, A., Maibach, E., Roser-Renouf, C., Feinberg, G., & Rosenthal, S. (2016). Climate change in the American mind: March 2016. Yale University and George Mason University. New Haven, CT: Yale Program on Climate Change Communication. Available: http://climatechangecommunication.org/wp-content/uploads/2016/06/Climate-Change-American-Mind-March-2016-FINAL.compressed.pdf.
MacGeorge, E. L., Feng, B., & Thompson, E. R. (2008). “Good” and “bad” advice: How to advise more effectively. In M. Motley (Ed.), Applied interpersonal communication: Behaviors that affect outcomes, pp. 145–164. Thousand Oaks, CA: SAGE.
Maibach, E., & Covello, V. (2016). Communicating environmental health. In H. Frumkin (Ed.) Environmental health: From global to local (3rd ed.), pp. 759–780. San Francisco, CA: Jossey-Bass.
Maibach, E., Cullen, H., Placky, B., Witte, J., Seitter, K., Gardiner, N., Myers, T., & Sublette, S. (2016). TV meteorologists as local climate educators. In M. Nisbet (Ed.) Oxford Research Encyclopedia of Climate Science. New York: Oxford University Press. doi: 10.1093/acrefore/9780190228620.013.505.
Maibach, E. W., Leiserowitz, A., Roser-Renouf, C., & Mertz, C. K. (2011). Identifying like-minded audiences for global warming public engagement campaigns: An audience segmentation analysis and tool development. PLoS ONE, 6(3), e17571. doi: 10.1371/journal.pone.0017571.
Maibach, E., Mazzone, R., Myers, T., Seitter, K., Hayhoe, K., Ryan, B., Witte, J., Gardiner, N., Hassol, S., Lazo, J., Placky, B., Sublette, S., & Cullen, H. (in press). TV weathercasters’ views of climate change appear to be rapidly evolving. Bulletin of the American Meteorological Society.
Maibach, E. W., Roser-Renouf, C., & Leiserowitz, A. (2008). Communication and marketing as climate change–intervention assets: A public health perspective. American Journal of Preventive Medicine, 35(5), 488–500. doi: 10.1016/j.amepre.2008.08.016.
Matthews, C. E., George, S. M., Moore, S. C., Bowles, H. R., Blair, A., Park, Y., Troiano, R. P., Hollenbeck, A., & Schatzkin, A. (2012). Amount of time spent in sedentary behaviors and cause-specific mortality in US adults. The American Journal of Clinical Nutrition, 95(2), 437–445.
Mayer, R. E., Bove, W., Bryman, A., Mars, R., & Tapangco, L. (1996). When less is more: Meaningful learning from visual and verbal summaries of science textbook lessons. Journal of Educational Psychology, 88(1), 64.
p.154
Miller, J. D., Augenbraun, E., Schulhof, J., & Kimmel, L. G. (2006). Adult science learning from local television newscasts. Science Communication, 28(2), 216–242. doi: 10.1177/1075547006294461.
National Research Council. (2011). America’s climate choices. Washington, DC: The National Academies Press.
National Oceanic and Atmospheric Administration (NOAA). (n.d.) National Weather Service: Radiosonde observations. Available: www.ua.nws.noaa.gov/factsheet.htm [accessed May 31, 2016].
O’Keefe, D. J. (2015). Persuasion: Theory and research (2nd ed.). Thousand Oaks, CA: SAGE.
Pedretti, E. G. (2004). Perspectives on learning through research on critical issues-based science center exhibitions. Hoboken, NJ: Wiley.
Petty, R. E., Wegener, D. T., & Fabrigar, L. R. (1997). Attitudes and attitude change. Annual Review of Psychology, 48(1), 609–647.
Placky, B., Maibach, E., Witte, J., Ward, B., Seitter, K. Gardiner, N., Herring, D., & Cullen, H. (2016). Climate matters: A comprehensive educational resource for broadcast meteorologists. Bulletin of the American Meteorological Society, doi: http://dx.doi.org/10.1175/BAMS-D-14-00235.1.
Randol, S. M. (2005). The nature of inquiry in science centers: Describing and assessing inquiry at exhibits. Unpublished doctoral dissertation, University of California, Berkeley.
Rowan, K. E. (1988). A contemporary theory of explanatory writing. Written Communication, 5(1), 23–56.
Rowan, K. E. (1990). Cognitive correlates of explanatory writing skill: An analysis of individual differences. Written Communication, 7(3), 316–341.
Rowan, K. E. (1999). Effective explanation of uncertain and complex science. In S. Friedman, S. Dunwoody, & C. L. Rogers (Eds.), Communicating uncertainty: Media coverage of new and controversial science, pp. 201–220. Mahwah, NJ: Erlbaum.
Rowan, K. E. (2003). Informing and explaining skills: Theory and research on informative communication. In J. O. Greene & B. R. Burleson (Eds.), The handbook of communication and social interaction skills, pp. 403–438. Mahwah, NJ: Erlbaum.
Sachatello-Sawyer, B., Fellenz, R. A., Burton, H., Gittings-Carlson, L., Lewis-Mahony, J., & Woolbaugh, W. (2002). Adult museum programs: Designing meaningful experiences. American Association for State and Local History Book series. Blue Ridge Summit, PA: AltaMira Press.
Samenow, J. (2012, June 12). Report: Climate warming has accelerated in U.S. since 1970, including Va., Md. Washington Post. Available: www.washingtonpost.com/blogs/capital-weather-gang/post/report-climate-warming-has-accelerated-in-us-since-1970-including-in-va-md/2012/06/12/gJQAxr7bXV_blog.html?utm_term=.a2f4023fd8d9 [accessed March 10, 2017].
Sandman, P. M. (1993). Responding to community outrage: Strategies for effective risk communication. American Industrial Hygiene Association.
Slovic, P., & Peters, E. (2006). Risk perception and affect. Current Directions in Psychological Science, 15(6), 322–325.
p.155
Swain, K. A. (2007). Outrage factors and explanations in news coverage of the anthrax attacks. Journalism and Mass Communication Quarterly, 84(2), 335–352.
Wilson, K. (2009). Opportunities and obstacles for television weathercasters to report on climate change. Bulletin of the American Meteorological Society, 90(10), 1457–1465. doi: 10.1175/2009BAMS2947.1.
Witte, K. (1992). Putting the fear back into fear appeals: The extended parallel process model. Communications Monographs, 59(4), 329–349.
Zhao, X. Z., Maibach, E. W., Gandy, J., Witte, H. J., Cullen, H., Klinger, B., Rowan, K., Witte, J., & Pyle, A. (2014). TV weathercasters as climate educators: Results of a field experiment. Bulletin of the American Meteorological Society. doi: http://dx.doi.org/10.1175/BAMS-D-12-00144.1.