
C H A P T E R 5
Minimizing System Contention
It's not uncommon for Oracle DBAs to field calls about a user being locked or “blocked” in the database. Oracle's locking behavior is extremely sophisticated and supports simultaneous use of the database by multiple users. However, on occasion, it's possible for a user to block another user's work, mostly due to flaws in application design. This chapter explains how Oracle handles locks and how to identify a session that's blocking others.
Oracle database can experience two main types of contention for resources. The first is contention for transaction locks on a table's rows. The second type of contention is that caused by simultaneous requests for areas of the shared memory (SGA), resulting in latch contention. In addition to showing you how to troubleshoot typical locking issues, we will also show how to handle various types of latch contention in your database.
Oracle Wait Interface is a handy name for Oracle's internal mechanism for classifying and measuring the different types of waits for resources in an Oracle instance. Understanding Oracle wait events is the key to instance tuning, because high waits slow down response time. We will explain the Oracle Wait Interface in this chapter and show you how to reduce the most common Oracle wait events that beguile Oracle DBAs. We will show you how to use various SQL scripts to unravel the mysteries of the Oracle Wait Interface, and we will also show how to use Oracle Enterprise Manager to quickly track down the SQL statements and sessions that are responsible for contention in the database.
5-1. Understanding Response Time
Problem
You want to understand what database response time is, and its relationship with wait time.
Solution
The most crucial performance indicator in a database is response time. Response time is the time it takes to get a response from the database for a query that a client sends to the database. Response time is simply the sum of two components:
response time = processing time + wait time
The foregoing relationship is also frequently represented as R=S + W, where R is the response time, S the service time, and W stands for the wait time. The processing time component is the actual time spent by the database processing the request. Wait time, on the other hand, is time actually wasted by the database—it's the time the database spends waiting for resources such as a lock on a table's rows, library cache latch, or any of the numerous resources that a query needs to complete its processing. Oracle has hundreds of official wait events, a dozen or so of which are crucial to troubleshooting slow-running queries.
Do You Have a Wait Problem?
It's easy to find out the percentage of time a database has spent waiting for resources instead of actually executing. Issue the following query to find out the relative percentages of wait times and actual CPU processing in the database:
SQL> select metric_name, value

   2 from v$sysmetric

   3 where metric_name in ('Database CPU Time Ratio',

   4 'Database Wait Time Ratio') and

   5 intsize_csec =

   6 (select max(INTSIZE_CSEC) from V$SYSMETRIC);


METRIC_NAME                             VALUE

————————————------------              -----------

Database Wait Time Ratio                11.371689

Database CPU Time Ratio                 87.831890

SQL>
If the query shows a very high value for the Database Wait Time Ratio, or if the Database Wait Time Ratio is much greater than the Database CPU Time Ratio, the database is spending more time waiting than processing and you must dig deeper into the Oracle wait events to identify the specific wait events causing this.
Find Detailed Information
You can use the following Oracle views to find out detailed information of what a wait event is actually waiting for and how long it has waited for each resource.
V$SESSION: This view shows the event currently being waited for as well as the event last waited for in each session.
V$SESSION_WAIT: This view lists either the event currently being waited for or the event last waited on for each session. It also shows the wait state and the wait time.
V$SESSION_WAIT_HISTORY: This view shows the last ten wait events for each current session.
V$SESSION_EVENT: This view shows the cumulative history of events waited on for each session. The data in this view is available only so long as a session is active.
V$SYSTEM_EVENT: This view shows each wait event and the time the entire instance waited for that event since you started the instance.
V$SYSTEM_WAIT_CLASS: This view shows wait event statistics by wait classes.
How It Works
Your goal in tuning performance is to minimize the total response time. If the Database Wait Time Ratio (in the query shown in the “Solution” section) is high, your response time will also be high due to waits or bottlenecks in your system. On the other hand, high values for the Database CPU Time Ratio indicate a well-running database, with few waits or bottlenecks. The Database CPU Time Ratio is calculated by dividing the total CPU used by the database by the Oracle time model statistic DB time.
Oracle uses time model statistics to measure the time spent in the database by the type of operation. Database time, or DB time, is the most important time model statistic—it represents the total time spent in database calls, and serves as a measure of total instance workload. DB time is computed by adding the CPU time and wait time of all sessions (excluding the waits for idle events). An AWR report shows the total DB time for the instance (in the section titled “Time Model System Stats”) during the period covered by the AWR snapshots. If the time model statistic DB CPU consumes most of the DB time for the instance, it shows the database was actively processing most of the time. DB time tuning, or understanding how the database is spending its time, is fundamental to understanding performance.
The total time spent by foreground sessions making database calls consists of I/O time, CPU time, and time spent waiting for non-idle events. Your DB time will increase as the system load increases—that is, as more users log on and larger queries are executed, the greater the system load. However, even in the absence of an increase in system load, DB time can increase, due to deterioration either in I/O or application performance. As application performance degrades, wait time will increase and consequently DB time (that is, response time) will increase.
DB time is captured by internal instrumentation, ASH, AWR, and ADDM, and you can find detailed performance information by querying various views or through Enterprise Manager.
![]() Note If the host system is CPU-bound, you'll see an increase in DB time. You must first tune CPU usage before focusing on wait events in that particular case.
Note If the host system is CPU-bound, you'll see an increase in DB time. You must first tune CPU usage before focusing on wait events in that particular case.
The V$SESSION_WAIT view shows more detailed information than the V$SESSION_EVENT and the V$SYSTEM_EVENT views. While both the V$SESSION_EVENT and the V$SESSION_WAIT views show that there are waits such as the event db file scattered read, for example, only the V$SESSION_WAIT view shows the file number (P1), the block number read (P2), and the number of blocks read (P3). The columns P1 and P2 from this view help you identify the segments involved in the wait event that is currently occurring.
![]() Note The Automatic Workload Repository (AWR) queries the
Note The Automatic Workload Repository (AWR) queries the V$SYSTEM_EVENT view for its wait event–related analysis.
You can first query the V$SYSTEM_EVENT view to rank the top wait events by total and average time waited for that event. You can then drill down to the wait event level, by focusing on the events at the top of the event list. Note that you can query the V$WAITSTAT view for the same information as well. In addition to providing information about blocking and blocked users and the current wait events, the V$SESSION view also shows the objects that are causing the problem, by providing the file number and block number for the object.
5-2. Identifying SQL Statements with the Most Waits
Problem
You want to identify the SQL statements responsible for the most waits in your database.
Solution
Execute the following query to identify the SQL statements that are experiencing the most waits in your database:
SQL> select ash.user_id,

  2  u.username,

  3  s.sql_text,

  4  sum(ash.wait_time +

  5  ash.time_waited) ttl_wait_time

  6  from v$active_session_history ash,

  7  v$sqlarea s,

  8  dba_users u

  9  where ash.sample_time between sysdate - 60/2880 and sysdate

 10  and ash.sql_id = s.sql_id

 11  and ash.user_id = u.user_id

 12  group by ash.user_id,s.sql_text, u.username

 13* order by ttl_wait_time

SQL>
The preceding query ranks queries that ran during the past 30 minutes, according to the total time waited by each query.
How It Works
When you're experiencing a performance problem, it's a good idea to see which SQL statements are waiting the most. These are the statements that are using most of the database's resources. To find the queries that are waiting the most, you must sum the values in the wait_time and the time_waited columns of the V$ACTIVE_SESSION_HISTORY for a specific SQL statement. In order to do this, you must join the V$SQLAREA view with the V$ACTIVE_SESSION_HISTORY view, using SQL_ID as the join column.
Besides the SQL_ID of the SQL statements, the V$ACTIVE_SESSION_HISTORY view also contains information about the execution plans used by the SQL statements. You can use this information to identify why a SQL statement is experiencing a high amount of waits. You can also run an Active Session History (ASH) report, using a SQL script or through Oracle Enterprise Manager, to get details about the top SQL statements in the sampled session activity. The Top SQL section of an ASH report helps you identify the high-load SQL statements that are responsible for performance problems. Examining the Top SQL report may show you, for example, that one bad query has been responsible for most of the database activity.
5-3. Analyzing Wait Events
Problem
You want to analyze Oracle wait events.
Solution
Several recipes in this chapter show you how to analyze the most important Oracle wait events. An overwhelming amount of wait time in a database is due to I/O–related waits, such as those caused by either full table scans or indexed reads. While indexed reads may seem to be completely normal on the face of it, too many indexed reads can also slow down performance. Therefore, you must investigate why the database is performing a large number of indexed reads. For example, if you see the db file sequential read event (indicates indexed reads) at the top of the wait event list, you must look a bit further to see how the database is accumulating these read events. If you find that the database is performing hundreds of thousands of query executions, with each query doing only a few indexed reads, that's fine. However, if you find that just a couple of queries are contributing to a high number of logical reads, then, most likely, those queries are reading more data than necessary. You must tune those queries to reduce the db file sequential read events.
How It Works
Wait events are statistics that a server process or thread increments when it waits for an event to complete, in order to continue its processing. For example, a SQL statement may be modifying data, but the server process may have to wait for a data block to be read from disk, because it's not available in the SGA. Although there's a large number of wait events, the most common events are the following:
- buffer busy waits
- free buffer waits
- db file scattered read
- db file sequential read
- enqueue waits
- log buffer space
- log file sync
Analyzing Oracle wait events is the most important performance tuning task you'll perform when troubleshooting a slow-running query. When a query is running slow, it usually means that there are excessive waits of one type or another. Some of the waits may be due to excessive I/O due to missing indexes. Other waits may be caused by a latch or a locking event. Several recipes in this chapter show you how to identify and fix various types of Oracle wait-related performance problems. In general, wait events that account for the most wait time warrant further investigation. However, it's important to understand that wait events show only the symptoms of underlying problems—thus, you should view a wait event as a window into a particular problem, and not the problem itself. When Oracle encounters a problem such as buffer contention or latch contention, it simply increments a specific type of wait event relating to that latch or buffer. By doing this, the database is showing where it had to wait for a specific resource, and was thus unable to continue processing. The buffer or latch contention can often be traced to faulty application logic, but some wait events could also emanate from system issues such as a misconfigured RAID system. Missing indexes, inappropriate initialization parameters, inadequate values for initialization parameters that relate to memory, and inadequate sizing of redo log files are just some of the things that can lead to excessive waits in a database. The great benefit of analyzing Oracle wait events is that it takes the guesswork out of performance tuning—you can see exactly what is causing a performance slowdown, so you can immediately focus on fixing the problem.
5-4. Understanding Wait Class Events
Problem
You want to understand how Oracle classifies wait events into various classes.
Solution
Every Oracle wait event belongs to a specific wait event class. Oracle groups wait events into classes such as Administrative, Application, Cluster, Commit, Concurrency, Configuration, Scheduler, System I/O, and User I/O, to facilitate the analysis of wait events. Here are some examples of typical waits in some of these classes:
Application: Lock-related wait information
Commit: Waits for confirmation of a redo log write after committing a transaction
Network: Waits caused by delays in sending data over the network
User I/O: Waiting to read blocks from disk
Two key wait classes are the Application and the User I/O wait classes. The Application wait class contains waits due to row and table locks caused by an application. The User I/O class includes the db file scattered read, db file sequential read, direct path read, and direct path write events. The System I/O class includes redo log–related wait events among other waits. The Commit class contains just the log file sync wait information. There's also an “idle” class of wait events such as SQL*Net message from client for example, that merely indicate an inactive session. You can ignore the idle waits.
How It Works
Classes of wait events help you quickly find out what type of activity is affecting database performance. For example, the Administrative wait class may show a high number of waits because you're rebuilding an index. Concurrency waits point to waits for internal database resources such as latches. If the Cluster wait class shows the most wait events, then your RAC instances may be experiencing contention for global cache resources (gc cr block busy event). Note that the System I/O wait class includes waits for background process I/O such as the DBWR (database writer) wait event db file parallel write.
The Application wait class contains waits that result from user application code—most of your enqueue waits fall in this wait class. The only wait event in the Commit class is the log file sync event, which we examine in detail later in this chapter. The Configuration class waits include waits such as those caused by log files that are sized too small.
5-5. Examining Session Waits
Problem
You want to find out the wait events in a session.
Solution
You can use the V$SESSION_WAIT view to get a quick idea about what a particular session is waiting for, as shown here:
SQL> select event, count(*) from v$session_wait

     group by event;


EVENT                                                                       COUNT(*)

----------------------------------------------------------------           ----------

SQL*Net message from client                                                11

Streams AQ: waiting for messages in the queue                              1

enq: TX - row lock contention                                              1

…

15 rows selected.


SQL>
The output of the query indicates that one session is waiting for an enqueue lock, possibly because of a blocking lock held by another session. If you see a large number of sessions experiencing row lock contention, you must investigate further and identify the blocking session.
Here's one more way you can query the V$SESSION_WAIT view, to find out what's slowing down a particular session:
SQL> select event, state, seconds_in_wait siw

     from   v$session_wait

     where  sid = 81;


EVENT                                            STATE            SIW

----------------------------------------      -----------        ------

enq: TX - row lock contention                   WAITING             976
The preceding query shows that the session with the SID 81 has been waiting for an enqueue event, because the row (or rows) it wants to update is locked by another transaction.
![]() Note In Oracle Database 11g, the database counts each resource wait as just one wait, even if the session experiences many internal time-outs caused by the wait. For example, a wait for an enqueue for 15 seconds may include 5 different 3-second-long wait calls—the database considers these as just a single enqueue wait.
Note In Oracle Database 11g, the database counts each resource wait as just one wait, even if the session experiences many internal time-outs caused by the wait. For example, a wait for an enqueue for 15 seconds may include 5 different 3-second-long wait calls—the database considers these as just a single enqueue wait.
How It Works
The first query shown in the “Solution” section offers an easy way to find out which wait events, if any, are slowing down user sessions. When you issue the query without specifying a SID, it displays the current and last waits for all sessions in the database. If you encounter a locking situation in the database, for example, you can issue the query periodically to see whether the total number of enqueue waits is coming down. If the number of enqueue waits across the instance is growing, that means more sessions are encountering slowdowns due to blocked locks.
The V$SESSION_WAIT view shows the current or the last wait for each session. The STATE column in this view tells you if a session is currently waiting. Here are the possible values for the STATE column:
WAITING:The session is currently waiting for a resource.
WAITED UNKNOWN TIME: The duration of the last wait is unknown (this value is shown only if you set theTIMED_STATISTICSparameter to false).
WAITED SHORT TIME: The most recent wait was less than a hundredth of a second long.
WAITED KNOWN TIME: TheWAIT_TIMEcolumn shows the duration of the last wait.
Note that the query utilizes the seconds_in_wait column to find out how long this session has been waiting. Oracle has deprecated this column in favor of the wait_time_micro column, which shows the amount of time waited in microseconds. Both columns show the amount of time waited for the current wait, if the session is currently waiting. If the session is not currently waiting, the wait_time_micro column shows the amount of time waited during the last wait.
5-6. Examining Wait Events by Class
Problem
You want to examine Oracle wait event classes.
Solution
The following query shows the different types of wait classes and the wait events associated with each wait class.
SQL> select  wait_class, name

  2  from v$event_name

  3  where name LIKE 'enq%'

  4  and wait_class <> 'Other'

  5* order by wait_class

SQL> /


WAIT_CLASS                                 NAME

--------------------               --------------------------

Administrative                     enq: TW - contention

Concurrency                        enq: TX - index contention

…

SQL>
To view the current waits grouped into various wait classes, issue the following query:
SQL> select wait_class, sum(time_waited), sum(time_waited)/sum(total_waits)

  2  sum_waits

  3  from v$system_wait_class

  4  group by wait_class

  5* order by 3 desc;


WAIT_CLASS                             SUM(TIME_WAITED)                SUM_WAITS

---------------- ----------           -----------------        -----------------

Idle                                          249659211               347.489249

Commit                                          1318006               236.795904

Concurrency                                       16126                 4.818046

User I/O                                         135279                 2.228869

Application                                         912                 .0928055

Network                                             139                 .0011209

…

SQL>
If you see a very high sum of waits for the Idle wait class, not to worry—actually, you should expect to see this in any healthy database. In a typical production environment, however, you'll certainly see more waits under the User I/O and Application wait classes. If you notice that the database has accumulated a very large wait time for the Application wait class, or the User I/O wait class, for example, it's time to investigate those two wait classes further. In the following example, we drill down into a couple of wait classes to find out which specific waits are causing the high sum of total wait time under the Application and Concurrency classes. To do this, we use the V$SYSTEM_EVENT and the $EVENT_NAME views in addition to the V$SYSTEM_WAIT_CLASS view. Focus not just on the total time waited, but also on the average wait, to gauge the effect of the wait event.
SQL> select a.event, a.total_waits, a.time_waited, a.average_wait

     from v$system_event a, v$event_name b, v$system_wait_class c

     where a.event_id=b.event_id

     and b.wait_class#=c.wait_class#

     and c.wait_class in ('Application','Concurrency')

     order by average_wait desc;
EVENT                       TOTAL_WAITS   TIME_WAITED    AVERAGE_WAIT

----------- ------------    -----------   -------------  -------------

enq: UL - contention                  1             499         499.19


latch: shared pool                  251           10944           43.6


library cache load lock              24             789          32.88


SQL>
![]() Tip Two of the most common Oracle wait events are the
Tip Two of the most common Oracle wait events are the db file scattered read and the db file sequential read events. The db file scattered read wait event is due to full table scans of large tables. If you experience this wait event, investigate the possibility of adding indexes to the table or tables. The db file sequential read wait event is due to indexed reads. While an indexed read may seem like it's a good thing, a very high amount of indexed reads could potentially indicate an inefficient query that you must tune. If high values for the db file sequential read wait event are due to a very large number of small indexed reads, it's not really a problem—this is natural in a database. You should be concerned if a handful of queries are responsible for most of the waits.
You can see that the enqueue waits caused by the row lock contention are what's causing the most waits under these two classes. Now you know exactly what's slowing down the queries in your database! To get at the session whose performance is being affected by the contention for the row lock, drill down to the session level using the following query:
SQL> select a.sid, a.event, a.total_waits, a.time_waited, a.average_wait

     from v$session_event a, v$session b

     where time_waited > 0

     and a.sid=b.sid

     and b.username is not NULL

     and a.event='enq: TX - row lock contention';


  SID               EVENT                      TOTAL_WAITS    time_waited      average_wait

----------     ------------------------------  ------------   -----------      ------------

        68     enq: TX - row lock contention             24           8018              298

SQL>
The output shows that the session with the SID 68 is waiting for a row lock that's held by another transaction.
How It Works
Understanding the various Oracle wait event classes enhances your ability to quickly diagnose Oracle wait-related problems. Analyzing wait events by classes lets you know if contention, user I/O, or a configuration issue is responsible for high waits. The examples in the “Solution” section show you how to start analyzing the waits based on the wait event classes. This helps identify the source of the waits, such as concurrency issues, for example. Once you identify the wait event class responsible for most of the waits, you can drill down into that wait event class to find out the specific wait events that are contributing to high total waits for that wait event class. You can then identify the user sessions waiting for those wait events, using the final query shown in the “Solution” section.
5-7. Resolving Buffer Busy Waits
Problem
Your database is experiencing a high number of buffer busy waits, based on the output from the AWR report. You want to resolve those waits.
Solution
Oracle has several types of buffer classes, such as data block, segment header, undo header, and undo block. How you fix a buffer busy wait situation will depend on the types of buffer classes that are causing the problem. You can find out the type of buffer causing the buffer waits by issuing the following two queries. Note that you first get the value of row_wait_obj# from the first query and use it as the value for data_object_id in the second query.
SQL> select row_wait_obj#

     from v$session

     where event = 'buffer busy waits';


SQL> select owner, object_name, subobject_name, object_type

     from dba_objects

     where data_object_id = &row_wait_obj;
The preceding queries will reveal the specific type of buffer causing the high buffer waits. Your fix will depend on which buffer class causes the buffer waits, as summarized in the following subsections.
Segment Header
If your queries show that the buffer waits are being caused by contention on the segment header, there's free list contention in the database, due to several processes attempting to insert into the same data block—each of these processes needs to obtain a free list before it can insert data into that block. If you aren't already using it, you must switch from manual space management to automatic segment space management (ASSM)—under ASSM, the database doesn't use free lists. However, note that moving to ASSM may not be easily feasible in most cases. In cases where you can't implement ASSM, you must increase the free lists for the segment in question. You can also try increasing the free list groups as well.
Data Block
Data block buffer contention could be related to a table or an index. This type of contention is often caused by right-hand indexes, that is, indexes that result in several processes inserting into the same point, such as when you use sequence number generators to produce the key values. Again, if you're using manual segment management, move to ASSM or increase free lists for the segment.
Undo Header and Undo Block
If you're using automatic undo management, few or none of the buffer waits will be due to contention for an undo segment header or an undo segment block. If you do see one of these buffer classes as the culprit, however, you may increase the size of your undo tablespace to resolve the buffer busy waits.
How It Works
A buffer busy wait indicates that more than one process is simultaneously accessing the same data block. One of the reasons for a high number of buffer busy waits is that an inefficient query is reading too many data blocks into the buffer cache, thus potentially keeping in wait other sessions that want to access one or more of those same blocks. Not only that, a query that reads too much data into the buffer cache may lead to the aging out of necessary blocks from the cache. You must investigate queries that involve the segment causing the buffer busy waits with a view to reducing the number of data blocks they're reading into the buffer cache.
If your investigation of buffer busy waits reveals that the same block or set of blocks is involved most of the time, a good strategy would be to delete some of these rows and insert them back into the table, thus forcing them onto different data blocks.
Check your current memory allocation to the buffer cache, and, if necessary, increase it. A larger buffer cache can reduce the waiting by sessions to read data from disk, since more of the data will already be in the buffer cache. You can also place the offending table in memory by using the KEEP POOL in the buffer cache (please see Recipe 3-7). By making the hot block always available in memory, you'll avoid the high buffer busy waits.
Indexes that have a very low number of unique values are called low cardinality indexes. Low cardinality indexes generally result in too many block reads. Thus, if several DML operations are occurring concurrently, some of the index blocks could become “hot” and lead to high buffer busy waits. As a long-term solution, you can try to reduce the number of the low cardinality indexes in your database.
Each Oracle data segment such as a table or an index contains a header block that records information such as free blocks available. When multiple sessions are trying to insert or delete rows from the same segment, you could end up with contention for the data segment's header block.
Buffer busy waits are also caused by a contention for free lists. A session that's inserting data into a segment needs to first examine the free list information for the segment, to find blocks with free space into which the session can insert data. If you use ASSM in your database, you shouldn't see any waits due to contention for a free list.
5-8. Resolving Log File Sync Waits
Problem
You're seeing a high amount of log file sync wait events, which are at the top of all wait events in your database. You want to reduce these wait events.
Solution
The following are two strategies for dealing with high log file sync waits in your database.
- If you notice a very large number of waits with a short average wait time per wait, that's an indication that too many commit statements are being issued by the database. You must change the commit behavior by batching the commits. Instead of committing after each row, for example, you can specify that the commits occur after every 500 rows.
- If you notice that the large amount of wait time accumulated due to the
redo log file syncevent was caused by long waits for writing to the redo log file (high average time waited for this event), it's more a matter of how fast your I/O subsystem is. You can alternate the redo log files on various disks to reduce contention. You can also see if you can dedicate disks entirely for the redo logs instead of allowing other files on those disks—this will reduce I/O contention when the LGWR is writing the buffers to disk. Finally, as a long-term solution, you can look into placing redo logs on faster devices, say, by moving them from a RAID 5 to a RAID 1 device.
How It Works
Oracle (actually the LGWR background process) automatically flushes a session's redo information to the redo log file whenever a session issues a COMMIT statement. The database writes commit records to disk before it returns control to the client. The server process thus waits for the completion of the write to the redo log. This is the default behavior, but you can also control the database commit behavior with the COMMIT_WRITE initialization parameter.
![]() Note The
Note The COMMIT_WRITE parameter is an advanced parameter that has been deprecated in Oracle Database 11.2. Since it may have an adverse impact on performance, you may want to leave the parameter alone and rely on Oracle's default commit behavior.
The session will tell the LGWR process to write the session's redo information from the redo log buffer to the redo log file on disk. The LGWR process posts the user session after it finishes writing the buffer's contents to disk. The log file sync wait event includes the wait during the writing of the log buffer to disk by LGWR and the posting of that information to the session. The server process will have to wait until it gets confirmation that the LGWR process has completed writing the log buffer contents out to the redo log file.
The log file sync events are caused by contention during the writing of the log buffer contents to the redo log files. Check the V$SESSION_WAIT view to ascertain whether Oracle is incrementing the SEQ# column. If Oracle is incrementing this column, it means that the LGWR process is the culprit, as it may be stuck.
As the log file sync wait event is caused by contention caused by the LGWR process, see if you can use the NOLOGGING option to get rid of these waits. Of course, in a production system, you can't use the NOLOGGING option when the database is processing user requests, so this option is of limited use in most cases.
The log file sync wait event can also be caused by too large a setting for the LOG_BUFFER initialization parameter. Too large a value for the LOG_BUFFER parameter will lead the LGWR process to write data less frequently to the redo log files. For example, if you set the LOG BUFFER to something like 12 MB, it sets an internal parameter, log_io_size, to a high value. The log_io_size parameter acts as a threshold for when the LGWR writes to the redo log files. In the absence of a commit request or a checkpoint, LGWR waits until the log_io_size threshold is met. Thus, when the database issues a COMMIT statement, the LGWR process would be forced to write a large amount of data to the redo log files at once, resulting in sessions waiting on the log file sync wait event. This happens because each of the waiting sessions is waiting for LGWR to flush the contents of the redo log buffer to the redo log files. Although the database automatically calculates the value of the log_io_size parameter, you can specify a value for it, by issuing a command such as the following:
SQL> alter system set "_log_io_size"=1024000 scope=spfile;


System altered.


SQL>
5-9. Minimizing read by other session Wait Events
Problem
Your AWR report shows that the read by other session wait event is responsible for the highest number of waits. You'd like to reduce the high read by other session waits.
Solution
The main reason you'll see the read by other session wait event is that multiple sessions are seeking to read the same data blocks, whether they are table or index blocks, and are forced to wait behind the session that's currently reading those blocks. You can find the data blocks a session is waiting for by executing the following command:
SQL> select p1 "file#", p2 "block#", p3 "class#"

     from v$session_wait

     where event = 'read by other session';
You can then take the block# and use it in the following query, to identify the exact segments (table or index) that are causing the read by other session waits.
SQL> select relative_fno, owner, segment_name, segment_type

     from dba_extents

     where file_id = &file

     and &block between block_id

     and block_id + blocks - 1;
Once you identify the hot blocks and the segments they belong to, you need to identify the queries that use these data blocks and segments and tune those queries if possible. You can also try deleting and re-inserting the rows inside the hot blocks.
In order to reduce the amount of data in each of the hot blocks and thus reduce these types of waits, you can also try to create a new tablespace with a smaller block size and move the segment to that tablespace. It's also a good idea to check if any low cardinality indexes are being used, because this type of an index will make the database read a large number of data blocks into the buffer cache, potentially leading to the read by other session wait event. If possible, replace any low cardinality indexes with an index on a column with a high cardinality.
How It Works
The read by other session wait event indicates that one or more sessions are waiting for another session to read the same data blocks from disk into the SGA. Obviously, a large number of these waits will slow down performance. Your first goal should be to identify the actual data blocks and the objects the blocks belong to. For example, these waits can be caused by multiple sessions trying to read the same index blocks. Multiple sessions can also be trying to execute a full table scan simultaneously on the same table.
5-10. Reducing Direct Path Read Wait Events
Problem
You notice a high amount of the direct path read wait events, and also of direct path read temp wait events, and you'd like to reduce the occurrence of those events.
Solution
Direct path read and direct path read temp events are related wait events that occur when sessions are reading data directly into the PGA instead of reading it into the SGA. Reading data into the PGA isn't the problem here—that's normal behavior for certain operations, such as sorting, for example. The direct path read and direct path read temp events usually indicate that that the sorts being performed are very large and that the PGA is unable to accommodate those sorts.
Issue the following command to get the file ID for the blocks that are being waited for:
SQL> select p1 "file#", p2 "block#", p3 "class#"

     from v$session_wait

     where event = 'direct path read temp';
The column P1 shows the file ID for the read call. Column P2 shows the start BLOCK_ID, and column P3 shows the number of blocks. You can then execute the following statement to check whether this file ID is for a temporary tablespace tempfile:
SQL> select relative_fno, owner, segment_name, segment_type

     from dba_extents

     where file_id = &file

     and &block betgween block_id and block_id + &blocks - 1;
The direct read–type waits can be caused by excessive sorts to disk or full table scans. In order to find out what the reads are actually for, check the P1 column (file ID for the read call) of the V$SESSION_WAIT view. By doing this, you can find out if the reads are being caused by reading data from the TEMP tablespace due to disk sorting, or if they're occurring due to full table scans by parallel slaves.
If you determine that sorts to disk are the main culprit in causing high direct read wait events, increase the value of the PGA_AGGREGATE_TARGET parameter (or specify a minimum size for it, if you're using automatic memory management). Increasing PGA size is also a good strategy when the queries are doing large hash joins, which could result in excessive I/O on disk if the PGA is inadequate for handling the large hash joins. When you set a high degree of parallelism for a table, Oracle tends to go for full table scans, using parallel slaves. If your I/O system can't handle all the parallel slaves, you'll notice a high amount of direct path reads. The solution for this is to reduce the degree of parallelism for the table or tables in question. Also investigate if you can avoid the full table scan by specifying appropriate indexes.
How It Works
Normally, during both a sequential db read or a scattered db read operation, the database reads data from disk into the SGA. A direct path read is one where a single or multiblock read is made from disk directly to the PGA, bypassing the SGA. Ideally, the database should perform the entire sorting of the data in the PGA. When a huge sort doesn't fit into the available PGA, Oracle writes part of the sort data directly to disk. A direct read occurs when the server process reads this data from disk (instead of the PGA).
A direct path read event can also occur when the I/O subsystem is overloaded, most likely due to full table scans caused by setting a high degree of parallelism for tables, causing the database to return buffers slower than what the processing speed of the server process requires. A good disk striping strategy would help out here. Oracle's Automatic Storage Management (ASM) automatically stripes data for you. If you aren't already using ASM, consider implementing it in your database.
Direct path write and direct path write temp wait events are analogous to the direct path read and the direct path read temp waits. Normally, it's the DBWR that writes data from the buffer cache. Oracle uses a direct path write when a process writes data buffers directly from the PGA. If your database is performing heavy sorts that spill onto disk, or parallel DML operations, you can on occasion expect to encounter the direct path write events. You may also see this wait event when you execute direct path load events such as a parallel CTAS (create table as select) or a direct path INSERT operation. As with the direct path read events, the solution for direct path write events depends on what's causing the waits. If the waits are being mainly caused by large sorts, then you may think about increasing the value of the PGA_AGGREGATE_TARGET parameter. If operations such as parallel DML are causing the waits, you must look into the proper spreading of I/O across all disks and also ensure that your I/O subsystem can handle the high degree of parallelism during DML operations.
5-11. Minimizing Recovery Writer Waits
Problem
You've turned on the Oracle Flashback Database feature in your database. You're now seeing a large number of wait events due to a slow RVWR (recovery writer) process. You want to reduce the recovery writer waits.
Solution
Oracle writes all changed blocks from memory to the flashback logs on disk. You may encounter the flashback buf free by RVWR wait event as a top wait event when thie database is writing to the flashback logs. To reduce these recovery writer waits, you must tune the flash recovery area file system and storage. Specifically, you must do the following:
- Since flashback logs tend to be quite large, your database is going to incur some CPU overhead when writing to these files. One of the things you may consider is moving the flash recovery area to a faster file system. Also, Oracle recommends that you use file systems based on ASM, because they won't be subject to operating system file caching, which tends to slow down I/O.
- Increase the disk throughput for the file system where you store the flash recovery area, by configuring multiple disk spindles for that file system. This will speed up the writing of the flashback logs.
- Stripe the storage volumes, ideally with small stripe sizes (for example, 128 KB).
- Set the
LOG_BUFFERinitialization parameter to a minimum value of 8 MB—the memory allocated for writing to the flashback database logs depends on the setting of theLOG_BUFFERparameter.
How It Works
Unlike in the case of the redo log buffer, Oracle writes flashback buffers to the flashback logs at infrequent intervals to keep overhead low for the Oracle Flashback Database. The flashback buf free by RVWR wait event occurs when sessions are waiting on the RVWR process. The RVWR process writes the contents of the flashback buffers to the flashback logs on disk. When the RVWR falls behind during this process, the flashback buffer is full and free buffers aren't available to sessions that are making changes to data through DML operations. The sessions will continue to wait until RVWR frees up buffers by writing their contents to the flashback logs. High RVWR waits indicate that your I/O system is unable to support the rate at which the RVWR needs to flush flashback buffers to the flashback logs on disk.
5-12. Finding Out Who's Holding a Blocking Lock
Problem
Your users are complaining that some of their sessions are very slow. You suspect that those sessions may be locked by Oracle for some reason, and would like to find the best way to go about figuring out who is holding up these sessions.
Solution
As we've explained in the introduction to this chapter, Oracle uses several types of locks to control transactions being executed by multiple sessions, to prevent destructive behavior in the database. A blocking lock could “slow” a session down—in fact, the session is merely waiting on another session that is holding a lock on an object (such as a row or a set of rows, or even an entire table). Or, in a development scenario, a developer might have started multiple sessions, some of which are blocking each other.
When analyzing Oracle locks, some of the key database views you must examine are the V$LOCK and the V$SESSION views. The V$LOCKED_OBJECT and the DBA_OBJECTS views are also very useful in identifying the locked objects. In order to find out whether a session is being blocked by the locks being applied by another session, you can execute the following query:
SQL> select s1.username || '@' || s1.machine

  2  || ' ( SID=' || s1.sid || ' )  is blocking '

  3  || s2.username || '@' || s2.machine || ' ( SID=' || s2.sid || ' ) ' AS blocking_status

  4  from v$lock l1, v$session s1, v$lock l2, v$session s2

  5  where s1.sid=l1.sid and s2.sid=l2.sid

  6  and l1.BLOCK=1 and l2.request > 0

  7  and l1.id1 = l2.id1

  8  and l2.id2 = l2.id2 ;


BLOCKING_STATUS

--------------------------------------------------------------------


HR@MIROMIROPC61 ( SID=68 )  is blocking SH@MIROMIROPC61 ( SID=81 )


SQL>
The output of the query shows the blocking session as well as all the blocked sessions.
A quick way to find out if you have any blocking locks in your instance at all, for any user, is to simply run the following query:
SQL> select * from V$lock where block > 0;
If you don't get any rows back from this query—good—you don't have any blocking locks in the instance right now! We'll explain this view in more detail in the explanation section.
How It Works
Oracle uses two types of locks to prevent destructive behavior: exclusive and shared locks. Only one transaction can obtain an exclusive lock on a row or a table, while multiple shared locks can be obtained on the same object. Oracle uses locks at two levels—row and table levels. Row locks, indicated by the symbol TX, lock just a single row of a table for each row that'll be modified by a DML statement such as INSERT, UPDATE, and DELETE. This is true also for a MERGE or a SELECT … FOR UPDATE statement. The transaction that includes one of these statements grabs an exclusive row lock as well as a row share table lock. The transaction (and the session) will hold these locks until it commits or rolls back the statement. Until it does one of these two things, all other sessions that intend to modify that particular row are blocked. Note that each time a transaction intends to modify a row or rows of a table, it holds a table lock (TM) as well on that table, to prevent the database from allowing any DDL operations (such as DROP TABLE) on that table while the transaction is trying to modify some of its rows.
In an Oracle database, locking works this way:
- A reader won't block another reader.
- A reader won't block a writer.
- A writer won't block a reader of the same data.
- A writer will block another writer that wants to modify the same data.
It's the last case in the list, where two sessions intend to modify the same data in a table, that Oracle's automatic locking kicks in, to prevent destructive behavior. The first transaction that contains the statement that updates an existing row will get an exclusive lock on that row. While the first session that locks a row continues to hold that lock (until it issues a COMMIT or ROLLBACK statement), other sessions can modify any other rows in that table other than the locked row. The concomitant table lock held by the first session is merely intended to prevent any other sessions from issuing a DDL statement to alter the table's structure. Oracle uses a sophisticated locking mechanism whereby a row-level lock isn't automatically escalated to the table, or even the block level.
5-13. Identifying Blocked and Blocking Sessions
Problem
You notice enqueue locks in your database and suspect that a blocking lock may be holding up other sessions. You'd like to identify the blocking and the blocked sessions.
Solution
When you see an enqueue wait event in an Oracle database, chances are that it's a locking phenomenon that's holding up some sessions from executing their SQL statements. When a session waits on an “enqueue” wait event, that session is waiting for a lock that's held by a different session. The blocking session is holding the lock in a mode that's incompatible with the lock mode that's being requested by the blocked session. You can issue the following command to view information about the blocked and the blocking sessions:
SQL> select decode(request,0,'Holder: ','Waiter: ')||sid sess,

     id1, id2, lmode, request, type

     from v$lock

     where (id1, id2, type) in

     (select id1, id2, type from v$lock where request>0)

     order by id1, request;
The V$LOCK view shows if there are any blocking locks in the instance. If there are blocking locks, it also shows the blocking session(s) and the blocked session(s). Note that a blocking session can block multiple sessions simultaneously, if all of them need the same object that's being blocked. Here's an example that shows there are locks present:
SQL> select sid,type,lmode,request,ctime,block from v$lock;


       SID           TY           LMODE         REQUEST       CTIME        BLOCK

--------------     --------     -----------    -----------   --------     -------

       127           MR              4             0         102870          0

        81           TX              0             6            778          0

       191           AE              4             0            758          0

       205           AE              4             0            579          0

       140           AE              4             0          11655          0

        68           TM              3             0            826          0

        68           TX              6             0            826          1

…

SQL>
The key column to watch is the BLOCK column—the blocking session will have the value 1 for this column. In our example, session 68 is the blocking session, because it shows the value 1 under the BLOCK column. Thus, the V$LOCK view confirms our initial finding in the “Solution” section of this recipe. The blocking session, with a SID of 68, also shows a lock mode 6 under the LMODE column, indicating that it's holding this lock in the exclusive mode—this is the reason session 81 is “hanging,” unable to perform its update operation. The blocked session, of course, is the victim—so it shows a value of 0 in the BLOCK column. It also shows a value of 6 under the REQUEST column, because it's requesting a lock in the exclusive mode to perform its update of the column. The blocking session, in turn, will show a value of 0 for the REQUEST column, because it isn't requesting any locks—it's already holding it.
If you want to find out the wait class and for how long a blocking session has been blocking others, you can do so by querying the V$SESSION view, as shown here:
SQL> select  blocking_session, sid,  wait_class,

     seconds_in_wait

     from     v$session

     where blocking_session is not NULL

     order by blocking_session;


BLOCKING_SESSION        SID        WAIT_CLASS        SECONDS_IN_WAIT

-----------------    --------       -------------    ----------------

      68                81          Application                  7069


SQL>
The query shows that the session with SID=68 is blocking the session with SID=81, and the block started 7,069 seconds ago.
How It Works
The following are the most common types of enqueue locks you'll see in an Oracle database:
TX: These are due to a transaction lock and usually caused by faulty application logic.TM: These are table-level DML locks, and the most common cause is that you haven't indexed foreign key constraints in a child table.
In addition, you are also likely to notice ST enqueue locks on occasion. These indicate sessions that are waiting while Oracle is performing space management operations, such as the allocation of temporary segments for performing a sort.
5-14. Dealing with a Blocking Lock
Problem
You've identified blocking locks in your database. You want to know how to deal with those locks.
Solution
There are two basic strategies when dealing with a blocking lock—a short-term and a long-term strategy. The first thing you need to do is get rid of the blocking lock, so the sessions don't keep queuing up—it's not at all uncommon for a single blocking lock to result in dozens and even hundreds of sessions, all waiting for the blocked object. Since you already know the SID of the blocking session (session 68 in our example), just kill the session in this way, after first querying the V$SESSION view for the corresponding serial# for the session:
SQL> alter system kill session '68, 1234';
The short-term solution is to quickly get rid of the blocking locks so they don't hurt the performance of your database. You get rid of them by simply killing the blocking session. If you see a long queue of blocked sessions waiting behind a blocking session, kill the blocking session so that the other sessions can get going.
For the long run, though, you must investigate why the blocking session is behaving the way that it is. Usually, you'll find a flaw in the application logic. You may, though, need to dig deep into the SQL code that the blocking session is executing.
How It Works
In this example, obviously, the blocking lock is a DML lock. However, even if you didn't know this ahead of time, you can figure out the type of lock by examining the TYPE (TY) column of the V$LOCK view. Oracle uses several types of internal “system” locks to maintain the library cache and other instance-related components, but those locks are normal and you won't find anything related to those locks in the V$LOCK view.
For DML operations, Oracle uses two basic types of locks—transaction locks (TX) and DML locks (TM). There is also a third type of lock, a user lock (UL), but it doesn't play a role in troubleshooting general locking issues. Transaction locks are the most frequent type of locks you'll encounter when troubleshooting Oracle locking issues. Each time a transaction modifies data, it invokes a TX lock, which is a row transaction lock. The DML lock, TM, on the other hand, is acquired once for each object that's being changed by a DML statement.
The LMODE column shows the lock mode, with a value of 6 indicating an exclusive lock. The REQUEST column shows the requested lock mode. The session that first modifies a row will hold an exclusive lock with LMODE=6. This session's REQUEST column will show a value of 0, since it's not requesting a lock¬—it already has one! The blocked session needs but can't obtain an exclusive lock on the same rows, so it requests a TX in the exclusive mode (MODE=6) as well. So, the blocked session's REQUEST column will show a value of 6, and its LMODE column a value of 0 (a blocked session has no lock at all in any mode).
The preceding discussion applies to row locks, which are always taken in the exclusive mode. A TM lock is normally acquired in mode 3, which is a Shared Row Exclusive mode, whereas a DDL statement will need a TM exclusive lock.
5-15. Identifying a Locked Object
Problem
You are aware of a locking situation, and you'd like to find out the object that's being locked.
Solution
You can find the locked object's identity by looking at the value of the ID1 (LockIdentifier) column in the V$LOCK view (see Recipe 5-13). The value of the ID1 column where the TYPE column is TM (DML enqueue) identifies the locked object. Let's say you've ascertained that the value of the ID1 column is 99999. You can then issue the following query to identify the locked table:
SQL> select object_name from dba_objects where object_id=99999;


OBJECT_NAME

------------

TEST

SQL>
An even easier way is to use the V$LOCKED_OBJECT view to find out the locked object, the object type, and the owner of the object.
SQL> select lpad(' ',decode(l.xidusn,0,3,0)) || l.oracle_username "User",

     o.owner, o.object_name, o.object_type

     from v$locked_object l, dba_objects o

     where l.object_id = o.object_id

     order by o.object_id, 1 desc;
User       OWNER      OBJECT_NAME      OBJECT_TYPE

------     ------     ------------     ------------

HR         HR         TEST             TABLE

SH         HR         TEST             TABLE


SQL>
Note that the query shows both the blocking and the blocked users.
How It Works
As the “Solution” section shows, it's rather easy to identify a locked object. You can certainly use Oracle Enterprise Manager to quickly identify a locked object, the ROWID of the object involved in the lock, and the SQL statement that's responsible for the locks. However, it's always important to understand the underlying Oracle views that contain the locking information, and that's what this recipe demonstrates. Using the queries shown in this recipe, you can easily identify a locked object without recourse to a monitoring tool such as Oracle Enterprise Manager, for example.
In the example shown in the solution, the locked object was a table, but it could be any other type of object, including a PL/SQL package. Often, it turns out that the reason a query is just hanging is that one of the objects the query needs is locked. You may have to kill the session holding the lock on the object before other users can access the object.
5-16. Resolving enq: TM Lock Contention
Problem
Several sessions in your database are taking a very long time to process some insert statements. As a result, the “active” sessions count is very high and the database is unable to accept new session connections. Upon checking, you find that the database is experiencing a lot of enq: TM – contention wait events.
Solution
The enq: TM – contention event is usually due to missing foreign key constraints on a table that's part of an Oracle DML operation. Once you fix the problem by adding the foreign key constraint to the relevant table, the enq: TM – contention event will go away.
The waits on the enq: TM – contention event for the sessions that are waiting to perform insert operations are almost always due to an unindexed foreign key constraint.. This happens when a dependent or child table's foreign key constraint that references a parent table is missing an index on the associated key. Oracle acquires a table lock on a child table if it's performing modifications on the primary key column in the parent table that's referenced by the foreign key of the child table. Note that these are full table locks (TM), and not row-level locks (TX)—thus, these locks aren't restricted to a row but to the entire table. Naturally, once this table lock is acquired, Oracle will block all other sessions that seek to modify the child table's data. Once you create an index in the child table performing on the column that references the parent table, the waits due to the TM contention will go away.
How It Works
Oracle takes out an exclusive lock on a child table if you don't index the foreign key constraints in that table. To illustrate how an unindexed foreign key will result in contention due to locking, we use the following example. Create two tables, STORES and PRODUCTS, as shown here:
SQL> create table stores

     (store_id     number(10)     not null,

     supplier_name     varchar2(40)     not null,

     constraint stores_pk PRIMARY KEY (store_id));

SQL>create table products

    (product_id     number(10)     not null,

    product_name    varchar2(30)    not null,

    supplier_id     number(10)     not null,

    store_id     number(10)     not null,

    constraint fk_stores

    foreign key (store_id)

    references stores(store_id)

    on delete cascade);
If you now delete any rows in the STORES table, you'll notice waits due to locking. You can get rid of these waits by simply creating an index on the column you've specified as the foreign key in the PRODUCTS table:
create index fk_stores on products(store_id);
You can find all unindexed foreign key constraints in your database by issuing the following query:
SQL> select * from (

     select c.table_name, co.column_name, co.position column_position

     from   user_constraints c, user_cons_columns co

     where  c.constraint_name = co.constraint_name

     and   c.constraint_type = 'R'

     minus

     select ui.table_name, uic.column_name, uic.column_position

     from   user_indexes ui, user_ind_columns uic

     where  ui.index_name = uic.index_name

     )

     order by table_name, column_position;
If you don't index a foreign key column, you'll notice the child table is often locked, thus leading to contention-related waits. Oracle recommends that you always index your foreign keys.
![]() Tip If the matching unique or primary key for a child table's foreign key never gets updated or deleted, you don't have to index the foreign key column in the child table.
Tip If the matching unique or primary key for a child table's foreign key never gets updated or deleted, you don't have to index the foreign key column in the child table.
Oracle will tend to acquire a table lock on the child table if you don't index the foreign key column. If you insert a row into the parent table, the parent table doesn't acquire a lock on the child table; however, if you update or delete a row in the parent table, the database will acquire a full table lock on the child table. That is, any modifications to the primary key in the parent table will result in a full table lock (TM) on the child table. In our example, the STORES table is a parent of the PRODUCTS table, which contains the foreign key STORE_ID. The table PRODUCTS being a dependent table, the values of the STORE_ID column in that table must match the values of the unique or primary key of the parent table, STORES. In this case, the STORE_ID column in the STORES table is the primary key of that table.
Whenever you modify the parent table's (STORES) primary key, the database acquires a full table lock on the PRODUCTS table. Other sessions can't change any values in the PRODUCTS table, including the columns other than the foreign key column. The sessions can only query but not modify the PRODUCTS table. During this time, any sessions attempting to modify any column in the PRODUCTS table will have to wait (TM: enq contention wait). Oracle will release this lock on the child table PRODUCTS only after it finishes modifying the primary key in the parent table, STORES. If you have a bunch of sessions waiting to modify data in the PRODUCTS table, they'll all have to wait, and the active session count naturally will go up very fast, if you've an online transaction processing–type database that has many users that perform short DML operations. Note that any DML operations you perform on the child table don't require a table lock on the parent table.
5-17. Identifying Recently Locked Sessions
Problem
A session is experiencing severe waits in the database, most likely due to a blocking lock placed by another session. You've tried to use the V$LOCK and other views to drill deeper into the locking issue, but are unable to “capture” the lock while it's in place. You'd like to use a different view to “see” the older locking data that you might have missed while the locking was going on.
Solution
You can execute the following statement based on ASH, to find out information about all locks held in the database during the previous five minutes. Of course, you can vary the time interval to a smaller or larger period, so long as there's ASH data covering that time period.
SQL> select to_char(h.sample_time, 'HH24:MI:SS') TIME,h.session_id,

     decode(h.session_state, 'WAITING' ,h.event, h.session_state) STATE,

     h.sql_id,

     h.blocking_session BLOCKER

     from v$active_session_history h, dba_users u

     where u.user_id = h.user_id

     and h.sample_time > SYSTIMESTAMP-(2/1440);


TIME            SID                      STATE                      SQL_ID          BLOCKER

------------   -----      -----------------------------------     -------------    ---------

17:00:52        197         116 enq: TX - row lock contention     094w6n53tnywr     191

17:00:51        197         116 enq: TX - row lock contention     094w6n53tnywr     191

17:00:50        197         116 enq: TX - row lock contention     094w6n53tnywr     191


…


SQL>
You can see that ASH has recorded all the blocks placed by session 1, the blocking session (SID=191) that led to a “hanging” situation for session 2, the blocked session (SID=197).
How It works
Often, when your database users complain about a performance problem, you may query the V$SESSION or V$LOCK views, but you may not find anything useful there, because the wait issue may have been already resolved by then. In these circumstances you can query the V$ACTIVE_SESSION_HISTORY view to find out what transpired in the database during the previous 60 minutes. This view offers a window into the Active Session History (ASH), which is a memory buffer that collects information about all active sessions, every second. The V$ACTIVE_SESSION_HISTORY contains one row for each active session, and newer information continuously overwrites older data, since ASH is a rolling buffer.
We can best demonstrate the solution by creating the scenario that we're discussing, and then working through that scenario. Begin by creating a test table with a couple of columns:
SQL>  create table test (name varchar(20), id number (4));

Table created.

SQL>
Insert some data into the test table.
SQL> insert into test values ('alapati','9999'),

1 row created.

SQL> insert into test values ('sam', '1111'),

1 row created.

SQL> commit;

Commit complete.

SQL>
In session 1 (the current session), execute a SELECT * FOR UPDATE statement on the table TEST—this will place a lock on that table.
SQL> select * from test for update;


SQL>
In a different session, session 2, execute the following UPDATE statement:
SQL> update test set name='Jackson' where id = '9999';
Session 2 will hang now, because it's being blocked by the SELECT FOR UPDATE statement issued by session 1. Go ahead now and issue either a ROLLBACK or a COMMIT from session 1:
SQL> rollback;

Rollback complete.

SQL>
When you issue the ROLLBACK statement, session 1 releases all locks it's currently holding on table TEST. You'll notice that session 2, which has been blocked thus far, immediately processes the UPDATE statement, which was previously “hanging,” waiting for the lock held by session 2.
Therefore, we know for sure that there was a blocking lock in your database for a brief period, with session 1 the blocking session, and session 2 the blocked session. You can't find any evidence of this in the V$LOCK view, though, because that and all other lock-related views show you details only about currently held locks. Here's where the Active Session History views shine—they can provide you information about locks that have been held recently but are gone already before you can view them with a query on the V$LOCK or V$SESSION views.
![]() Caution Be careful when executing the Active Session History (ASH) query shown in the “Solution” section of this recipe. As the first column (
Caution Be careful when executing the Active Session History (ASH) query shown in the “Solution” section of this recipe. As the first column (SAMPLE_TIME) shows, ASH will record session information every second. If you execute this query over a long time frame, you may get a very large amount of output just repeating the same locking information. To deal with that output, you may specify the SET PAUSE ON option in SQL*Plus. That will pause the output every page, enabling you to scroll through a few rows of the output to identify the problem.
Use the following query to find out the wait events for which this session has waited during the past hour.
SQL> select sample_time, event, wait_time

     from v$active_session_history

     where session_id = 81

     and session_serial# = 422;
The column SAMPLE_TIME lets you know precisely when this session suffered a performance hit due to a specific wait event. You can identify the actual SQL statement that was being executed by this session during that period, by using the V$SQL view along with the V$ACTIVE_SESSION_HISTORY view, as shown here:
SQL> select sql_text, application_wait_time

     from v$sql

     where sql_id in ( select sql_id from v$active_session_history

     where sample_time =  '08-MAR-11 05.00.52.00 PM'

     and session_id = 68 and session_serial# = 422);
Alternatively, if you have the SQL_ID already from the V$ACTIVE_SESSION_HISTORY view, you can get the value for the SQL_TEXT column from the V$SQLAREA view, as shown here:
SQL> select sql_text FROM v$sqlarea WHERE sql_id = '7zfmhtu327zm0';
Once you have the SQL_ID, it's also easy to extract the SQL Plan for this SQL statement, by executing the following query based on the DBMS_XPLAN package:
SQL> select * FROM table(dbms_xplan.display_awr('7zfmhtu327zm0'));
The background process MMON flushes ASH data to disk every hour, when the AWR snapshot is created. What happens when MMON flushes ASH data to disk? Well, you won't be able to query older data any longer with the V$ACTIVE_SESSION_HISTORY view. Not to worry, because you can still use the DBA_HIST_ACTIVE_SESS_HISTORY view to query the older data. The structure of this view is similar to that of the V$ACTIVE_SESSION_HISTORY view. The DBA_HIST_ACTIVE_SESS_HISTORY view shows the history of the contents of the in-memory active session history of recent system activity. You can also query the V$SESSION_WAIT_HISTORY view to examine the last ten wait events for a session, while it's still active. This view offers more reliable information for very recent wait events than the V$SESSION and V$SESSION_WAIT views, both of which show wait information for only the most recent wait. Here's a typical query using the V$SESSION_WAIT_HISTORY view.
SQL> select sid from v$session_wait_history

     where wait_time = (select max(wait_time) from v$session_wait_history);
Any non-zero values under the WAIT_TIME column represent the time waited by this session for the last wait event. A zero value for this column means that the session is waiting currently for a wait event.
5-18. Analyzing Recent Wait Events in a Database
Problem
You'd like to find out the most important waits in your database in the recent past, as well as the users, SQL statements, and objects that are responsible for most of those waits.
Solution
Query the V$ACTIVE_SESSION_HISTORY view to get information about the most common wait events, and the SQL statements, database objects, and users responsible for those waits. The following are some useful queries you can use.
To find the most important wait events in the last 15 minutes, issue the following query:
SQL> select event,

     sum(wait_time +

     time_waited) total_wait_time

     from v$active_session_history

     where sample_time between

     sysdate – 30/2880 and sysdate

     group by event

     order by total_wait_time desc
To find out which of your users experienced the most waits in the past 15 minutes, issue the following query:
SQL> select s.sid, s.username,

     sum(a.wait_time +

     a.time_waited) total_wait_time

     from v$active_session_history a,

     v$session s

     where a.sample_time between sysdate – 30/2880 and sysdate

     and a.session_id=s.sid

     group by s.sid, s.username

     order by total_wait_time desc;
Execute the following query to find out the objects with the highest waits.
SQL>select a.current_obj#, o.object_name, o.object_type, a.event,

    sum(a.wait_time +

    a.time_waited) total_wait_time

    from v$active_session_history a,

    dba_objects d

    where a.sample_time between sysdate – 30/2880 and sysdate
    and a.current_obj# = d.object_id

    group by a.current_obj#, d.object_name, d.object_type, a.event

    order by total_wait_time;
You can identify the SQL statements that have been waiting the most during the last 15 minutes with this query.
SQL> select a.user_id,u.username,s.sql_text,

     sum(a.wait_time + a.time_waited) total_wait_time

     from v$active_session_history a,

     v$sqlarea s,

     dba_users u

     where a.sample_time between sysdate – 30/2880 and sysdate

     and a.sql_id = s.sql_id

     and a.user_id = u.user_id

     group by a.user_id,s.sql_text, u.username;
How It Works
The “Solution” section shows how to join the V$ACTIVE_SESSION_HISTORY view with other views, such as the V$SESSION, V$SQLAREA, DBA_USERS, and DBA_OBJECTS views, to find out exactly what's causing the highest number of wait events or who's waiting the most, in the past few minutes. This information is extremely valuable when troubleshooting “live” database performance issues.
5-19. Identifying Time Spent Waiting Due to Locking
Problem
You want to identify the total time spent waiting by sessions due to locking issues.
Solution
You can use the following query to identify (and quantify) waits caused by locking of a table's rows. Since the query orders the wait events by time waited, you can quickly see which type of wait events accounts for most of the waits in your instance.
SQL> select wait_class, event, time_waited / 100 time_secs

  2  from v$system_event e

  3  where e.wait_class <> 'Idle' AND time_waited > 0

  4  union

  5  select 'Time Model', stat_name NAME,

  6  round ((value / 1000000), 2) time_secs

  7  from v$sys_time_model

  8  where stat_name NOT IN ('background elapsed time', 'background cpu time')

  9*  order by 3 desc;
WAIT_CLASS                                EVENT                    TIME_SECS

-------------------------       ------------------------------   --------------

System I/O                      log file parallel write                45066.32

System I/O                      control file sequential read           23254.41

Time Model                      DB time                                11083.91

Time Model                      sql execute elapsed time                7660.04

Concurrency                     latch: shared pool                      5928.73

Application                     enq: TX - row lock contention           3182.06

…

SQL>
In this example, the wait event enq: TX - row lock contention reveals the total time due to row lock enqueue wait events. Note that the shared pool latch events are classified under the Concurrency wait class, while the enqueue TX - row lock contention event is classified as an Application class wait event.
How It Works
The query in the “Solution” section joins the V$SYSTEM_EVENT and the V$SYS_TIME_MODEL views to show you the total time waited due to various wait events. In our case, we're interested in the total time waited due to enqueue locking. If you're interested in the total time waited by a specific session, you can use a couple of different V$ views to find out how long sessions have been in a wait state, but we recommend using the V$SESSION view, because it shows you various useful attributes of the blocking and blocked sessions. Here's an example showing how to find out how long a session has been blocked by another session.
SQL>select sid, username, event, blocking_session,

    seconds_in_wait, wait_time

    from v$session where state in ('WAITING'),
The query reveals the following about the session with SID 81, which is in a WAITING state:
SID  : 81 (this is the blocked session)

username: SH (user who's being blocked right now)

event: TX - row lock contention (shows the exact type of lock contention)

blocking session: 68 (this is the "blocker")

seconds_in_wait: 3692 (how long the blocked session is in this state)
The query reveals that the user SH, with a SID of 81, has been blocked for almost an hour (3,692 seconds). User SH is shown as waiting for a lock on a table that is currently locked by session 68. While the V$SESSION view is highly useful for identifying the blocking and blocked sessions, it can't tell you the SQL statement that's involved in the blocking of the table. Often, identifying the SQL statement that's involved in a blocking situation helps in finding out exactly why the statement is leading to the locking behavior. To find out the actual SQL statement that's involved, you must join the V$SESSION and the V$SQL views, as shown here.
SQL> select sid, sql_text

     from v$session s, v$sql q

     where sid in (68,81)

     and (

     q.sql_id = s.sql_id or  q.sql_id = s.prev_sql_id)

SQL> /


     SID                       SQL_TEXT

-------------     -----------------------------------------------------

     68           select * from test for update

     81           update hr.test set name='nalapati' where user_id=1111


SQL>
The output of the query shows that session 81 is being blocked because it's trying to update a row in a table that has been locked by session 68, using the SELECT … FOR UPDATE statement. In cases such as this, if you find a long queue of user sessions being blocked by another session, you must kill the blocking session so the other sessions can process their work. You'll also see a high active user count in the database during these situations—killing the blocking session offers you an immediate solution to resolving contention caused by enqueue locks. Later on, you can investigate why the blocks are occurring, so as to prevent these situations.
For any session, you can identify the total time waited by a session for each wait class, by issuing the following query:
SQL> select wait_class_id, wait_class,

     total_waits, time_waited

     from v$session_wait_class

     where sid = <SID>;
If you find, for example, that this session endured a very high number of waits in the application wait class (wait class ID for this class is 4217450380), you can issue the following query using the V$SYSTEM_EVENT view, to find out exactly which waits are responsible:
SQL> select event, total_waits, time_waited

     from v$system_event e, v$event_name n

     where n.event_id = e.event_id

     and e.wait_class_id = 4217450380;


EVENT                                    TOTAL_WAITS             TIME_WAITED

----------------------        ----------------------     --------------------


enq: TM - contention                              82                      475

…

SQL>
In our example, the waits in the application class (ID 4217450380) are due to locking contention as revealed by the wait event enq:TM - contention. You can further use the V$EVENT_HISTOGRAM view, to find out how many times and for how long sessions have waited for a specific wait event since you started the instance. Here's the query you need to execute to find out the wait time pattern for enqueue lock waits:
SQL> select wait_time_milli bucket, wait_count

     from v$event_histogram

     where event = 'enq: TX - row lock contention';
A high amount of enqueue waits due to locking behavior is usually due to faulty application design. You'll sometimes encounter this when an application executes many updates against the same row or a set of rows. Since this type of high waits due to locking is due to inappropriately designed applications, there's not much you can do by yourself to reduce these waits. Let your application team know why these waits are occurring, and ask them to consider modifying the application logic to avoid the waits.
Any of the following four DML statements can cause locking contention: INSERT, UPDATE, DELETE, and SELECT FOR UPDATE. INSERT statements wait for a lock because another session is attempting to insert a row with an identical value. This usually happens when you have a table that has a primary key or unique constraint, with the application generating the keys. Use an Oracle sequence instead to generate the key values, to avoid these types of locking situations. You can specify the NOWAIT option with a SELECT FOR UPDATE statement to eliminate session blocking due to locks. You can also use the SELECT FOR UPDATE NOWAIT statement to avoid waiting by sessions for locks when they issue an UPDATE or DELETE statement. The SELECT FOR UPDATE NOWAIT statement locks the row without waiting.
5-20. Minimizing Latch Contention
Problem
You're seeing a high number of latch waits, and you'd like to reduce the latch contention.
Solution
Severe latch contention can slow your database down noticeably. When you're dealing with a latch contention issue, start by executing the following query to find out the specific types of latches and the total wait time caused by each wait.
SQL> select event, sum(P3), sum(seconds_in_wait) seconds_in_wait

     from v$session_wait

     where event like 'latch%'

     group by event;
The previous query shows the latches that are currently being waited for by this session. To find out the amount of time the entire instance has waited for various latches, execute the following SQL statement.
SQL> select wait_class, event, time_waited / 100 time_secs

     from v$system_event e

     where e.wait_class <> 'Idle' AND time_waited > 0

     union

     select 'Time Model', stat_name NAME,

     round ((value / 1000000), 2) time_secs

     from v$sys_time_model

     where stat_name not in ('background elapsed time', 'background cpu time')

     order by 3 desc;


WAIT_CLASS                                EVENT                     TIME_SECS

--------------------         ----------------------------       -----------------

Concurrency                  library cache pin                             622.24

Concurrency                  latch: library cache                          428.23

Concurrency                  latch: library cache lock                      93.24

Concurrency                  library cache lock                             24.20

Concurrency                  latch: library cache pin                       60.28

-
The partial output from the query shows the latch-related wait events, which are part of the Concurrency wait class.
You can also view the top five wait events in the AWR report to see if lache contention is an issue, as shown here:
Event                         Waits           Time (s)     (ms)      Time      Wait Class

------------------------   ------------    ----------    -------   --------   ------------

db file sequential read      42,005,780       232,838          6       73.8      User I/O

CPU time                                      124,672                  39.5      Other

latch free                   11,592,952        76,746          7       24.3      Other

wait list latch free            107,553         2,088         19        0.7      Other

latch: library cache          1,135,976         1,862          2        0.6      Concurrency
Here are the most common Oracle latch wait types and how you can reduce them.
Shared poolandlibrary latches: These are caused mostly by the database repeatedly executing the same SQL statement that varies slightly each time. For example, a database may execute a SQL statement 10,000 times, each time with a different value for a variable. The solution in all such cases is to use bind variables. An application that explicitly closes all cursors after each execution may also contribute to this type of wait. The solution for this is to specify theCURSOR_SPACE_FOR_TIMEinitialization parameter. Too small a shared pool may also contribute to the latch problem, so check your SGA size.
Cache buffers LRU chain: These latch events are usually due to excessive buffer cache usage and may be caused both by excessive physical reads as well as logical reads. Either the database is performing large full table scans, or it's performing large index range scans. The usual cause for these types of latch waits is either the lack of an index or the presence of an unselective index. Also check to see if you need to increase the size of the buffer cache.
Cache buffer chains: These waits are due to one or more hot blocks that are being repeatedly accessed. Application code that updates a table's rows to generate sequence numbers, rather than using an Oracle sequence, can result in such hot blocks. You might also see the cache buffer chains wait event when too many processes are scanning an unselective index with similar predicates.
Also, if you're using Oracle sequences, re-create them with a larger cache size setting and try to avoid using the ORDER clause. The CACHE clause for a sequence determines the number of sequence values the database must cache in the SGA. If your database is processing a large number of inserts and updates, consider increasing the cache size to avoid contention for sequence values. By default, the cache is set to 20 values. Contention can result if values are being requested fast enough to frequently deplete the cache. If you're dealing with a RAC environment, using the NOORDER clause will prevent enqueue contention due to the forced ordering of queued sequence values.
How It Works
Oracle uses internal locks called latches to protect various memory structures. When a server process attempts to get a latch but fails to do so, that attempt is counted as a latch free wait event. Oracle doesn't group all latch waits into a single latch free wait event. Oracle does use a generic latch free wait event, but this is only for the minor latch-related wait events. For the latches that are most common, Oracle uses various subgroups of latch wait events, with the name of the wait event type. You can identify the exact type of latch by looking at the latch event name. For example, the latch event latch: library cache indicates contention for library cache latches. Similarly, the latch: cache buffer chains event indicates contention for the buffer cache.
Oracle uses various types of latches to prevent multiple sessions from updating the same area of the SGA. Various database operations require sessions to read or update the SGA. For example, when a session reads a data block into the SGA from disk, it must modify the buffer cache least recently used chain. Similarly, when the database parses a SQL statement, that statement has to be added to the library cache component of the SGA. Oracle uses latches to prevent database operations from stepping on each other and corrupting the SGA.
A database operation needs to acquire and hold a latch for very brief periods, typically lasting a few nanoseconds. If a session fails to acquire a latch at first because the latch is already in use, the session will try a few times before going to “sleep.” The session will re-awaken and try a few more times, before going into the sleep mode again if it still can't acquire the latch it needs. Each time the session goes into the sleep mode, it stays longer there, thus increasing the time interval between subsequent attempts to acquire a latch. Thus, if there's a severe contention for latches in your database, it results in a severe degradation of response times and throughput.
Don't be surprised to see latch contention even in a well-designed database running on very fast hardware. Some amount of latch contention, especially the cache buffers chain latch events, is pretty much unavoidable. You should be concerned only if the latch waits are extremely high and are slowing down database performance.
Contention due to the library cache latches as well as shared pool latches is usually due to applications not using bind variables. If your application can't be recoded to incorporate bind variables, all's not lost. You can set the CURSOR_SHARING parameter to force Oracle to use bind variables, even if your application hasn't specified them in the code. You can choose between a setting of FORCE or SIMILAR for this parameter to force the substituting of bind variables for hard-coded values of variables. The default setting for this parameter is EXACT, which means that the database won't substitute bind variables for literal values. When you set the CURSOR_SHARING parameter to FORCE, Oracle converts all literals to bind variables. The SIMILAR setting causes a statement to use bind variables only if doing so doesn't change a statement's execution plan. Thus, the SIMILAR setting seems a safer way to go about forcing the database to use bind variables instead of literals. Although there are some concerns about the safety of setting the CURSOR_SHARING parameter to FORCE, we haven't seen any real issues with using this setting. The library cache contention usually disappears once you set the CURSOR_SHARING parameter to FORCE or to SIMILAR. The CURSOR_SHARING parameter is one of the few Oracle silver bullets that'll improve database performance immediately by eliminating latch contention. Use it with confidence when dealing with library cache latch contention.
The cache buffer chains latch contention is usually due to a session repeatedly reading the same data blocks. First identify the SQL statement that's responsible for the highest amount of the cache buffers chain latches and see if you can tune it. If this doesn't reduce the latch contention, you must identify the actual hot blocks that are being repeatedly read.
If a hot block belongs to an index segment, you may consider partitioning the table and using local indexes. For example, a hash partitioning scheme lets you spread the load among multiple partitioned indexes. You can also consider converting the table to a hash cluster based on the indexed columns. This way, you can avoid the index altogether. If the hot blocks belong to a table segment instead, you can still consider partitioning the table to spread the load across the partitions. You may also want to reconsider the application design to see why the same blocks are being repeatedly accessed, thus rendering them “hot.”
5-21. Managing Locks from Oracle Enterprise Manager
Problem
You'd like to find out how to handle locking issues through the Oracle Enterprise Manager Database Control GUI interface.
Solution
Instead of issuing multiple SQL queries to identify quickly disappearing locking events, you can use Oracle Enterprise Manager (OEM) DB Control to identify and resolve locking situations. You can find all current locks in the instance, including the blocking and the blocked sessions—you can can also kill the blocking session from OEM.
Here are the ways you can manage locking issues through OEM:
- In the Home page of DB Control, you'll see locking information in the Alerts table. Look for the User Block category to identify blocking sessions. The alert name you must look for is Blocking Session Count. Clicking the message link shown for this alert, such as “Session 68 is blocking 12 other sessions,” for example, will take you to the Blocking Session Count page. In the Alert History table on this page, you can view details about the blocking and blocked sessions.
Also in the Home page, under Related Alerts, you'll find the ADDM Performance table. Locking issues are revealed by the presence of the Row Lock Waits link. Click the Row Lock Waits link to go to the Row Lock Waits page. This page, shown in Figure 5-1, lets you view you all the SQL statements that were found waiting for row locks.
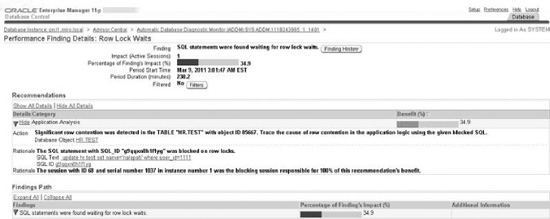
- You can also view blocking session details by clicking the Performance tab in the Home page. Click Blocking Sessions under the Additional Monitoring Links section to go to the Blocking Sessions page. The Blocking Sessions page contains details for both the blocking as well as the blocked sessions. You can see the exact wait event, which will be
enq: TX row lock contentionwhen one session blocks another. You can find out the exact SQL statement that's involved in blocking sessions, by clicking the SQL ID link on this page. You can kill the blocking session from this page by clicking the Kill Session button at the top left side of the page. - Also in the Additional Monitoring Links section is another link named Instance Locks, which takes you to the Instance Locks page. The Instance Locks page shows the session details for both the blocking and blocked sessions. You can click the SQL ID link to view the current SQL that's being executed by the blocker and the blocked sessions. You can also find out the name of the object that's locked. You can kill the blocking session by clicking the Kill Session button.
How It Works
You don't necessarily have to execute multiple SQL scripts to analyze locking behavior in your database. The SQL code we showed you earlier in various recipes was meant to explain how Oracle locking works. On a day-to-day basis, it's much more practical and efficient to just use OEM to quickly find out who's blocking a session and why.
5-22. Analyzing Waits from Oracle Enterprise Manager
Problem
You'd like to use Oracle Enterprise Manager to manage waits in your database instances.
Solution
The OEM interface lets you quickly analyze current waits in your database, instead of running SQL scripts to do so. In the Home page, the Active Sessions graph shows the relative amounts of waits, I/O, and CPU. Click the Waits link in this graph to view the Active Sessions graph. To the right of the graph, you'll see various links such as Concurrency, Application, Cluster, Administrative, User I/O, etc. Clicking each of these links will take you to a page that shows you all active sessions that are waiting for waits under that wait class. We summarize the wait events under the most important of these wait classes here.
User I/O: This shows wait events such asdb file scattered read,db file sequential read,direct path read,direct path write, andread by other session. You can click any of the links for the various waits to get a graph of the wait events. For example, clicking the “db file scattered read” link will take you to the histogram for the “Wait Event: db file scattered read” page.
System I/O: This shows waits due to thedb file parallel write,log file parallel write,control file parallel write, and thecontrol file sequential read waitevents.
Application: This shows active sessions waiting for events such as enqueue locks.
How It Works
Once you understand the theory behind the Oracle Wait Interface, you can use OEM to quickly analyze current wait events in your database. You can find out not only which wait events are adversely affecting performance, but also which SQL statement and which users are involved. All the details pages you can drill down to from the Active Session page show a graph of the particular wait event class from the time the instance started. The pages also contain tables named Top SQL and Top Users, which show exactly which SQL and users are affected by the wait event.