
So far we have learned to use force layout visualizing particles and links similar to how you would use force layout in its classic application, the forced-directed graph. This kind of visualization is what force layout was designed for in the first place. However, this is by no means the only way to utilize force in your visualization. In this recipe we will explore techniques that I call force-assisted visualization. With this technique you can add some randomness and arbitrariness into your visualization by leveraging force.
Open your local copy of the following file in your web browser:
https://github.com/NickQiZhu/d3-cookbook/blob/master/src/chapter11/arbitrary-visualization.html.
In this recipe we will generate bubbles on user mouse click. The bubbles are made of svg:path elements filled with gradient color. The svg:path elements are not strictly controlled by force layout though they are influenced by force, therefore, giving them the randomness required to simulate a bubble in real-life:
<svg>
    <defs>
        <radialGradient id="gradient" cx="50%" cy="50%" r="100%" fx="50%" fy="50%">
            <stop offset="0%" style="stop-color:blue;stop-opacity:0"/>
            <stop offset="100%" style="stop-color:rgb(255,255,255);stop-opacity:1"/>
        </radialGradient>
    </defs>
</svg>

<script type="text/javascript">
    var force = d3.layout.force()
            .gravity(0.1)
            .charge(-30)
            .friction(0.95)
            .linkDistance(20)
            .linkStrength(0.5);

    var duration = 10000;

    var svg = d3.select("svg");

    var line = d3.svg.line()
            .interpolate("basis-closed")
            .x(function(d){return d.x;})
            .y(function(d){return d.y;});

    force.size([svg.node().clientWidth, svg.node().clientHeight])
        .on("tick", function () {
            // omitted, will be discussed in details later
            ...
        });

    function offset() {
        return Math.random() * 100;
    }

    function createNodes(point) {
        // omitted, same as previous recipe
       ...
    }

    function createLinks(nodes) {
        // omitted, same as previous recipe
       ...
    }

    svg.on("click", function () {
        // omitted, will be discussed in details later
        ...
    });
</script>
This recipe generates force assisted bubbles on user mouse click as shown in the following screenshot:
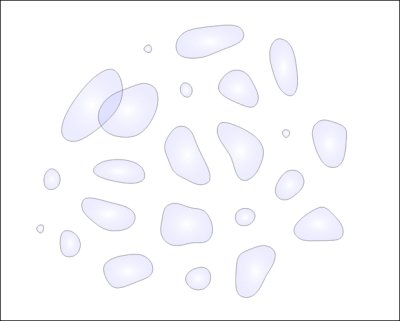
Force Assisted Bubbles
This recipe is built on top of what we have done in the previous recipe, therefore, its overall approach is quite similar to the last recipe in which we created force controlled particle rings on user mouse click. The major difference between this recipe and the last one is in this one we decided to use d3.svg.line generator to create the svg:path element that outlines our bubbles instead of using svg:circle and svg:line:
var line = d3.svg.line() // <-A
            .interpolate("basis-closed")
            .x(function(d){return d.x;})
            .y(function(d){return d.y;});
...
svg.on("click", function () {
        var point = d3.mouse(this),
                nodes = createNodes(point),
                links = createLinks(nodes);

        var circles = svg.append("path")
                .data([nodes])
            .attr("class", "bubble")
            .attr("fill", "url(#gradient)") // <-B
            .attr("d", function(d){return line(d);}) // <-C
                .transition().delay(duration)
            .attr("fill-opacity", 0)
            .attr("stroke-opacity", 0)
            .each("end", function(){d3.select(this).remove();});

        nodes.forEach(function (n) {force.nodes().push(n);});
        links.forEach(function (l) {force.links().push(l);});

        force.start();
});
On line A we created a line generator with basis-closed interpolation mode since this gives us the smoothest outline for our bubble. Whenever user clicks the mouse a svg:path element was created connecting all nodes (line C). Additionally, we also fill the bubble with our pre-defined gradient to give it a nice glow (line B). Finally, we also need to implement the force based positioning in the tick function:
force.size([svg.node().clientWidth, svg.node().clientHeight])
        .on("tick", function () {
            svg.selectAll("path")
                .attr("d", line);
        });
In the tick function we simply re-invoke the line generator function to update the d attribute for each path thus animating the bubbles using force layout computation.
- SVG Gradients and Patterns: http://www.w3.org/TR/SVG/pservers.html
- The Using line generator recipe in Chapter 7, Getting into Shape, for more information on D3 line generator