The QlikView Governance Dashboard is a tool provided by Qlik that allows you to import multiple data sources from your QlikView implementation and view all information in one place:

The Governance Dashboard is a QlikView application, and therefore, we can have different copies of this application for different purposes, for example:
- Complete access to all information (default)
- Access to just operational information
- Access to just document metadata
- Access to just a subset of documents
The install sets things up so that we can quickly create new profiles with different settings.
The installation will, by default, install to C:ProgramDataQlikTechGovernance_1.1. It will create a subfolder here called profiles and within that there will be three further subfolders:
Folder | Description |
|---|---|
| This contains the default dashboard that will be most people's first (and only!) use of it |
| A blank template containing all the files and subfolders that we will need to create a new profile |
| A template to use when we are performing analysis in a multicluster environment |
To create a new profile, we simply copy the entire template folder and rename the new folder to whatever name we want to call it. Now, we can open the Governance Dashboard.qvw file in this folder and configure the settings.
Before we run the Governance Dashboard reload, we need to configure the settings in the Configuration tab:
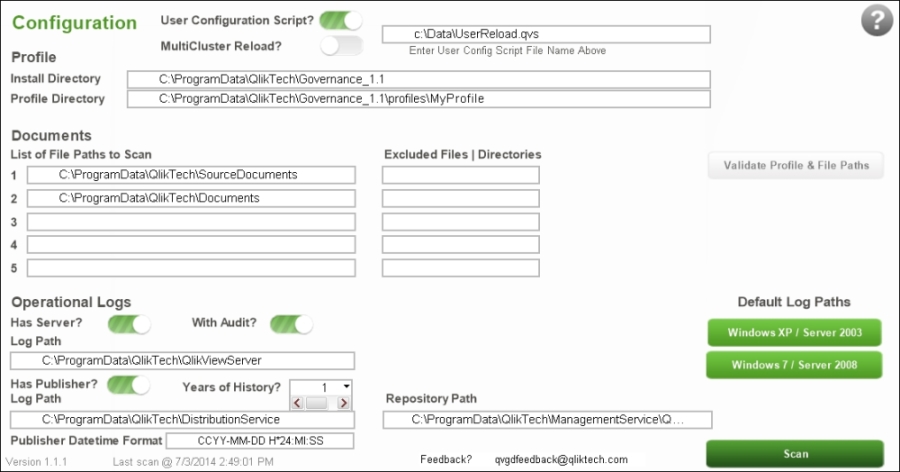
The main configuration areas are as follows:
Once the configuration has been entered, you can click on the Validate Profile & File Paths button to verify that all is valid. If a path is incorrect, an alert will be shown:

Once the configuration is entered and tested, we can click on the Scan button to begin the reload.
Note
You might get an error from the reload, and unfortunately, it is very difficult to know exactly what that error is because the entire script has been put into a hidden script and error messages are not displayed from within the hidden script:
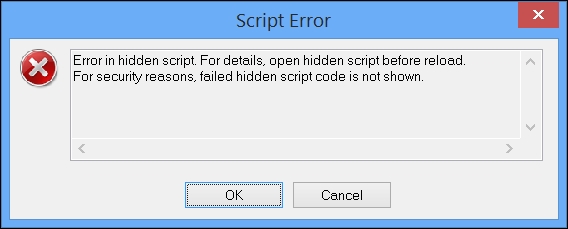
The only thing that you can immediately do is double-check all your configurations and see whether you have made a mistake somewhere. If you still have difficulties, get onto the Qlik Community and ask questions there.
Once the reload is complete, you can use operational dashboards to review information about applications that users use and when they use them:

The tabs under OPERATIONS provide you with the following information:
Tab | Description |
|---|---|
Server | This gives server memory usage statistics and is useful when analyzing for memory-related issues |
Publisher | This gives reload and other task statuses and times |
Sessions | This provides information on the number of sessions, users, and documents |
Log Details | This provides detailed log information, which is very good for error hunting |
The other side of the Governance Dashboard is the information on your applications such as complexity and data lineage. This is useful from many aspects of application maintenance, for example, being able to look at expressions and look for instances where an expression is actually used across multiple applications:

Note
In his blog post on the QlikView cache, Henric Cronström explains that the text of an expression is part of the cache key and so differences in case will make a difference! (http://community.qlik.com/blogs/qlikviewdesignblog/2014/04/14/the-qlikview-cache)
Sum([Claim Value]) is not the same as sum([Claim Value])!
The tabs in the APPLICATIONS area are as follows:
Tab | Description |
|---|---|
Complexity | This will assign a score to each application based on a number of metrics, such as number of objects, rows, and expressions. The more complex an application, the lower its performance is likely to be. |
Objects | This allows you to drill into the actual objects in each document to analyze which ones might be causing you problems, which ones have incorrect expressions, and so forth. |
Lineage | This will list all the data sources for an application and also allow you to discover which sources are shared across multiple applications. |