
Factors affecting the measurement of the permeability of concrete
Abstract:
In this chapter, it is shown that the interpretation of even fundamental tests for permeability such as the high pressure test described in Chapter 4 is not as simple as it would appear. It was observed that, depending on the strength of the sample, the permeability either increased or decreased during the testing process. Also the results were affected by sample size. This makes the measurements difficult to interpret due to experimental effects of sample size and changes of flow with time. However, the results did not change significantly with pressure, and results obtained for tests with water were not significantly different when synthetic leachate was tested.
Key words
permeability; sample size; effect of pressure; siltation; high pressure test
9.1 Introduction
The high pressure test described in Chapter 4 is the simplest test for permeability. No assumptions are made in the very simple analysis of the results. It is also unaffected by Knudsen flow and the ideal gas approximation described in Chapter 1 which affect the gas tests. It would therefore be assumed that this test would give reliable and unchanging results for permeability. However, a series of experiments described here show that this is not the case. At high pressures, the permeability of low strength samples increased during the test and it decreased for high strength samples. It is assumed that this would have been caused by fluid breaking through the pore walls in low strength samples and siltation at high strength. An effect of sample size was also observed, but the mechanism for this is not apparent.
9.2 Experimental programme
The objectives of the experiments were to establish the permeability of the different concretes and mortars in order to provide data which could be used in calculations of the performance of waste containment barriers for the application described in Chapter 15. In order to do this, an investigation has been carried out into the evolution of bulk permeability with increased sample volume and different pore pressure and specimen size. In all tests, the confining to pore pressure ratio was kept constant.
The specific objectives were to measure the following:
1. the permeability of the specimens to water;
2. the change in permeability in the presence of leachate;
3. the relationship between numbers of sample volumes passing and changes in permeability;
4. the effect of different residence times in the sample by running the test at different pressures and/or sample thicknesses – this determines the sensitivity of the observed permeability to changes in pressure;
5. the effect of sample size and boundary effects by testing samples in a larger cell.
9.2.1 Eluted liquids
Both deionised water and a synthetic (acetogenic) leachate have been eluted through the materials to examine their effects on permeability evolution of the mixes. The composition of the synthetic leachate used in this work was obtained by comparing the composition of various natural and synthetic leachates and is given in Table 9.1. This solution was chosen as it represents a leachate from the early (acetogenic) phase of a landfill and is therefore the most aggressive solution to which a cementitious barrier would be likely to be exposed. The evolution of leachate chemistry during the service life of a landfill, normally shows a decrease both in acidity and ionic strength as the landfill matures, so experiments using this solution are thought to be conservative.
9.2.2 Mix designs
The mixes were designed with consideration for requirements for strength, permeability, chemical conditioning capacity (‘through pH’) and cost–benefit analysis. The results of a screening programme on a large number of mixes led to the selection of three candidate mixes which satisfied the criteria. Two samples from each selected mix design were tested with leachate and two more were tested with water.
The designs of the three mixes are given in Table 9.2. Two of these mixes were Portland cement (PC) mortar mixes with different strengths and permeability coefficients and one other mix was one of the several cell mixes used for site trials. For one of the mixes, a low strength of about 5 MPa was deliberately engineered to find the effect of applied pore pressure and number of sample volumes eluted on the coefficient of permeability.
Table 9.2
Mix proportions and strength of the mortar mixes used for hydraulic conductivity study
| Mortar mix | Cementitious material | % by mass | Pozzolanic ash | % by mass | Fine aggregate (<5 mm) | % by mass | w/c ratio | 28 days strength (MPa) |
| Cement/quartz | PC | 11.8 | – | – | Quartz | 88.2 | 0.92 | 15 |
| Cement/quartz | PC | 16.7 | – | – | Quartz | 83.3 | 0.75 | 20 |
| Typical site trial mix | CKD | 20.7 | Lagoon ash | 13.6 | Ferro-silicate slag | 65.9 | 0.39 | 5 |

9.2.3 High pressure test
This is described in Section 4.2.2. Measurements were normally made after one sample volume (SV) of liquid had passed through the mortar specimens. Assuming an average permeability of 10−9 and a maximum leachate head of 1 m above the liner described in Chapter 15, this corresponds to 16 years of exposure in service. The specimens were cylindrical with either 54 mm diameter and about 30 mm thickness or 100 mm diameter and 55 mm thickness and were cured for 1 month before testing.
9.3 Results
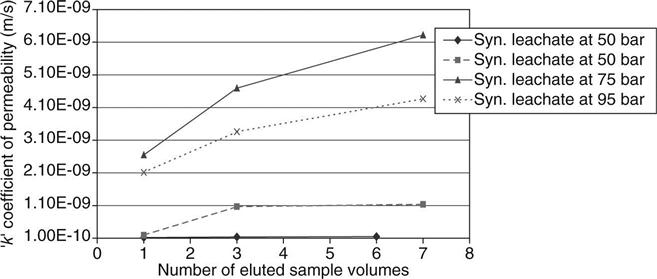
The effect of eluted volume on the coefficient of permeability at different pore solution pressures is shown in Figs 9.1–9.3. The effect of permeating a volume of liquid equal to seven times the sample volumes are shown in these figures. One sample volume shown on the graph represents a volume of fluid passing through the sample equal to the total overall volume of the sample itself, not just its porosity. For low strength materials, such as materials being used in the novel liner mixes, i.e. compressive strength of up to 5 MPa, increased eluted sample volumes slightly decrease the coefficient of permeability, but this is in contrast to higher strength materials in which the permeability increases. The author suggests that the reason for this is that high strength materials are rigid whereas low strength materials are compliant and weak bonding fine particles cause blockage of the pore routes in these types of materials by ‘silting’. In previous work by the author, Claisse and Unsworth (1996) found a slight decrease in intrinsic permeability coefficient after permeating 30 times the sample volumes for higher strength PC mixes. This may have been due to using concrete which contained coarse aggregate; however, the permeabilities for intermediate number of sample volumes passing were not determined so a more detailed comparison cannot be made. In the investigation reported here the results clearly indicated a decrease in hydraulic conductivity for lower strength mixes and a slight increase in permeability coefficient for the higher strength mixes with increasing number of permeating sample volumes.


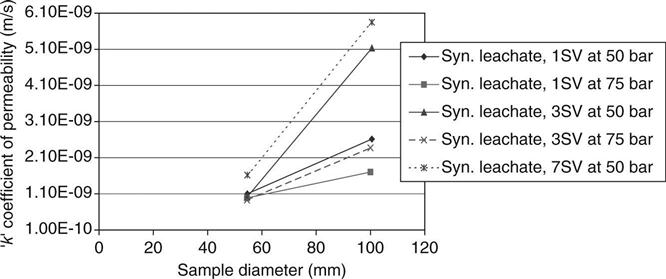
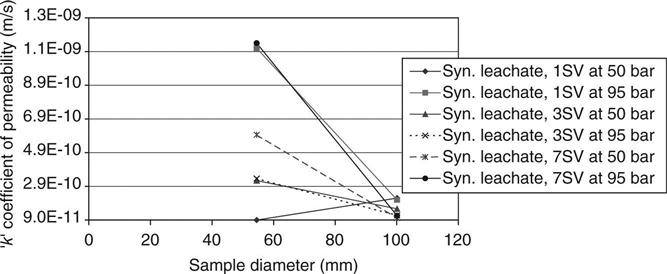
The effect of specimen size on the coefficient of permeability at different pore solution pressures is shown in Figs 9.4–9.6. Increasing the specimen size slightly increases the coefficient of permeability in lower strength mixes and decreases the coefficient in higher strength mixes. This trend is in agreement with findings from Figs 9.1–9.3 and, as high strength materials are rigid, larger volumes would reduce the permeability. From Figs 9.1–9.6, it can also be seen that the permeability coefficient does not change significantly with pore solution pressure.

9.4 Discussion
The following differences between the test conditions and site conditions may make the test results conservative:
• The samples were tested at early ages (normally 28 day). It is well known (Neville, 2011) that the permeability of concrete reduces substantially with age as the hydration progresses.
• The simulated leachate used for the experiments was free of all particulate matter. A typical leachate on site contains a large fraction of material with the potential for siltation in pores.
The following may make the conclusions unsafe:
• The results are to be used in a system with a leachate head up to 10 m. The applied pressure of up to 10 MPa in the testing represents a head of up to 1000 m. The calculations using the Darcy equation automatically assume that the flow will reduce linearly with pressure (i.e. the permeability will not change). While the present results do not prove that it will not change, they do not indicate any trend to show that it would.
• The area of a typical disposal cell is 1–2 ha while the experimental samples are six orders of magnitude smaller. The possibility of defects (which are a main consideration when modelling high density polyethylene – HDPE) must therefore be considered. The main defect in a concrete liner will be a crack, and this problem is addressed with the use of a clay layer which will extrude into and seal the cracks (trials of this method are reported in Section 15.6). The reason why larger laboratory samples appeared more permeable is not clear, but it is not indicated that this trend would be likely to continue up to site scale samples.
And the following appear to be well represented in the experiments:
• Each sample volume of fluid passing through the liner corresponds to at least 16 years of operation. The tests have been run for up to seven sample volumes, i.e. the equivalent of just over 100 years. Nuclear repositories are designed for very much longer periods, but for normal landfill design this is currently typical. Most current designs are based on a HDPE membrane with a design life no greater than this. The membrane is used with a mineral barrier (e.g. bentonite enhanced sand), but most modelling relies substantially on the membrane itself.
• The temperature of the trial cells has been monitored and did not deviate by more than a few degrees from typical room temperatures which were measured during laboratory testing.
9.5 Conclusions
• Depending on the strength, the cementitious mortar mixes behave differently with permeating number of sample volumes at the same pore pressure and age. For low strength materials such as controlled low strength materials, which are increasingly being used, increased eluted sample volumes slightly decrease the coefficient of permeability but this is in contrast to higher strength materials in which the coefficient of permeability increases.
• Increasing the testing specimen volume slightly increases the coefficient of permeability in lower strength mixes and decreases the coefficient in higher strength mixes.
• Variation in pore solution pressure during high pressure permeability test does not significantly affect the permeability coefficients in low strength cementitious mixes.
• Large site trials are a necessary step in establishing the performance of concrete barriers.