
Surface tests to determine transport properties of concrete – I: the tests
Abstract:
In this chapter, non-destructive surface permeability tests for in situ use are presented together with a ‘vacuum preconditioning’ method to make them more accurate. The main tests are the initial surface absorption test (ISAT) and the Figg test, and these are described. The ISAT measures water transport through the surface of concrete and the Figg measures air transport into a drilled hole. Additional tests are also described. A method for preconditioning the concrete by drying it with a vacuum and using indicating silica gel to monitor the progress is described. Experimental results are presented to show this is very effective.
Key words
initial surface absorption test (ISAT); Figg test; vacuum preconditioning; vacuum drying
3.1 Introduction
A great number of permeability tests are available in the literature. These tests can be used for quality control and compliance testing, during and immediately after construction, or to check the residual durability of existing structures. Four different ones are considered in this book: the standard ISAT and Figg described in Sections 3.2 and 3.3 and two variations on them, the APNS and CAT, which are described in Section 3.4. Table 3.1 shows that these cover four basic generic types.
Table 3.1
| Test procedure | Test geometry | |
| Surface | Drilled hole | |
| Apply vacuum and measure time for decay | Air permeability of near surface (APNS) | Figg air permeation index |
| Apply water and measure flow into concrete | Initial surface absorption test (ISAT) | Cover concrete absorption test (CAT) |

3.2 The initial surface absorption test (ISAT)
The test method was developed first by Levitt (1970) as a quality control test for precast concrete units. It is described in detail in BS 1881: Part 208 (BSI, 1996).
A cap of known area is clamped to the test surface (Fig. 3.1). Two pipes lead from the cap with one connecting to a reservoir, which can be isolated by a tap. The other is connected to a calibrated capillary tube, to measure the rate of absorption of water into the concrete below the cap by closing the tap (see Fig. 3.1). The initial surface absorption (ISA) is defined as the rate of flow of water into concrete per unit area at stated intervals from the start of the test. ISA10, which is the value at 10 min, is often quoted.
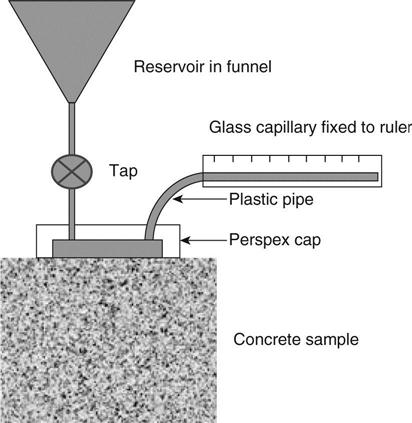
The standard specifies that the water head (i.e. the height of the funnel above the cap) should be 200 mm, but the author has found that it makes no difference if this is as much as a metre. It may be seen from the analysis presented in Chapter 4 that this head is not considered relevant because the capillary suction pressure is much larger.
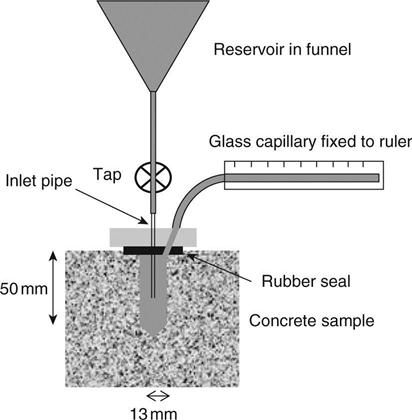
3.3 The Figg air permeation index
Figg (1973) developed a test for air and water permeability which involved a hole drilled into the concrete surface. Figg’s air permeability test method is based on reducing the pressure in the drilled hole in the concrete through a hypodermic needle using a vacuum pump. The rate at which the pressure subsequently returns to atmospheric gives a measure of the permeability of the concrete through which the air then flows.
For the tests reported here, a test hole of 50 mm depth and 13 mm diameter was drilled into the concrete. After thorough cleaning, the hole was plugged to a depth of 20 mm from the outside surface by poly ether foam and then sealed with a catalysed silicon rubber. When the rubber had set, a hypodermic needle was pushed through the plug (Fig. 3.2). The vacuum applied was 0.45 bar and the permeation index was taken as the time elapsed for the decay of the applied vacuum from 0.45 bar to 0.55 bar with the tap closed.

3.4 Other tests
3.4.1 The cover concrete absorption test (CAT)
This test uses the water measurement system of the ISAT test in a drilled hole similar to the Figg test. A hole of 13 ɸ × 50 mm is drilled into one of the surfaces (not the cast surface). A basic ISAT set-up is used but with a 13 mm internal diameter cap. An inlet tube located inside the sealed hole is used to supply water to the concrete test cavity as shown in Fig. 3.3. The procedure of carrying out CAT is the same as that for ISAT. The results are normally quoted as a flow per unit area where the area is the surface of the drilled hole. The water pressure is maintained at 200 mm head above the centre of the hole (but this is not critical, as noted above for the ISAT). The cover concrete absorption index CAT10 is the absorption at 10 min.
3.4.2 The air permeability of near surface (APNS) test
This test makes use of the cap from the ISAT test but measures vacuum decay in a similar manner to the Figg test. The APNS index is defined as the time in seconds for the pressure in the cap to rise from 0.01 to 0.9 bar.
At this point in the discussion, it may be observed that the water tests measure volumes rather than pressures. In the analysis that is developed in the next chapter it is shown that this means that they can be used to obtain values for permeability, while the gas tests, in their basic form as presented here, cannot. A solution to this problem is presented in Chapter 5.
3.5 Vacuum preconditioning: a development of the ISAT test
The major difficulty in applying all these tests in situ is that their measurements are substantially affected by the amount of water already present in the concrete. It has been shown that any uncertainties about the original moisture content lead to poor reproducibility of the results. The effect of moisture on gas migration is discussed in detail in Chapter 6 and it is shown to be very significant. For the water tests, any water already in the pores will clearly have a significant effect on subsequent absorption by capillary suction. There are two possible approaches to overcoming this problem. The first is to measure the moisture content and compensate for it in the results, and the second is to precondition the sample by removing the moisture.
Measurement of the moisture content of in situ concrete may be achieved by measuring the electrical impedance or radiation attenuation or by establishing hygral equilibrium between the in situ concrete and a specimen of which the moisture content may be established by weighing. When the relative humidity is below 90 %, some indication of the moisture content may be obtained by using a humidity probe in a drilled hole, although difficulties may be found in calibration. After establishing the moisture content, an extensive system of correction factors, taking into account the concrete grade, age, cement replacement materials, etc., would be used to calculate standard base values. The results could then be inaccurate, owing to errors arising from the test measurement itself, the measurement of moisture content or the correction factors. Thus the method of removing the moisture is considered to be a better solution.
Water will remain in concrete pores with entry diameters which are sufficiently small to sustain a meniscus. The conditions for this are given by the Kelvin equation:
[3.1]
where:
r is the pore radius (m)
RH is the relative humidity
m is the molecular weight of water = 0.018 kg
s is the surface tension of water = 0.073 N/m
ρ is the density of water = 1000 kg/m3
R is the gas constant = 8.3 J/mol/K and
T is the temperature = 290 K.
Applying this equation indicates that, at a typical external humidity of 70 %, no pores with radii greater than 3 nm will sustain a meniscus. The volume of pores in concrete with radii less than 3 nm is very small, so if concrete is in equilibrium with air at normal humidities in the UK it will be virtually dry. The practical difficulty for the purpose of preparing samples for permeation testing is the time taken to reach equilibrium. This will depend on the permeation properties of the concrete and the air flow at the surface.
The two possibilities for fast removal of water are raising the temperature and lowering the pressure. Raising the temperature of any part of an in situ sample, except for the immediate surface layer, would be difficult without a risk of damage from overheating. Lowering the pressure is, however, an attractive option. The maximum stress which may be applied in this way is one atmosphere, which is 0.1 N/mm2, and this is not likely to affect a typical concrete.
3.5.1 Use of indicating silica gel desiccant
The essential requirement for sample preconditioning is that it should be simple to replicate in order to give reproducible in situ ISAT results. The time required to extract the moisture with a vacuum will depend on the pressure and the initial moisture content, as well as the permeation properties of the sample. Similarly, the depth to which the moisture should be removed will depend on the depth of penetration in the ISAT test, and this in turn will depend on the permeation properties (and the amount of moisture in the sample). Attempting to establish fixed times for vacuum treatment would therefore be exceptionally difficult. Monitoring weight loss (which is used for oven drying) is obviously not possible for in situ work.
The vacuum was applied to the concrete surface using the cap from an ISAT apparatus, and the method chosen to determine the required application time of the vacuum was to place some silica gel indicator desiccant in the ISAT cap and to wait until the colour change was observed. Silica gel desiccant is widely available in the form of crystals which have been treated with an indicator which turns pink when moisture is present and blue when it is not. The time taken for the colour to change when in the vacuum on the concrete surface will depend on the pressure and humidity. The humidity in the vacuum depends upon the rate of moisture loss from the concrete, which in turn depends on the moisture content of the concrete surface as well as the pressure and the permeation properties. The time taken for the gel to change colour is therefore dependent on the same parameters which determine the time required for preconditioning.
3.5.2 Development work
The basic procedure using silica gel was established when laboratory work started, but it was necessary to develop the apparatus to ensure that the pressure was low enough to make it work at a practical rate. As an initial trial to determine whether the laboratory vacuum pump was performing adequately, it was tested to see if it could boil water at room temperature. The pump was unable to do this and was replaced, but even with the new pump the gel took 6–18 h to turn blue. A high vacuum gauge was then fitted to the system and this revealed numerous leaks in the pipework, the ISAT heads and the seals against the samples. When these leaks had been rectified the vacuum time was reduced to 1–6 h. It is the opinion of the author that the use of such a gauge is essential for this technique in order to monitor and minimise leakage. In order to enable work to proceed faster, a manifold was built to apply the vacuum to six specimens at the same time. However, this can only be used if the samples are relatively impermeable. The flow rates through permeable concrete decrease the vacuum head unacceptably.
3.5.3 Preparation of test samples
Two concrete mixes with mean strengths of 35 and 60 N/mm2 were used (Table 3.2). The test specimens, 100 mm cubes, were cast and kept under wet hessian for 1 day before demoulding. Two curing conditions were used: water curing at 20 °C and air curing at 20 °C, 55 % RH, until testing at 28 days.

3.5.4 Time for silica gel to indicate drying
As ISAT cap containing pink silica gel was placed against a dry impermeable acrylic surface and the time required for the gel to turn blue was recorded. The pressure was then adjusted by bleeding air into the system and the pressure–time relationship shown in Fig. 3.4 was developed. This shows that the relationship is linear starting from about 3 mbar. It was observed that, especially at low pressures, the times were greater if the oil in the vacuum pump was substantially contaminated with water. In order to achieve rapid drying, it is essential to remove this water and change the oil regularly. This problem may also be solved with a water-trap fitted to the inlet of the vacuum pump.

The times recorded using a dry impermeable surface represent the minima for preconditioning at the different pressures; moisture loss from a concrete surface always extended them. In practice, the vacuum pressure was determined by the permeability of the concrete; thus the time was less for concretes with low water to cement (w/c) ratios (in comparison with other mixes with the same initial moisture content). Typical times are given in Table 3.3. The air-cured samples are representative of site concrete, and the conditioning times of 30 and 90 min taken for 35 and 60 N/mm2 mixes, respectively, are acceptable for site application.

3.5.5 Progressive change of ISAT values
The 10 min ISAT results were plotted in Fig. 3.5. It can be seen that the ISAT value was virtually stabilised prior to the colour change of the silica gel.

3.5.6 Comparison with BS 1881 methods
The two preconditioning methods described in BS 1881-208 (BSI, 1996) for laboratory use are drying for two days in air and drying in an oven at 105 °C to constant weight. For site use, the test may only be carried out after a period of at least 48 h during which no water has fallen onto the test surface. The criterion for a preconditioning method to be effective is that it should give similar ISAT results on similar samples, regardless of the initial moisture content. The experimental design to test this was therefore based on sets of samples which had been cured in an identical manner and then brought to different moisture contents. The effectiveness of the new preconditioning system in giving similar results from each set was then compared with the BS 1881 laboratory methods.
The statistical F-test is used to compare the variability in the set preconditioned by vacuum with that in the sets preconditioned in the oven or in the laboratory for 2 days. Because the means of the sets were not equal, the coefficient of variation was used to calculate the variance ratio (F-ratio) (Kennedy and Neville, 1986). The two sided F-test was applied on the null hypothesis that the variation in results caused by the different moisture contents was the same for the different preconditioning methods. The critical value for the variance ratio is called the F-statistic. The F-statistic for 95 % confidence limits is 7.15 (both degrees of freedom being 5).
In addition, a fourth preconditioning treatment, in which a vacuum was applied for twice the time taken for the gel to turn blue, was used in order to see if further improvements could be obtained (this preconditioning is referred to as ‘twice vacuum’).
The following three methods were used to produce samples with a range of different moisture conditions:
1. vacuum-saturate for 2 h at 10–15 mbar (typical weight gain from dry curing 2 %);
For each of the two mixes, two curing conditions, three different moisture contents and four preconditioning methods, two samples were tested, giving a total of 96 samples. The results are given in Table 3.4.
Table 3.4
Comparison between different preconditioning methods
| Concrete grade (N/mm2) | Curing | Preconditioning | Mean ISA10 (× 10−2 ml/m2/s) | V of ISA10 (%) | F-statistic |
| 35 | Air | Vacuum dry | 80.7 | 8.4 | 1.0 |
| 2 day air | 69.9 | 40.4 | 22.9 | ||
| Oven dry | 122.8 | 6.7 | 1.6 | ||
| Twice vacuum | 86.3 | 8.4 | 1.0 | ||
| 35 | Water | Vacuum dry | 31.3 | 16.2 | 1.0 |
| 2 day air | 17.9 | 65.7 | 16.6 | ||
| Oven dry | 53.0 | 6.9 | 5.5 | ||
| Twice vacuum | 34.6 | 16.0 | 1.0 | ||
| 60 | Air | Vacuum dry | 44.9 | 15.2 | 1.0 |
| 2 day air | 24.5 | 54.9 | 13.0 | ||
| Oven dry | 65.1 | 7.7 | 3.9 | ||
| Twice vacuum | 46.3 | 15.0 | 1.0 | ||
| 60 | Water | Vacuum dry | 21.5 | 23.0 | 1.0 |
| 2 day air | 14.0 | 66.2 | 8.3 | ||
| Oven dry | 48.7 | 10.9 | 4.5 | ||
| Twice vacuum | 28.1 | 22.9 | 1.0 |
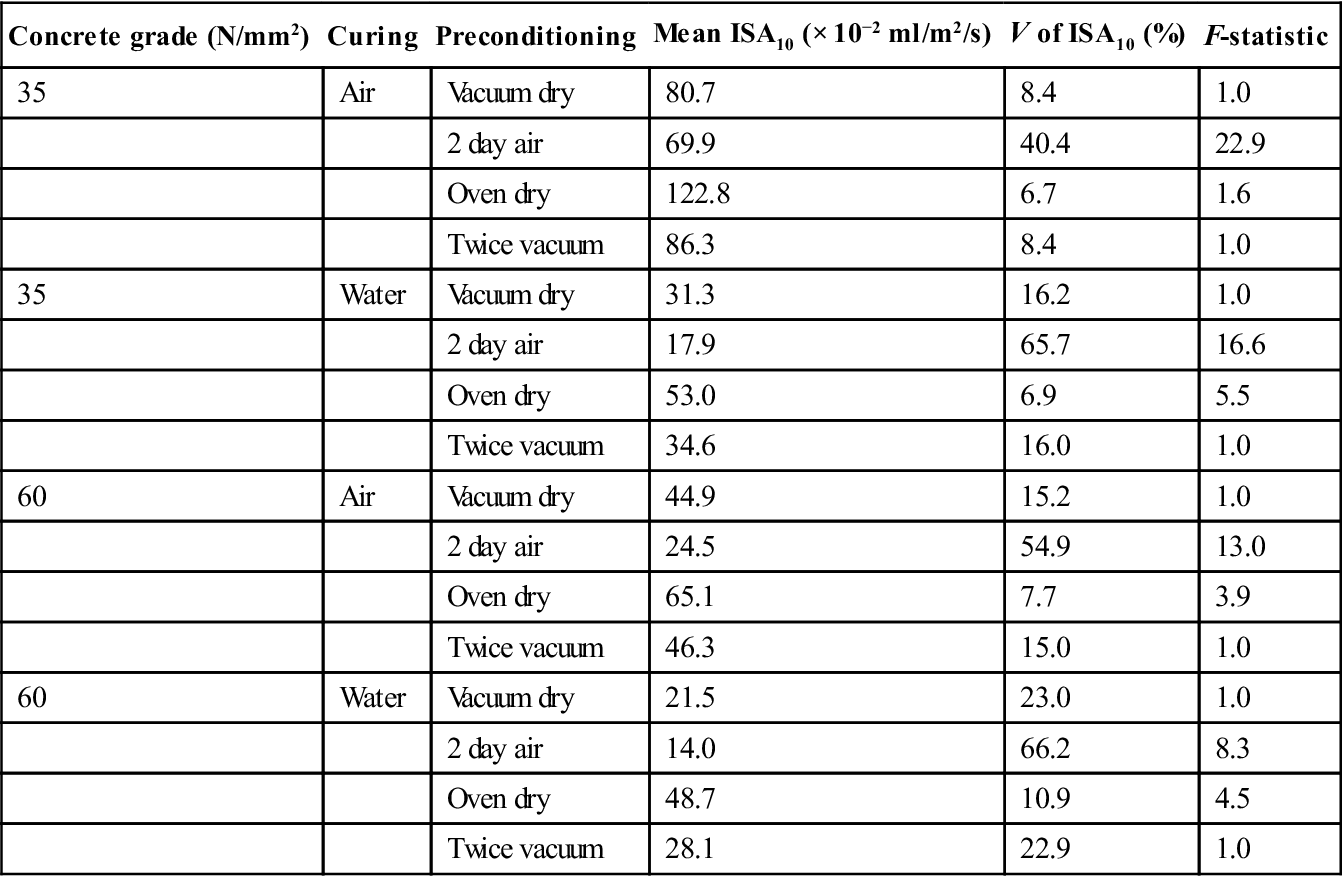
The coefficient of variation (V = the standard deviation divided by the mean) has been calculated from the ISA10 results from two samples from each moisture condition, i.e. a total of six samples in each case. For each of the four mix/curing combinations, it is therefore indicated that the coefficient of variation of the vacuum-dried samples is significantly less than for the 2-day room-dried samples, i.e. the null hypothesis that all the data is from the same population is rejected. For all other cases, the null hypothesis is accepted (i.e. there is no significant statistical difference), although it may be seen that the coefficient of variation is lowest for the oven-dried samples in each set, indicating that this is the best way of overcoming the effect of the three different moisture conditions.
In Fig. 3.6, the standard deviations are shown as error bars. It may be seen that the standard deviations of the oven-dried sets of samples are no larger than those for the vacuum-dried samples. This results in coefficients of variation being lower for oven drying because the means are higher, possibly due to micro-cracking caused by the heating.

3.5.7 Discussion
As expected, oven drying gives highest ISAT values and lowest coefficients of variation. It can be argued that oven drying is the most efficient method, since it gives consistent results regardless of the moisture history of concrete. Unfortunately, this method cannot be used in situ. It is interesting to note from Fig. 3.6, by comparing the bars for the same drying conditions from the different groups, that the vacuum drying results are the only ones in which the four different mix/curing combinations chosen for this study have been fully resolved, in that the error bars do not overlap. The graph indicates that the results from this preconditioning are better than the others at distinguishing between the different concrete ‘qualities’ and would thus be of greater practical use. Preconditioning by air drying is the only method currently used for in situ ISAT testing and the results show that changing to vacuum drying would give a significant improvement in the reproducibility of the results. The presence of moisture is normally beneficial to concrete, and absorption should therefore be measured in naturally occurring conditions. This would give lower values of absorption, indicating higher durability for structures in moist conditions. The author suggests that drying prior to absorption testing is essential, since porous or cracked concrete would have a high moisture content. This would yield low absorption values (indicating high durability) if the concrete had not been dried before testing.
The ‘twice vacuum’ samples which were subjected to the vacuum for twice the time taken for the gel to turn blue were not significantly different from the ‘vacuum dry’ samples which were tested when the colour change occurred. This result indicates that minor increases in vacuum time will not have a significant effect on the results. This is important because the colour change is a gradual process which takes place over about 10 or 20 min, and observing an exact time for it is not possible.
The mean ISAT values were higher for the lower grade of concrete and less efficient curing, i.e. decreasing quality, as expected. Although the coefficient of variation remained significantly lower for the vacuum-dried samples relative to the 2-day dried samples, the difference decreased with increasing concrete quality. The 60 N/mm2 water-cured samples, however, probably exceed the quality found on most existing structures. As the quality decreased towards more typical site concretes, the difference became more significant and the vacuum-dried results were comparable with the oven-dried ones.
3.5.8 Proposed test procedure
The testing procedure which was used in this project and is recommended for site is as follows:
1. modify the head of an ISAT apparatus by blocking one pipe connection and connecting the other to a vacuum pump (the ISAT head must be made from transparent material);
2. expose some silica gel to air until it turns pink;
3. place the ISAT head against the area of concrete to be tested with the silica gel inside it (note that clamping is not necessary);
4. start the pump and check that the pressure is 10 mbar or less;
5. run the vacuum pump until the majority of the gel turns blue;
6. carry out a normal ISAT test starting within 10 min of the release of the vacuum.
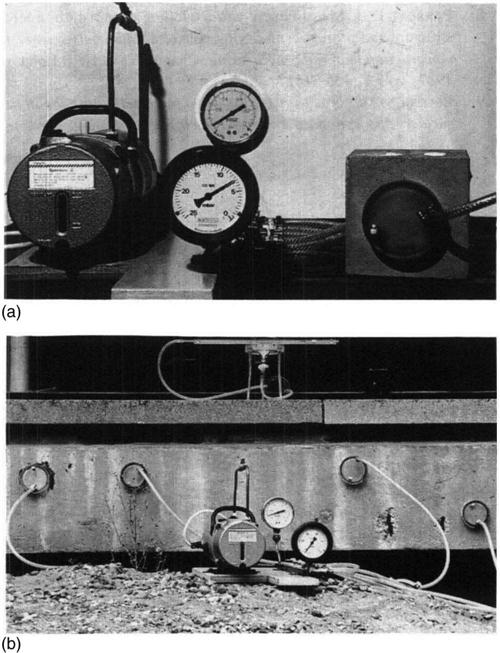
The components of the apparatus used for this work are shown in Fig. 3.7; they are very simple and robust and may readily be used on site. A single-stage mechanical vacuum pump (Edwards Speedivac) was connected to an ISAT cap with 12 mm PVC braided tube. A 0–25 mbar vacuum gauge was used (Capsule dial type, also supplied by Edwards).
3.6 Vacuum preconditioning for other tests
In Section 3.5 it was found that for the ISAT test a vacuum up to 10 mbar was suitable for drying in a reasonable time period, and 3 g of silica gel is sufficient as a drying indicator. Pilot trials were conducted in order to test the vacuum system prior to CAT and Figg. The vacuum technique was used for preconditioning test concrete (100 mm cubes) by drilling holes 13 mm diameter by 50 mm depth and subjecting the test specimens to different moisture conditions. The vacuum was applied as described in Section 3.5 and the preconditioned concrete specimens were tested using both CAT and Figg tests immediately after the silica gel colour turned blue. The results obtained from both CAT and Figg test were not reproducible (i.e. the vacuum preconditioning method failed to give similar results regardless of the moisture history of the test concrete).
Reproducibility was improved by applying the vacuum directly to the hypodermic needle prior to the Figg test (Fig. 3.8) and to the CAT cap prior to CAT. This is probably because of the concentration of vacuum on the immediate test area compared to the larger area under the ISAT cap and subsequent reduction of the leakage around the cap. Splitting cubes after preconditioning by vacuum showed that the drying front shape (see Fig. 3.8) is similar to the wetting front shape obtained by applying the absorption test (discussed in Section 4.4). Therefore, preconditioning the test area using CAT cap or the hypodermic needle of the Figg test leads to a drying of the concrete volume which will be tested by the specific permeation test.

3.6.1 Further development of the test apparatus
A separate perspex silica gel chamber was developed for placing in the vacuum line in order to monitor the progress of drying since it was not possible to use the same arrangement as in the larger ISAT cap.
3.6.2 Experimental procedure
The mixes, curing and experimental design were the same as those used for the ISAT test except that the ‘twice vacuum’ condition was not used. For each grade, curing condition, moisture content and drying method, two samples were tested giving a total of 72 samples for each test (CAT and Figg).
3.6.3 Results and discussion
The results for Figg and CAT test are shown in Tables 3.5 and 3.6 and Figs 3.9 and 3.10. The coefficient of variation V % has been calculated from the CAT10 and Figg permeation index results from each of the three moisture conditions, i.e. a total of six samples in each case.
Table 3.5
Figg test results for different preconditioning methods
| Concrete grade (N/mm2) | Curing | Preconditioning | Mean index (s) | V % of index | F-statistic |
| 35 | Air | Vacuum dry | 8 | 14.0 | 1.0 |
| 2 day air | 14 | 63.0 | 20.3 | ||
| Oven dry | 7 | 12.0 | 1.4 | ||
| 35 | Water | Vacuum dry | 61 | 20.5 | 1.0 |
| 2 day air | 121 | 60.0 | 7.2 | ||
| Oven dry | 38 | 8.0 | 6.6 | ||
| 60 | Air | Vacuum dry | 57 | 19.0 | 1.0 |
| 2 day air | 112 | 56.0 | 10.0 | ||
| Oven dry | 30 | 8.4 | 5.1 | ||
| 60 | Water | Vacuum dry | 227 | 23.0 | 1.0 |
| 2 day air | 400 | 43.0 | 3.5 | ||
| Oven dry | 150 | 9.5 | 5.9 |

Table 3.6
CAT results for different preconditioning methods
| Concrete grade (N/mm2) | Curing | Preconditioning | Mean CAT10 × 10−2 ml/m2/s | V % of index | F-statistic |
| 35 | Air | Vacuum dry | 121.4 | 19.5 | 1.0 |
| 2 day air | 106.5 | 59.5 | 9.3 | ||
| Oven dry | 185.0 | 12.5 | 2.4 | ||
| 35 | Water | Vacuum dry | 58.3 | 15.0 | 1.0 |
| 2 day air | 38.0 | 51.0 | 11.6 | ||
| Oven dry | 110.0 | 11.0 | 1.9 | ||
| 60 | Air | Vacuum dry | 63.5 | 12.0 | 1.0 |
| 2 day air | 41.5 | 39.0 | 10.6 | ||
| Oven dry | 115.0 | 8.0 | 2.3 | ||
| 60 | Water | Vacuum dry | 16.0 | 10.0 | 1.0 |
| 2 day air | 14.0 | 24.0 | 5.8 | ||
| Oven dry | 85.0 | 5.0 | 4.0 |

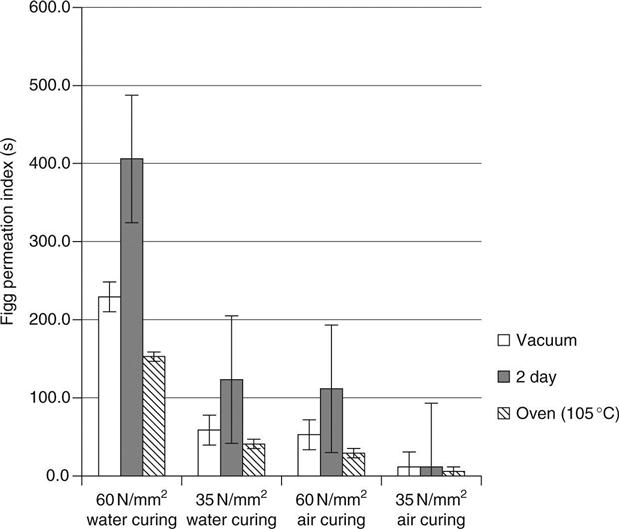

The F-ratios are shown in Tables 3.5 and 3.6 for each of the four mix/curing combinations. It can be seen that the coefficients of variation of the vacuum dried samples were significantly less than those for the 2 day room-dried samples except for water-cured concrete (60 N/mm2). Thus the null hypothesis that all the results are from the same population cannot be rejected for concrete of grade 60 (cured in water) but can for the other grades and curing conditions. The sensitivity of the tests to changes in concrete decreases with the increase of concrete grade.
Figures 3.9 and 3.10 show that the oven drying method produces highest CAT and lowest Figg values. The oven drying method gave lowest coefficients of variation for CAT. However, coefficients of variation for Figg values obtained after oven drying were comparable to those obtained after vacuum preconditioning. It is clear from Figs 3.9 and 3.10 that the error bars, representing the mean ± standard deviation, are overlapped for water-cured concrete (grade 35) and air-cured concrete (grade 60) regardless of the preconditioning method used, so they do not cast doubt on the new method. It is thus concluded that vacuum preconditioning should also be used with these tests.
3.7 Conclusions
• There are four generic types of surface permeability tests working with either water or vacuum either on the surface or drilled into it.
• All of these tests suffer from problems with application in environments where the concrete surface becomes damp. The vacuum drying system provides a good solution to these problems.