
Measurements of gas migration in concrete
Abstract:
This chapter describes a major programme to measure the gas permeability of concrete. The work was carried out by the author at the then Atomic Energy Research Establishment at Harwell for the application described in Chapter 14: to determine the effect of gas pressure on a nuclear waste repository. Because of the significant level of resources available in this programme, it was possible to determine the effect of different gases, moisture, reinforcement and construction joints to a significant level of accuracy.
Key words
gas permeability; moisture content; reinforcement; construction joints; Knudsen flow
6.1 Introduction
When gas is flowing through concrete, the flow rate may be significantly affected by moisture in the pores and by reinforcement and construction joints. These effects are difficult to measure. In particular, if the effect of moisture is to be measured, the gas which is used must be at the same humidity as the sample. The work described here was carried out by the author at the then Atomic Energy Research Establishment at Harwell for the application described in Chapter 14: to determine the effect of gas pressure on a nuclear waste repository. Because of the significant level of resources available in this programme, it was possible to determine the effect of different gases, moisture, reinforcement and construction joints to a significant level of accuracy.
6.2 Experimental method
6.2.1 Production of samples
The experimental materials used in this study were prepared at either Sir Robert McAlpine Ltd or by Taywood Engineering Ltd. The ratios of water to hydraulic binder (w/b) and aggregate to binder and the total binder contents for the concretes are given in Table 6.1. The ground granulated blast furnace slag (GGBS)/Portland cement (PC) grout had a GGBS:PC ratio of 9:1. Commercial considerations meant that the compositions of the backfill grouts could not be given. The materials were mixed in pan or shear mixers as appropriate and vibrated into moulds. The sulphate resisting cement (SRC) and pulverised fuel ash (PFA)/PC-concretes and the GGBS/ PC-grout were cured for 24 h at 20 °C prior to demoulding then cured underwater at ambient temperature for 28 days. All materials were subsequently stored underwater at ambient temperature until required for use. The resulting compressive strengths and densities of all the experimental materials are given in Table 6.2.
Table 6.1
Water–binder (w/b) and aggregate–binder ratios and total binder content used in the manufacture of the experimental materials. Data for backfill grouts are unavailable. All ratios are by weight
| Material | w/b | Aggregate/binder | Total binder (kg/m3) |
| SRC-concrete | 0.45 | 4 | 413 |
| PFA/PC-concrete | 0.475 | 4.55 | 400 |
| GGBS/PC-grout | 0.4 | 0 | 1350 |

Table 6.2
Physical properties of the experimental materials. Average pore radius values obtained using mercury intrusion porosimetry (MIP), but the measurements were not performed on the SRC-concrete
| Material | Strength (MPa) | Density (kg/m3) | Porosity (%) | Average pore radius (μm) | |
| Wt loss | MIP | ||||
| SRC-concrete | 64 | 2478 | 13 | – | – |
| PFA/PC-concrete | 61 | 2430 | 12 | 11 | 0.011 |
| GGBS/PC-grout | 32 | 1890 | 40 | 29 | 0.011 |
| Preliminary grout | 0.9 | 1460 | 66 | 56 | 0.7 |
| Reference grout | 6 | 1755 | 54 | 44 | 0.45 |

The pore structures of all materials except the SRC-concrete were investigated using mercury intrusion porosimetry (MIP) using a Carlo Erba Strumentazione Porosimeter 2000 with a maximum operating pressure of 200 MPa (this technique is described in more detail in Section 8.3.2). The PFA/PC-concrete sample was prepared by taking a number of 10 mm cores from a larger specimen and breaking these up and mixing to ensure a representative sample was achieved. Simple cores were used for the remaining materials. The porosity and the average pore radius were obtained from the MIP, and this data is given in Table 6.2. In addition, the porosity was calculated from the weight loss on drying, given in Table 6.3, using the measured density of water-saturated material from Table 6.2. The discrepancies between the two methods of obtaining the porosity may be due either to the MIP failing to intrude fine pores or the drying causing the loss of some water of hydration. It is likely that the MIP data is the more accurate.
Table 6.3
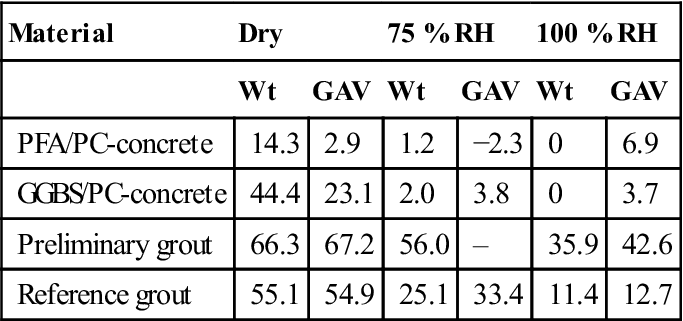
Fractional porosities obtained from the weight loss for each material during conditioning in the given relative humidity atmosphere (Wt) and from the measurement of gas accessible volumes (GAV). The negative value is due to inaccuracy in the measurement
| Material | Dry | 75 % RH | 100 % RH | |||
| Wt | GAV | Wt | GAV | Wt | GAV | |
| PFA/PC-concrete | 14.3 | 2.9 | 1.2 | −2.3 | 0 | 6.9 |
| GGBS/PC-concrete | 44.4 | 23.1 | 2.0 | 3.8 | 0 | 3.7 |
| Preliminary grout | 66.3 | 67.2 | 56.0 | – | 35.9 | 42.6 |
| Reference grout | 55.1 | 54.9 | 25.1 | 33.4 | 11.4 | 12.7 |
The MIP results revealed that the PFA/PC-concrete and the GGBS/PC-grout have relatively narrow and symmetrical pore size distributions in the range 5–50 nm. In contrast, the preliminary and reference backfill grouts have broad pore size distributions ranging from 5 nm to greater than 1 μm. These distributions are quite strongly biased towards the larger pore sizes as shown by the average radii given in Table 6.2.
6.2.2 Specimen preparation
Specimen conditioning
The specimens were conditioned prior to use in a controlled humidity atmosphere to establish a known water content. Three different humidities were selected: zero, 75 % and 100 % relative humidity (RH). The SRC-concrete was used in the dry condition only. The zero RH, dry specimens were dried for 24 h at 100 °C then stored in a sealed container containing silica gel desiccant. The remaining specimens were placed directly into sealed containers. The 75 % and 100 % RH were achieved by placing a quantity of saturated sodium chloride solution or demineralised water, respectively, into the containers.
Measurement of water saturation
The degree of water saturation was determined by monitoring weight loss during conditioning. The fractional weight losses incurred by conditioning, compared to the initial weight in a surface dry condition, are given in Table 6.3. The data in Table 6.3 confirms that that the grouts have substantial porosity and shows that both the preliminary and reference grouts lost water even during conditioning at 100 % RH.
Measurement of gas accessible volume (GAV)
Analysis of the experimental data from the gas transport experiments was carried out using a numerical model of the gas migration process, as described below, and required the measurement of the ‘gas accessible’ volume (GAV) for each type of material and condition. This was measured by placing appropriate specimens into a sealed chamber at a known pressure and subsequently venting the gas into an additional, known volume. The resulting pressure drop, combined with the volumes of the system and the specimen, can be used to calculate the volume of porosity accessible by gas. This method has the advantage that the specimens are used in an intact, conditioned state and the measured porosity is directly associated with gas migration. The measured porosities obtained using this technique are given in Table 6.3.
The gas accessible porosity values for the backfill grouts are not significantly different from those obtained from weight loss measurements, as given in Table 6.3. The gas accessible porosity values were subject to some inaccuracy due to limitations in the measurements of the volumes. However, it appears from the comparison of the data in Table 6.3 that the PFA/PC-concrete and GGBS/PC-grout have significantly lower gas accessible porosities than is indicated by other measurement techniques.
6.2.3 Specimens containing interfaces
The influence of artefacts introduced by the construction process was assessed using specimens containing reinforcement bars and construction joints. The effect of interfaces on gas migration was investigated using specimens conditioned at both zero and 100 % RH.
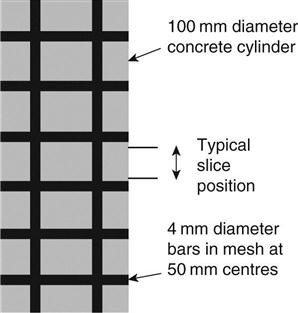
Specimens of the PFA/PC-concrete were cast into moulds containing a section of reinforcing mesh oriented vertically in a cylindrical mould. The mix design and curing conditions utilised were identical to those discussed above. The mesh consisted of 4 mm diameter bars spaced at 50 mm centres. The cylinders were sectioned between the horizontal members of the mesh to produce specimens containing two bars perpendicular to the flat faces of the slices. The arrangement of the reinforcement bars in the cylinder is illustrated in Fig. 6.1. The interface between the reinforcement and the concrete was thus parallel to the direction of gas migration.
Construction joints were produced in specimens of the preliminary backfill grout. Previously cast cylinders, cured identically to those described previously, were split approximately in half in the direction perpendicular to the flat faces and replaced in moulds prior to casting additional material of the same mix design as the original specimens. A further monolithic specimen was prepared from the additional material to act as a control. The specimens were subsequently cured at ambient temperature for at least 28 days. Sectioning produced specimens with the construction joint oriented parallel to the direction of gas migration.
6.2.4 Experimental apparatus
The flow of gas under an imposed pressure gradient was measured by monitoring the decay of a pressure difference across a membrane of the material with elapsed time. Experimental measurements were carried out using a variety of gases. The permeability of the dry SRC-concrete was measured using hydrogen and argon whilst that of the GGBS/PC and backfilling grouts and the flawed specimens was measured using helium and argon. The influence of gas type on gas migration was more fully investigated for the PFA/PC-concrete using five different gases: hydrogen, helium, methane, argon and carbon dioxide.
Measurement cells were constructed for operation at both low (0–200 kPa) and high (0–10 MPa) applied pressures.
Low pressure measurements
The general form of the low pressure apparatus is illustrated schematically in Fig. 6.2. The apparatus allowed the sampling of a fixed volume of the gas from one side of the cell. Specimens were in the form of 100 mm discs approximately 20 mm in thickness mounted into a perspex holder using a cold-setting urethane compound.

The apparatus was designed to allow the maintenance of a constant humidity atmosphere adjacent to the specimen during an experiment. This was achieved by placing either desiccant, salt solution or pure water into the cell along with the specimen.
The construction of the cells gave a reduction in the area of specimen exposed in the lower pressure reservoir compared to that exposed in the high pressure reservoir. Where necessary, a correction by a factor of 1.13 has been applied to the data to allow for this effect.
High pressure apparatus
The higher pressure experiments were performed either with or without triaxial confinement of the specimens using a cell similar to that described in Section 4.2. (However, this cell had a thinner and thus more readily punctured sleeve around the sample; the cell described in Section 4.2 was developed from it and is recommended for all work.) In particular, it was found that triaxial stressing of the high porosity preliminary backfill grout caused a substantial permanent reduction in the volume of the specimens and some experimental error may have occurred.
It is of note that the high pressure apparatus was far more difficult and time-consuming to use than the low pressure.
Specimen thickness
The specimen thickness was dependent on the measurement cell used. In the case of the triaxial cell, specimens approximately 100 mm thick were used whilst in the low pressure cells the specimen thickness was approximately 20 mm.
Types of experiment
Two variations on the basic experiment were performed. In the first, both reservoirs shown in Fig. 6.2 were isolated and the pressures allowed to relax to an equilibrium level. Such experiments allowed measurements to be made at an approximately constant average pressure. In contrast, measurements were also performed with a continuously varying average pressure by holding one reservoir at a constant applied pressure. In both cases, the range of average pressure values was determined by the initial conditions and the volumes of the two reservoirs.
Pressures used
The permeability measurements were made at a range of different average pressures. Constant average pressures of 100 kPa and 1.5, 7, 15, 22 and 72 MPa were used in the measurements on the PFA/PC-concrete whilst experiments on the grouts were constrained to a maximum average pressure of about 2 MPa to avoid specimen damage. The varying average pressure experiments were performed in two pressure ranges; 0–200 kPa and 0–3 MPa, denoted low and high pressure ranges, respectively.
Replicate samples
Between one and ten measurements were carried out for each set of conditions. The data generally exhibited very little variability between different runs on an individual specimen. It was considered that a measured intrinsic permeability represented the sum of the intrinsic permeability of the material and any additional contribution from short-circuit pathways such as cracks or incomplete sealing between specimen and container. Hence, it was not possible to obtain a measured intrinsic permeability below the true intrinsic permeability for the material. The best value of the intrinsic permeability for a material was taken to be the lowest value obtained.
Duration of experiments
The elapsed times required for the completion of a particular experiment were determined by the material being studied. These varied from about 10 s, in the case of dry preliminary backfill grout, to greater than a month for some of the materials in the 100 % relative humidity condition. The limit of accuracy of the experiments was ultimately controlled by the quality of the seals achieved in the measurement cells, both between the two reservoirs and to atmosphere. The effective lower and upper limits of resolution of the experimental apparatus were estimated as 10−21 and 10−14 m2, respectively. Since the intrinsic permeability values are based on calculations of the rate of change of pressure, any experimental errors, such leaks between reservoirs or to atmosphere, will result in an over-estimate of the intrinsic permeability. The presence of leaks to atmosphere could be detected in the closed system mode by checking for conservation of the total mass of gas as it flowed from one reservoir to the other. Achieving an adequate seal to contain helium for more than a month required a considerable amount of work over a period of many months to select and assemble appropriate materials and fittings. In particular, several types of pipe and fittings such as PTFE were found to be permeable to this gas.
6.3 Analysis of experimental data
6.3.1 Analytical solution
The flow of a single gas between the two reservoirs in the apparatus will be such that the pressure difference is reduced and eventually eliminated. The flow of a fluid in a homogeneous porous medium under a pressure gradient is governed by the Darcy equation (1.6). The volumetric flow rate can be related to the molecular flow rate using the ideal gas approximation and the resulting version of the equation integrated across the whole specimen to give an expression for the molecular flow rate in terms of the applied pressures on either side of the membrane. The variation in pressure in one reservoir, in this instance that at the lower pressure, can be determined from this expression by the further application of the ideal gas approximation by integrating equation (1.9) as in equation (4.25):
[6.1]
where:
dP1/dt is the rate of pressure change in the low pressure reservoir
V1 is the volume of that reservoir and
P1 and P2 are the pressures in the low and high pressure reservoirs, respectively.
In a closed experiment, the change in pressure in the high pressure reservoir can be calculated from that measured in the lower pressure reservoir and hence P2 obtained from P1. Substituting for P2 and integrating with respect to pressure and time gives an expression for the variation of pressure in the low pressure reservoir with time:
[6.2]
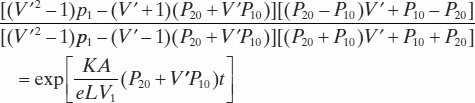 [6.2]
[6.2]
where:
V′ is the ratio of the reservoir volumes (V1/V2) and
P10 and P20 are the initial low and high pressures, respectively.
Equation (6.2) may be compared with equation (4.26) which was obtained from it and is a special case of it.
If the higher pressure is held constant, the effective value of V2 is infinite and the ratio V′ is zero. Applying this constraint to the equation above allows the determination of intrinsic permeability from the experiments with variable average pressure. The variation in the pressure in the higher pressure reservoir can be obtained using an analogous method. This derivation predicts the exponential relaxation of an applied pressure difference with time.
6.3.2 Numerical solution
The analytical solution for gas pressure variation given above assumes that steady state flow has been established, i.e. that the quantity of gas exiting the specimen into the lower pressure reservoir is equal to that entering the specimen from the higher pressure reservoir. For a compressible fluid in a medium with finite porosity, this is not strictly true. Hence, the analytical solution is only applicable to materials where the error caused by the assumption of zero porosity is not significant. The errors become large in specimens of high porosity subject to a large pressure difference. In order that the all the experimental data could be analysed, a numerical model of the variation in pressure with time was developed using a finite difference method similar to the model described in Chapter 2. The intrinsic permeability value obtained from the analytical solution was input as a starting value for the numerical calculation. Subsequently, the numerical model was run to produce a simulated data set of pressure versus time from which a new intrinsic permeability value was calculated using the analytical solution. This process was repeated until the simulated data set achieved a satisfactory match to the experimental data. In Chapter 11, the use of artificial neural networks is discussed for the solution of a similar problem.
The intrinsic permeability values were obtained using this numerical method to extract them from both constant and varying average pressure experiments. The analytical solution alone was used to calculate the infinite pressure intrinsic permeability values and Klinkenberg constants from the varying average pressure experiments. This data will not be as accurate as that derived from the numerical solution.
6.3.3 Pressure at the completion of a test
The completion of an experiment was indicated by the achievement of a uniform pressure throughout the experimental apparatus. For materials with a low porosity, this pressure is equal to a volume-weighted average of the initial pressures in the two reservoirs. However, if the porosity is high, there is significant gas volume contained in the specimen and the final average pressure must include a contribution from the gas in the pore volume. If the flow is in steady state, the mean pressure Pm in the pore volume is not the linear average of the two initial pressures, due to the compressibility of the gas, but may be found from equation (6.2) as:
[6.3]
The overall average pressure can then be calculated using this value for the pressure in the pore structure and weighting according to the volume of the porosity. In some experiments, the volume of the porosity can be as much as half of the total volume. The assumption that the average pressure in the porosity is a linear average can lead in such circumstances to under-estimation of the expected final pressure by over 10 %.
6.4 Results for gas permeability of concrete
6.4.1 Gas migration at constant average pressure
A typical pressure difference relaxation curve for a specimen of the PFA/PC-concrete is shown in Fig. 6.3. The final average pressure was as predicted by equation (6.3). Figure 6.4 shows a comparison of the gas intrinsic permeability values for the PFA/PC-concrete obtained using hydrogen, helium, methane, argon and carbon dioxide as the migrating gases. Measurements were made on material conditioned at 0, 75 % and 100 % RH. All experiments were performed at an average pressure of 100 kPa. Data for the 100 % RH conditioned specimen are only available for helium and argon.


At low pressures, Knudsen flow will be significant as discussed in Section 1.2.1. If the Klinkenberg relationship is applicable to this data, the measured permeabilities at constant pressure will depend on the mean free path for each gas. The mean free path of a gas molecule λ can be calculated in a number of ways. The equation used here is:
[6.4]
where:
e is the viscosity,
P is the pressure and
ρ is the density.
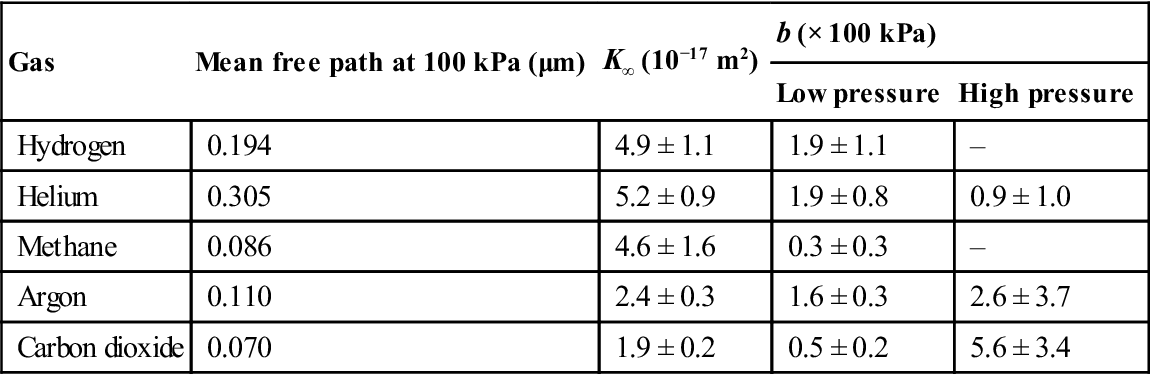
The mean free paths for the gases used at a pressure of 100 kPa and a temperature of 25 °C are given in Table 6.4. The variation in the intrinsic permeability with the type of gas for both the dry and the 75 % RH conditioned specimens at 100 kPa, given in Fig. 6.4, was correlated with the mean free path of the gas given in Table 6.4. Linear regression on the two data sets gave correlations of r2 = 0.92 and 0.75 for the dry and 75 % RH conditioned specimens, respectively. The intercept as the mean free path tends to zero determined by linear regression gives the value of the infinite pressure permeability which equates with that in the Klinkenberg equation, since a mean free path of zero corresponds to a value of the Klinkenberg constant of zero. The infinite pressure intrinsic permeability values K∞ derived in this way are 1.3 × 10⁻¹⁷m2 for dry material and 2 × 10⁻²⁰m2 for that conditioned at 75 % RH.
Table 6.4
Results of the measurements of gas flow in dry PFA/PC-concrete using varying average pressures. Data given are the means of best-fit values for the Klinkenberg equation. Low pressure data obtained for average pressures in the range 0–200 kPa. High pressure data obtained for average pressures in the range 0–7.5 MPa. Quoted errors are standard errors
| Gas | Mean free path at 100 kPa (μm) | K∞ (10−17 m2) | b (× 100 kPa) | |
| Low pressure | High pressure | |||
| Hydrogen | 0.194 | 4.9 ± 1.1 | 1.9 ± 1.1 | – |
| Helium | 0.305 | 5.2 ± 0.9 | 1.9 ± 0.8 | 0.9 ± 1.0 |
| Methane | 0.086 | 4.6 ± 1.6 | 0.3 ± 0.3 | – |
| Argon | 0.110 | 2.4 ± 0.3 | 1.6 ± 0.3 | 2.6 ± 3.7 |
| Carbon dioxide | 0.070 | 1.9 ± 0.2 | 0.5 ± 0.2 | 5.6 ± 3.4 |
6.4.2 Variation in gas permeability with pressure
The values of the intrinsic permeability of the SRC-concrete in the dry condition for hydrogen and argon migration at a range of approximately constant average pressures between 0 and 150 kPa are shown in Fig. 6.5. The data has been corrected by a factor of 1.13 to allow for the differing areas of the specimen exposed in the high and low pressure reservoirs as a result of the seal geometry. It is clear that the intrinsic permeability is inversely dependent on average pressure. The intrinsic permeability for hydrogen exceeds that for argon in the pressure range investigated. This is consistent with the observations made above and can be attributed to the increasing effect of Knudsen flow at lower pressures and the longer mean free path of hydrogen for a given pressure.
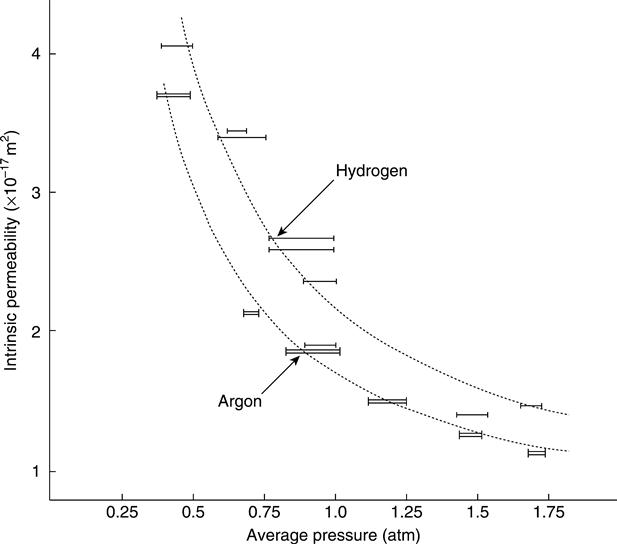
The Klinkenberg equation can be fitted to the data, as illustrated in Fig. 6.5. The infinite pressure intrinsic permeability values thus determined are 3.6 × 10⁻¹⁸ and 4.0 × 10⁻¹⁸ m2 from the hydrogen and argon data, respectively. These values are close enough to be considered equal, within experimental error. The calculated values of the Klinkenberg constant are 6.6 × 10⁵ Pa for hydrogen and 4.2 × 10⁵ Pa for argon.
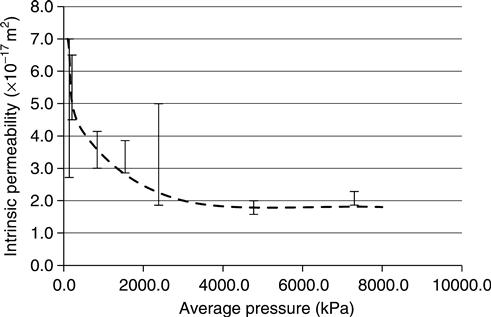
The dependence of the gas permeability for argon migration in the PFA/PC-concrete (conditioned at zero RH) on the average pressure is shown in Fig. 6.6. Data is included for experiments performed at both constant and varying average pressures. The range of data obtained at each pressure is illustrated. It is apparent that the intrinsic permeability decreases as the average pressure is increased. Plotting the best estimate intrinsic permeability for the set of experiments performed at, approximately, a particular value of the average pressure against the reciprocal of average pressure indicated that the Klinkenberg relationship is probably applicable, although the correlation obtained was not strong (r2 = 0.78). Linear regression gave the infinite pressure permeability as 2.0 × 10⁻¹⁷ m2 and the Klinkenberg constant as 190 kPa.
The change in permeability with average pressure shown in Fig. 6.6 is most significant at low average pressures. The results of a series of measurements performed with the average pressure varying between 0 and 200 kPa in PFA/PC-concrete conditioned at zero RH, using each of the five different gases, are given in Table 6.4. There is a possible correlation between the Klinkenberg constant and the mean free path for each gas, calculated using equation (6.4), at a pressure of 100 kPa and a temperature of 25 °C (r2 = 0.60).
The infinite pressure intrinsic permeability should be a constant value, independent of the type of gas. The variation in the infinite pressure intrinsic permeability with gas type is not strongly correlated with the mean free path (r2 = 0.50) and it is assumed that the differences between the values shown in Table 6.4 are due to experimental error. The mean value of the infinite pressure intrinsic permeability is (3.7 ± 0.6) × 10−17 m2. This value is reasonably consistent with the values of 1.3 × 10⁻¹⁷ and 2.0 × 10⁻¹⁷ m2 determined above.
The results of the measurements carried out with a varying average pressure of argon on the PFA/PC-concrete conditioned at 100 % RH implied an infinite pressure permeability of (7.6 ± 2.3) × 10−17 m2. Comparison of this value with those given in Fig. 6.4 indicates that the former must be subject to error as the permeability is apparently three orders of magnitude greater when measured in the varying average pressure experiment. The varying average pressure experiments were performed using higher pressure differences, up to 3 MPa. It is postulated that the high applied pressures gave rise to mechanical failure in the specimens when used in the non-triaxial high pressure cell. Consequently, the data for PFA/PC-concrete in the 100 % RH condition has been omitted from Table 6.6 where they are quoted for comparison.
6.5 Comparison with gas permeability of grouts
6.5.1 Gas migration at constant average pressure
Table 6.5 details the measured intrinsic permeability values for the migration of helium and argon at an average pressure of 100 kPa in all of the experimental materials in both the dry and 100 % RH conditioned states. The data for the PFA/PC-concrete is included for comparison. In some of the materials in the dry state, in particular the two types of backfill grout, the gas migration was so rapid that only variable average pressure experiments could be performed. In these cases, the intrinsic permeability values for a constant average pressure of 100 kPa were calculated from the available data for varying average pressure, discussed below, using the Klinkenberg equation.
Table 6.5
Measured intrinsic permeability values for a constant average pressure of 100 kPa in the experimental materials. All data are expressed as K (m2)
| Material | Dry | 100 % RH | ||
| Helium | Argon | Helium | Argon | |
| SRC-concrete | – | 2 × 10⁻¹⁷ | – | – |
| PFA-concrete | 6 × 10⁻¹⁷ | 3 × 10⁻¹⁷ | 7 × 10⁻²⁰ | 10−21 |
| GGBS-grout | 5 × 10⁻¹⁶ | 4 × 10⁻¹⁶ | 4 × 10⁻¹⁹ | 10−21 |
| Preliminary grout | 2 × 10⁻¹⁴ | 10−14 | 2 × 10⁻¹⁶ | 4 × 10⁻¹⁷ |
| Reference grout | 3 × 10⁻¹⁵ | 2 × 10⁻¹⁵ | 7 × 10⁻¹⁷ | 4 × 10⁻¹⁷ |

6.5.2 Variation in gas permeability with average pressure
The infinite pressure permeabilities for all of the experimental materials are shown in Table 6.6 for migration at low pressure in materials conditioned at 0 and 100 % RH, with the exception of the value for the PFA/PC-concrete in the 100 % RH condition. It has been assumed that the infinite pressure permeability is a constant for all gases and hence the infinite pressure intrinsic permeability values given are the average of the data for all gases studied in each material. Figure 6.7 illustrates the fit of the Klinkenberg equation to the variation in the measured intrinsic permeability for the GGBS/PC-grout for average pressures in the range 0–100 kPa.
Table 6.6
Measured values of the infinite pressure intrinsic permeability. Data for the dry conditioned specimens obtained for pressures in the range 0–200 kPa only. Quoted errors are standard errors. All data are expressed as K (m2)
| Material | Dry | 100 % RH |
| SRC-concrete | (3.8 ± 0.1) × 10−18 | – |
| PFA/PC-concrete | (3.7 ± 0.6) × 10−17 | – |
| GGBS/PC-concrete | (5.3 ± 1.0) × 10−16 | (5.9 ± 0.4) × 10−18 |
| Preliminary grout | (4.4 ± 1.1) × 10−14 | (4.4 ± 0.8) × 10−16 |
| Reference grout | (4.4 ± 1.1) × 10−16 | (4.6 ± 5.0) × 10−16 |

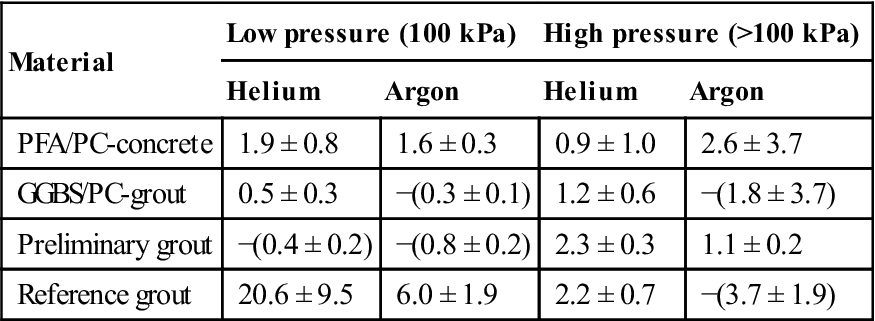
Table 6.7 gives the measured values of the Klinkenberg constant for all the experimental materials in the dry condition for both low and high average pressures. Where the table shows that the Klinkenberg constant is within experimental error of zero or negative, the change in permeability with pressure over the pressure range investigated was very small. A negative value may be the result of a systematic error in the data analysis when the change in intrinsic permeability is small. In such circumstances, it must be assumed that the intrinsic permeability is constant with average pressure and equal to the infinite pressure intrinsic permeability.
Table 6.7
Measured values of the Klinkenberg constant b (from equation 1.12) for materials in the dry condition obtained using varying average pressure experiments. Where quoted, errors are standard errors. All data are expressed as b × 105 Pa
| Material | Low pressure (100 kPa) | High pressure (>100 kPa) | ||
| Helium | Argon | Helium | Argon | |
| PFA/PC-concrete | 1.9 ± 0.8 | 1.6 ± 0.3 | 0.9 ± 1.0 | 2.6 ± 3.7 |
| GGBS/PC-grout | 0.5 ± 0.3 | −(0.3 ± 0.1) | 1.2 ± 0.6 | −(1.8 ± 3.7) |
| Preliminary grout | −(0.4 ± 0.2) | −(0.8 ± 0.2) | 2.3 ± 0.3 | 1.1 ± 0.2 |
| Reference grout | 20.6 ± 9.5 | 6.0 ± 1.9 | 2.2 ± 0.7 | −(3.7 ± 1.9) |
The Klinkenberg constants for the materials in the 100 % RH conditioned state were not measured for all materials and pressure ranges. When the values were measured, using high average pressures, in the range 0–3 MPa, the Klinkenberg constants were found to be negative or not significantly different from zero for all materials. The data are considered to indicate that there was little or no change in the infinite permeability for average pressures in the high pressure range.
6.6 The effect of interfaces on gas permeability
6.6.1 Influence of reinforcement on gas migration
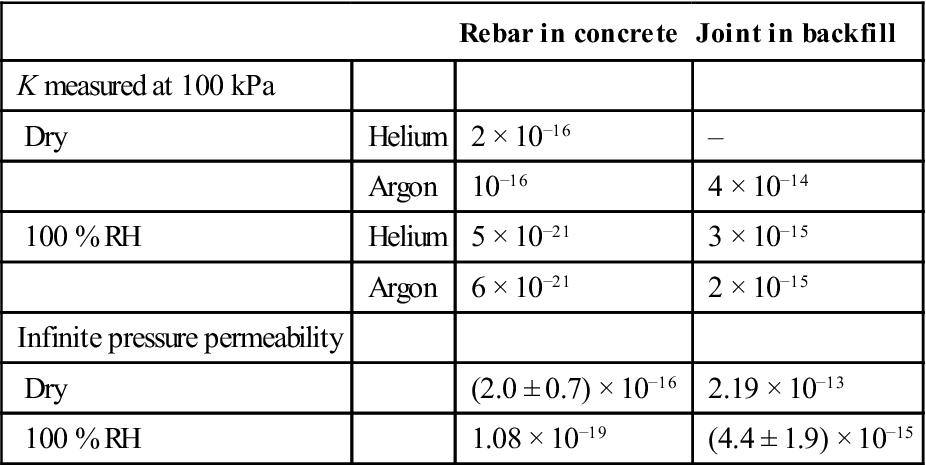
The intrinsic permeability values for a constant average pressure of 100 kPa and the infinite pressure intrinsic permeability values for both the dry and 100 % RH conditioned specimens are given in Table 6.8. This data can be directly compared with the data for unreinforced, PFA/PC-concrete given in Tables 6.5 and 6.6.
Table 6.8
Measured values of intrinsic permeability for the flawed specimens. The constant average pressure data were obtained from experiments at an average pressure of 100 kPa. Where quoted, errors are standard errors. All data are expressed as K (m2)
| Rebar in concrete | Joint in backfill | ||
| K measured at 100 kPa | |||
| Dry | Helium | 2 × 10⁻¹⁶ | – |
| Argon | 10−16 | 4 × 10⁻¹⁴ | |
| 100 % RH | Helium | 5 × 10⁻²¹ | 3 × 10⁻¹⁵ |
| Argon | 6 × 10⁻²¹ | 2 × 10⁻¹⁵ | |
| Infinite pressure permeability | |||
| Dry | (2.0 ± 0.7) × 10−16 | 2.19 × 10⁻¹³ | |
| 100 % RH | 1.08 × 10⁻¹⁹ | (4.4 ± 1.9) × 10−15 |
The presence of the reinforcing bars appeared to increase the intrinsic permeability of dry material (measured at a constant average pressure of 100 kPa) by a factor of between three and four. There was no significant difference between unreinforced and reinforced material for the 100 % RH condition at a constant average pressure of 100 kPa. However, at a constant average pressure of about 1.6 MPa, the intrinsic permeability values for helium and argon were increased to 2 × 10⁻¹⁹ and 1 × 10⁻¹⁹ m2, respectively. This represents an increase by about an order of magnitude compared to the data obtained at 100 kPa. This increase in permeability with average pressure is not observed for the unreinforced material and must be attributed to the influence of the reinforcement.
6.6.2 Influence of construction joints on gas migration
The experimental results obtained for the preliminary backfill grout containing a construction joint are given in Table 6.8. No data was obtained at constant average pressure in dry material as the extremely high permeability made experiments too rapid. The control specimen gave a 100 kPa argon intrinsic permeability of 6.3 × 10⁻¹⁶ m2 for material in the 100 % RH condition. The infinite pressure intrinsic permeability values for the control specimen were 2.3 × 10⁻¹³ and 4.6 × 10⁻¹⁶ m2 for the dry and 100 % RH conditions, respectively. This data is significantly greater than that obtained for the normal specimens of the grout, given in Tables 6.5 and 6.6. It is apparent that the batch of grout used in the preparation of the construction joints is not consistent with the other specimens of this material.
The construction joint increased the 100 kPa permeability of 100 % RH conditioned material by a factor of three compared to the control specimen and a factor of 70 compared to the pristine material. The infinite pressure permeability was equal to that of the control specimen for the dry condition and was approximately an order of magnitude greater for the 100 % RH condition.
6.6.3 Variability in the measurements
The contribution to experimental error arising from inter-specimen variability is mainly due to the variation in the number of short-circuit pathways in different specimens of the same material. In addition, some irreproducibility may occur between individual experimental runs on the same specimen and from differences in the intrinsic permeability values of individual specimens of the same material. The total variability in the measurements of the intrinsic permeability for a particular material under a fixed set of conditions can be quantified by the coefficient of variability of the data. This is equal to the ratio of the standard deviation to the mean for the data, usually expressed as a percentage.
The intrinsic permeability measurements made at a constant average pressure of 100 kPa, summarised in Fig. 6.4 and Table 6.5, generally exhibited overall coefficients of variability of between 10 and 40 %. The reproducibility of repeated measurements on an individual specimen was generally of the order of a few per cent. Hence, the measurement of gas permeability using this experimental technique seems to be inherently reproducible.
In contrast, the measured infinite pressure intrinsic permeability values, given in Table 6.6, had coefficients of variability of between about 30 and 200 %. The large variability in the infinite pressure intrinsic permeability is due to the error produced when the Klinkenberg equation is fitted to data which exhibit a very small change in permeability over the pressure range investigated. This is particularly true of the backfill grouts.
6.7 Discussion
6.7.1 Bulk gas flow in dry material
The experimental data shown in Fig. 6.4 demonstrates that the intrinsic permeability for the PFA/PC-concrete measured at a constant average pressure of 100 kPa is dependent on the mean free path of the gas. Experiments conducted with a varying average pressure show that the intrinsic permeability for a particular gas in both the SRC and PFA/PC-concretes decreases with increasing average pressure, as shown by the data in Table 6.4 and Fig. 6.5. This variation is also demonstrated by the compilation of the data for argon migration in dry PFA/PC-concrete shown in Fig. 6.7.
The data for the SRC-concrete, shown in Fig. 6.5, demonstrates that this material exhibits a significantly lower permeability than the PFA/PC-concrete. This is at variance with the general expectation that the mass transport characteristics of a PFA-modified material will be lower than those of an unmodified cement due to hydration products from the pozzolanic reaction filling the pores. The infinite pressure intrinsic permeability given in Table 6.6 for the SRC-concrete is an order of magnitude lower than that given for the PFA/PC-concrete. The measured fractional porosities of the two materials, given in Table 6.2, are similar. The observed difference in performance may be the result of differing degrees of damage to the pore structures of the two materials during drying.
A Knudsen number (see Section 1.2.1) significantly greater than unity indicates that Knudsen flow will be important. The mean free path is dependent on the nature of migrating gas, as shown above. Consequently, the contribution from Knudsen flow at a given pressure will depend on the gas flowing, as shown by the data in Fig. 6.4. The average pore radius for the PFA/PC-concrete, given in Table 6.2, is 0.011 μm whilst the mean free path at 100 kPa and 25 °C varies between 0.070 and 0.305 μm for the gases used in these experiments. Hence, the Knudsen numbers are in the range 6–28 and a significant contribution from Knudsen flow at 100 kPa would be expected.
The data shown in Fig. 6.7 demonstrates that the change in the argon intrinsic permeability of the PFA/PC-concrete for an increase in the average pressure from 100 kPa to 7.5 MPa is a decrease by about a factor of 2.5. Comparison of the infinite pressure intrinsic permeability values for dry material given in Table 6.4 for the different gases with the intrinsic permeability values obtained at a constant average pressure of 100 kPa given in Fig. 6.4 also indicates that the permeability decreases by at most a factor of two as the pressure is increased over this range. The majority of this decrease occurs in the 0–1 MPa pressure range, as shown in Fig. 6.6.
6.7.2 Bulk gas flow in water-saturated material
The behaviour of the PFA/PC-concrete in the partially or fully water saturated condition is qualitatively similar to that in a dry condition. Figures 6.3 and 6.4 demonstrate that the intrinsic permeability is dependent on the type of gas for concrete conditioned at 75 % RH, although the measured intrinsic permeability values are significantly lower than those of dry material.
The reduction in the measured intrinsic permeability for material conditioned at high relative humidities must be due to the effective blocking of pores which remained filled with water after conditioning. The relationship between the radius of the largest filled pore and relative humidity RH is given by the Kelvin equation (3.1).
RH of 75 % gives a maximum filled pore radius of about 4 nm whilst at a RH of 100 % all pores should be filled with water. Hence, at 75 % relative humidity the majority of the porosity should be available for gas migration. The reduction in the intrinsic permeability for 75 % RH conditioned materials apparent in the experimental results hence indicates that gas migration is significantly influenced by the finer porosity and that much of the pore volume may not form interconnected networks with constrictions larger than 4 nm.
The material conditioned at 100 % RH demonstrated a further decrease in the intrinsic permeability. The Kelvin equation predicts that all porosity is water-filled for this condition and hence a reduction is expected. However, the only mechanism available for gas migration in material that is fully water saturated will be solution-diffusion, where dissolved gas molecules diffuse in the pore solution. Using a solubility of 9 × 10⁻⁴ M and a diffusion coefficient of 2 × 10⁻¹² m2 s−1 (Harris and Nickerson, 1989), an equivalent intrinsic permeability of about 10−23 m2 is obtained. This value is significantly less than that obtained for helium migration in the PFA/PC-concrete, 7 × 10⁻²⁰ m2, and it must be concluded that either there was leak across the specimen or that some interconnected porosity remains open in the specimens conditioned at 100 % RH, or water was expelled from the pores as discussed in Section 6.7.5 below.
6.7.3 Gas migration in grouts
Table 6.5 shows that the intrinsic permeability values at 100 kPa for the three different grouts in the dry condition are of similar magnitude and are an order of magnitude or more greater than those measured for the PFA/PC-concrete. The intrinsic permeability values for the grouts are decreased by two or three orders of magnitude for the 100 % RH conditioned specimens compared to the dry materials. The intrinsic permeability values for the GGBS/PC-grout in the 100 % RH conditioned state is substantially lower than those of the other grouts and is comparable in magnitude to that of the structural concrete.
Comparison of the data obtained using helium and argon as the migrating gases in dry materials shows that there is no significant dependence on gas type for the preliminary backfill grout. Hence, there is apparently little or no Knudsen flow occurring at 100 kPa. Some dependence on gas type is exhibited by the GGBS/PC and reference backfill grouts. The observed variation in behaviour must be due to the differences in pore sizes between the grouts.
Comparison of the intrinsic permeability values extrapolated to infinite pressure, given in Table 6.6, with those obtained at 100 kPa average pressure (Table 6.5) indicates that there is no consistent relationship between the two. This demonstrates that the intrinsic permeability values of these materials are not strongly dependent on average pressure at pressures of 100 kPa and above. The values of the Klinkenberg constants for these materials were extracted from the data. However, the results were found to be extremely variable and some values were negative, indicating an increase in the intrinsic permeability with increasing average pressure. Hence, the intrinsic permeability values for the high porosity grouts can be considered to be approximately constant over the range of average pressures studied here.
6.7.4 Comparison with water intrinsic permeability values
Since the viscous flow of fluids is governed by the Darcy equation (1.6), the intrinsic permeability should be equal for all fluids. The flow of gases is complicated by the Klinkenberg effect and compressibility, but the infinite pressure intrinsic permeability values for dry material should be equal to those for liquids such as water, as discussed in Chapter 1. The data for material conditioned at 100 % RH cannot be directly compared to that for water flow.
The water intrinsic permeability values for both the SRC- and PFA/PC-concretes have been shown to be less than about 10−21 m2. Table 6.5 indicates that the infinite pressure intrinsic permeability values for the concretes are more than four orders of magnitude greater than this. Although the water permeability measurements were complicated by the continued hydration of the materials, it is unlikely that the difference can be explained by this effect.
The water intrinsic permeability of the preliminary backfill grout has been measured as about 4 × 10⁻¹⁶ m2.This value is approximately two orders of magnitude lower than the infinite pressure intrinsic permeability of the dry grout given in Table 6.6. In contrast, the water permeability of the reference backfill grout, at 2 × 10⁻¹⁶ m2. is close to the infinite pressure intrinsic permeability. No water permeability data is available for the GGBS/PC-grout.
The data discussed above demonstrates completely different relationships between water and gas intrinsic permeability. Only the reference backfill grout shows the close agreement between the two data expected initially. The reasons for these differences in the behaviour of the materials are uncertain, and may reflect differences in pore structure under dry and wet conditions, that is the presence of water not only fills pore space but changes its characteristics.
6.7.5 Interaction between gas and water in cementitious materials
Comparison of the intrinsic permeability values obtained for the experimental materials in the dry and 100 % RH conditioned states demonstrates that the influence of water within the pore structure of cementitious materials is crucial in determining gas migration rates. The comparison between the effective intrinsic permeability for the solution-diffusion migration mechanism and the measured intrinsic permeability values demonstrates that none of the experimental materials can be considered to be fully water saturated under any of the experimental conditions in this study (see Section 6.7.2).
As discussed above, the only mechanism available for gas migration in fully water-saturated material is solution-diffusion. The equivalent intrinsic permeability for solution-diffusion, about 10−23 m2, is significantly lower than the lowest intrinsic permeability values measured for any of the 100 % RH conditioned materials. Hence it appears that the gas migration observed in this study may differ significantly from that expected for the truly water-saturated condition.
The application of a pressure difference to a water-saturated porous material will result in the expulsion of water from pores which exceed a particular size. The expulsion of a fluid from a capillary requires the application of an excess pressure denoted the capillary pressure. The capillary pressure p for a pore of radius r, assuming an angle of contact between the fluid and the capillary wall of 90°, is given by equation (1.34).
The approximate capillary pressures for the average pore radius of both the PFA/PC-concrete and the GGBS/PC-grout are 13 MPa whilst those for preliminary and reference backfill grouts are 210 and 320 kPa, respectively.
In the low pressure experiments, the maximum applied pressure was 200 kPa. This pressure can expel water from pores of the order of 0.7 μm. The MIP results for the two backfill grouts show that both materials exhibit a significant volume of porosity with pore radii above this value. Hence, water expulsion may occur in the 100 % RH conditioned specimens even in the low pressure experiments. Measurements made on the backfill grouts using higher applied pressures may exhibit significant water expulsion effects. This would result in measured intrinsic permeability values in excess of that expected for fully-saturated material based on the solution-diffusion model of gas migration. In addition, the increased expulsion of water at higher pressures may give an increase in permeability with applied pressure.
The above discussion assumes that the average pore radius obtained from the MIP measurements is the maximum pore size available. This is unlikely to be true and, although the pore size distributions of the high porosity grouts are substantially skewed towards the larger pore sizes, there will be significant porosity with radii in excess of the average values. The experimental results appear to demonstrate that the migration of gas is significantly affected by the presence of these larger pores.
Similar effects would be expected for the PFA/PC-concrete and the GGBS/PC-grout. However, the finer pore structure would mitigate the effect and hence the measured intrinsic permeability values for 100 % RH conditioned material should be closer to the value predicted by the solution-diffusion model. This is demonstrated by the comparison between the measured intrinsic permeability values for these materials and those measured for the backfill grouts.
The weight losses measured during conditioning at 100 % RH for both the preliminary and reference backfill grouts indicate that full water saturation may not have been achieved prior to the commencement of the experiments. It is possible that the water within the larger pores in these materials was draining under the influence of gravity. Thus, the data obtained for 100 % RH conditioned specimens may not be representative of the behaviour of fully water-saturated material.
The retention of water within a capillary is governed by the balance between the capillary pressure and the gravitational force exerted by the weight of the water. Consequently, water will only be retained in pores of a given radius if the pore length does not exceed a particular value. This length can be calculated by equating the capillary pressure to the hydrostatic pressure of a column of water in equation (1.35).
The maximum pore heights calculated from this equation are 21 and 32 m for the preliminary and reference backfill grout average pore radii, respectively. Since the specimen thicknesses are only a few centimetres, it is apparent that the weight loss cannot be explained by gravitational draining.
If the movement of water under the influence of gravity is occurring, despite the argument above, it may provide an additional means whereby the migration of gas within a repository could occur. In particular, the movement of water may allow a consequent migration of gas as a ‘bubble’ which migrates upwards as the water flows down around it. This is considered as a possible mechanism for the escape of gas from a nuclear waste repository as discussed in Chapter 14.
6.8 Conclusions
• The gas intrinsic permeability values for generic repository construction materials have been determined for specimens in dry and in both partially and fully water-saturated conditions. It has been shown that the permeability of the structural PFA/PC-concrete is dependent on both gas type and average pressure under all conditions. The intrinsic permeability is approximately independent of average pressure at pressures above about 1 MPa. These effects are attributable to an additional component of gas flow caused by significant Knudsen flow at lower average pressures. The intrinsic permeability is significantly reduced for water-saturated conditions due to a reduction in the volume of porosity available for gas flow.
• Gas flow in the two high porosity backfill materials is not significantly dependent on the average pressure in the range 100 kPa to 3 MPa. Some differences are observed for measurements carried out using helium and argon. The contribution of Knudsen flow to gas migration in these materials is small at the average pressures studied due to the generally larger pore size when compared with the structural concrete. The intrinsic permeability is significantly reduced when the materials are water saturated, but it remains several orders of magnitude greater than that observed in the PFA/PC-concrete. The GGBS/PC-grout, typical of the encapsulation materials placed within waste packages, has a similar intrinsic permeability value to those measured for the backfill grouts when dry but exhibits a significantly lower permeability, close to that of the concrete, when water saturated. Some dependence on average pressure is observed. The properties of this material may be affected by damage during drying.
• The presence of interfaces within the cementitious materials, such as construction joints, results in an increase in the permeability of the materials when water is present. No significant increase was observed in dry materials.
• The observed intrinsic permeability values for water-saturated materials are all significantly greater than the intrinsic permeability predicted by the solution-diffusion mechanism of gas migration. This may be due to the movement or displacement of the water within the pore structure or, in particular, expulsion of water from the pores by the applied gas pressure. Such an effect would result in an increase in the intrinsic permeability at higher applied pressures.