
This recipe will leverage R Markdown to produce parametrized reports where the user is prompted to specify arguments related to the report, and the report is then produced.
In this recipe, you will find screenshots taken from an R Markdown document.
The full document is provided within the RStudio project related to the cookbook, under the name parametrized_report.rmd.
From a technical point of view, all you need in order to perform this recipe is to install the rmarkdown and knintr packages, so let's install and load them:
Install.packages("rmarkdown",type = "source")
install.packages("knitr)
library(rmarkdown)
library(knitr)
From a practical point of view, you should quickly run through the Using one markup language for all types of documents – rmarkdown recipe from Chapter 7, Developing Static Reports. It will make you confident about using the R Markdown language.
- Create a new R Markdown report.
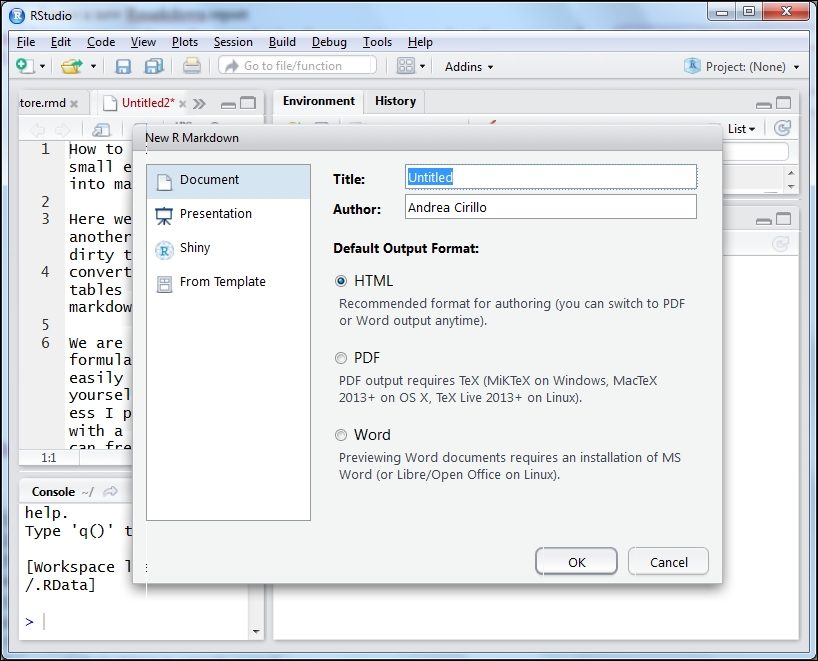
R Markdown reports can be easily created using the appropriate control in the upper-left corner of RStudio:

You can now select the title of your report and the type of output. Refer to the Using one markup language for all types of documents – rmarkdown recipe in Chapter 7, Developing Static Reports for further details:
- We then define the parameters:

- Next, let's define the function-calling parameters:

- Test your report.
There are two ways to test your report. You can try out either of the following:
Both alternatives will result in a window popping up, asking you to specify the value of the parameters created:

After having provided the selected value of the parameter (try for instance
GOOGLinstead of the defaultAAPL), you will have to press Knit to produce the actual report:

We first created the document. Then, we actually defined the parameter we will use to interactively change our report inputs.
Parameters are defined within the yaml chunk, which defines some metadata for the document. It is used within the document-deployment phase to understand the kind of output you expect, whether you need a table of content, and of course, whether some parameters are to be asked to the user.
Let's have a look at the structure of our stock parameter:
- Label: This is the message the user will see. It is intended to explain what the parameter is about and how the user should define it.
- Value: This is the default value of our parameter.
- Input: This is the kind of input control shown to the user to let them select the parameter value. These controls are taken directly from the Shiny web application framework, which is explained in the Developing a single-file Shiny app recipe.
It is important to visualize that as parameters should be defined, all those values that are likely to change within the report, such as the cutoff date, geographical area, family of product, and relevant process to be investigated can't be hard coded within the report.
Once you make the effort to define a parameter, you can try using it. As you can see, parameters are stored within a list called params. Each parameter is a named object of the list, so you can call it using the familiar operator $.
To see your report appear, you can both run it with the custom control on the RStudio interface or run the render function from the rmarkdown package, specifying in this case that the parameter's value needs to be selected by the user. As you can guess, you could also pass their value within the render function with a script similar to the following one:
render("parametrixed_report.Rmd", params = list(stock= c("GOOGL"))This can actually be a useful trick if you need to automate the production of reports. For instance, at a specific closing date, you may have to produce some reports on different subsidiaries of your company. You could write a loop to run this function once for each of your subsidiaries:
library(rmakdown)
subsidiaries <- c("alpha","beta","gamma)
for (i in 1:subsidiaries){
render("parametrized_report.Rmd", params = list(company= subsidiaries[i])
}
The preceding code will produce a report in your working directory for each subsidiary. Isn't that great? Who is still saying R is just for statistical analysis?
Parametrized reports are on the very edge of R Markdown development. You will therefore not find a lot of material on them. Nevertheless, I suggest that you check out the official R Markdown website at http://rmarkdown.rstudio.com/ for updated articles and documentation.