
Public objects are also known as application objects, and are based on the schema objects. The following diagram shows all the public objects available in MicroStrategy:

In the following section, we will discuss these public objects in detail.
Metrics are public objects that are built from attributes, facts, or other metrics that allow data aggregation. A metric definition contains a formula that determines the calculation to be performed on the data. At a high level, metrics can be categorized as:
- Simple metrics
- Advanced metrics
- Simple metrics include:
- Basic metrics: Simple aggregations of fact, for example SUM (amount), AVG (sale), and so on
- Compound metrics: Combinations of two or more metric objects with one or more constant, mathematical operator, or non-aggregate function, for example, revenue = quantity * price, Runningavg (sales), where sales is a metric
- Advanced metrics include:
- Level metrics: Define the level at which the metric aggregates. By default, all metrics calculate at report level, but the metric-specified attribute levels override the default report level. For example, revenue amount is the sum of revenue calculated at the product category level:

Here is an example of creating a report using simple and level metrics. The following screenshot displays a report where we have total premium amount, calculated at the product level and as a whole:

- Nested metrics: Use nested functions for aggregation. For example, the average product sales metric formula is defined as: AVG (SUM (sales){~,product}){~, Region}.
- Non-aggregatable metrics: Metrics that should not be aggregated across a particular attribute or hierarchy. By default, the aggregation function is SUM, which can be set to none, so that the metric does not aggregate to any level. For example, this might include account balance calculations at the end of each day.
- Pass through metrics: Metrics created by using pass through functions such as ApplySimple and ApplyComparison. These functions can input a database syntax inside a metric: ApplyComparison ("#0>#1", [COLUMN_NAME],2).
- Conditional metrics: Metrics with their own filter, which is separate from any other filter specified for the report. For example, let's say the user has a year filter on the report; regardless of that filter, the user wants one of the metrics to calculate 2007 sales. This could be achieved via a conditional metric that ignores the report filter and applies its own filter first:

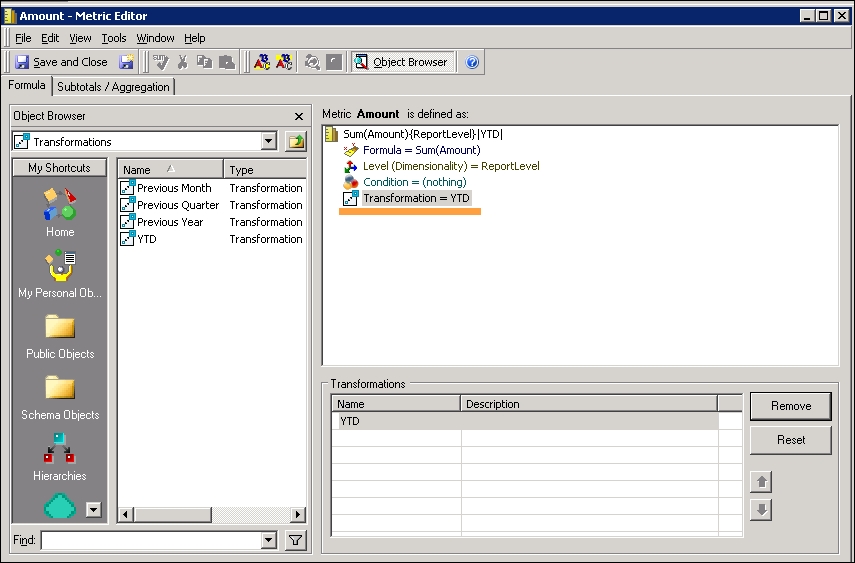
- Transformation metrics: Transformation is the schema object that is used in metrics for time-based analysis. Examples of transformation metrics can be month-to-date, year-to-date, year-over-year, and so on:
- Derived metrics: Metrics created within a report or document using the same report or document objects. These metrics cannot be reused in another report or document. For example, here we have internet sales and reseller sale as metrics, and we want to find the total sales, which can be achieved using derived metrics, by adding internet sales and resellers sale, as shown here:

- Level metrics: Define the level at which the metric aggregates. By default, all metrics calculate at report level, but the metric-specified attribute levels override the default report level. For example, revenue amount is the sum of revenue calculated at the product category level:
The following are the steps to create metrics:
- Log in to MicroStrategy Developer.
- Navigate to the Project | Public Objects | Metrics folders.
- To create metrics, either Select File | New | Metrics, or right-click within the metrics folder and select New | Metrics.
- Select Empty Metric and click OK.
- The Metric Editor window opens. In the object browser panel on the left, navigate to Schema Objects | Facts.
- Drag one of the facts to the definition box on the right. By default, the Sum function is applied to the fact:

- Click on Validate to check the formula.
- Click Save and Close, and enter the name for the metric.
These public objects present users with a set of questions that users may need to answer in order to run the reports. Some prompts are mandatory and some are optional. There are the different types of prompt:
- Filter definition prompt
- Hierarchy qualification prompt
- Attribute qualification prompt
- Attribute element list
- Metric qualification prompt
- Object prompt
- Value prompt
- Hierarchy qualification prompt allows the user to qualify attributes and elements from a specific hierarchy
- Attribute qualification prompt allows the user to qualify an attribute's ID, description, or other form
- Attribute element list allows the user to choose from a list of elements
- Metric qualification prompt allows the user to qualify one or more metrics
- Object prompt allows the user to select from one or more objects, such as attributes, metrics, or filters, and also allows them to add more data to the report
- Value prompt allows the user to enter a text, date, number, or other value
- Start MicroStrategy Desktop and log in to the project.
- Navigate to Public Objects | Prompts.
- Under the
promptsfolder, click File | New | Prompt. - From the Prompt Generation Wizard, select Filter definition prompt | Qualify on an attribute:

- Click Next and choose the attribute that the user wants as a prompt:

- Click Next and on this screen select prompt answer required (this selection will make this prompt mandatory):

- Click Next and Finish.
Filters define the conditions that are applied to the report or metric, based on which the data is displayed or returned to the report from the data warehouse. It basically limits the report's dataset.
- Log in to MicroStrategy Developer.
- Navigate to the Project | Public Objects | Filter folder.
- To create a filter, either select File | New | Filter, or right-click within the
filterfolder and select New | Filter. - Select Empty filter and Click OK.
- Select the appropriate filtering option:
- Attribute qualification: Creates a filter based on an attribute, such as customer name, customer ID, and so on
- Set qualification: Creates a filter based on the metrics or the relationship between the attributes
- Shortcut qualification: Creates a filter based on the results of existing reports or an existing filter

- Enter all the required information and click Save and Close.
- Enter the filter name.
Filter operators describe how the user wants to filter data. In the following example, Base Year Month can use any of the following operators:

So if we say Base Year Month is exactly 201601, then it will give us data only for that time period.
Let's say the user wants to display the revenue of an organization for the year 2007; this could be achieved using a filter on the report like this:

