
Let's run the Desktop application for the first time by clicking on it:

From this moment we can start to build a new dashboard using one of the following options:
- Add new data by acquiring external data from flat files, relational databases, or any other data source
- Add datasets from a server, for example, connect to an existing MicroStrategy Intelligence Server and choose grid objects
- Browse objects on the server: choose attributes, metrics, and so on, in order to build dashboards
Let's try to build our first visualization using a Microsoft spreadsheet with data:
- Click on Add New Data.
- Choose File from Disk.
Tip
You can find all related files in an attachment to this book that you can download from the www.packtpub.com website.
- Find
Dataset1.xlsand click Finish. The data will be imported. Attributes and metrics will appear in the DASHBOARD DATASETS toolbar. - In order to create a visualization, we should simply drag and drop the
Product Subcategoryattribute to the rows section and the Internet Order Quantity metric to the column section. DragProduct Categoryto rows andInternet Order Quantityto columns. - Then change the data visualization to Heat Map.
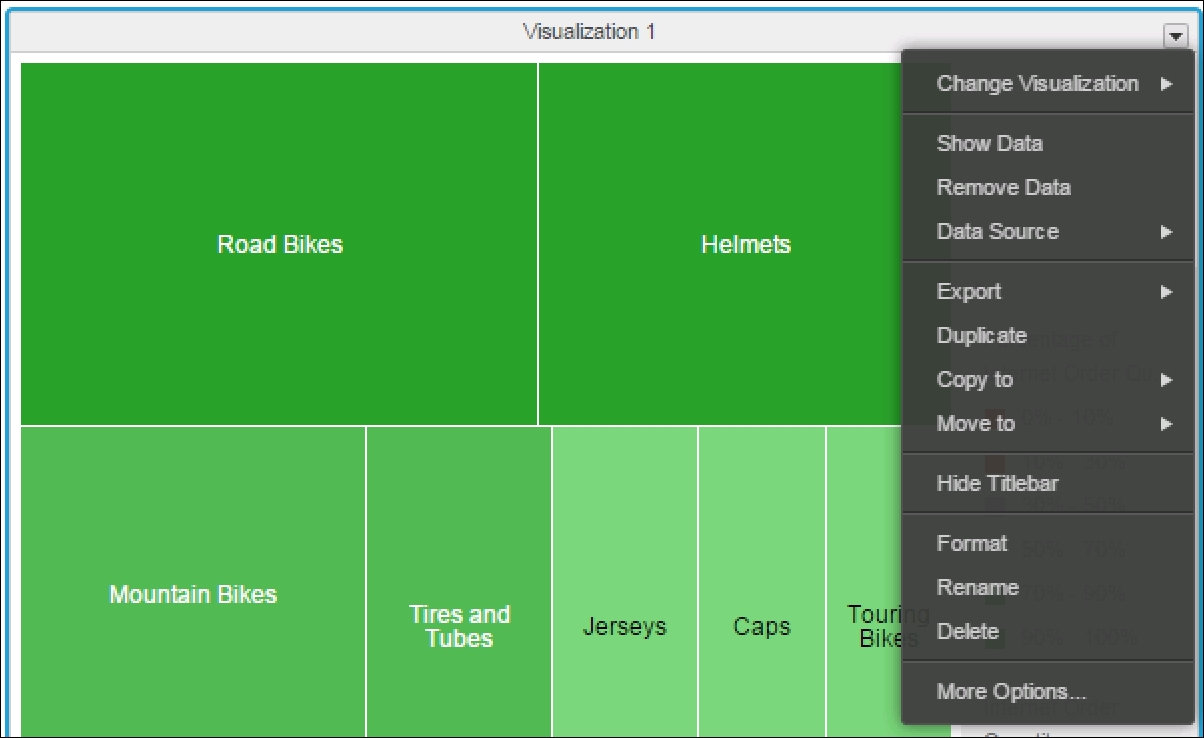
As a result, we can build a small chart that shows us the top product subcategory:

We can customize this data visualization by going to the option of Visualization 1; we should click on the small arrow in the top-right corner. You have to keep your cursor over the visualization to make this arrow visible:
Moreover, we need to cover the main toolbar:

- Undo: We can take a step back in order to cancel the last change in the dashboard/report.
- Redo: We can take one step forward in order to apply the last change to the dashboard/report.
- Save: We can the save dashboard/report.
- New Data: We can add data from any source or MicroStrategy Intelligence Server.
- Insert Visualization: We can add more visualization windows and combine them into one dashboard.
- Insert: We can insert Text, Filters, Images, or HTML containers.
- Refresh Dataset: We can refresh the dashboard/report. Usually, we should do this if the source data is changed.
- Annotation Mode: Allows us to put annotations on the dashboards and print it or save it as an image.
- Presentation Mode: It is a kind of full screen in order to have a better look at the dashboard/report.
Finally, we can add more sheets to one dashboard. For example, if we want to create one dashboard covering different departments such as Sales, Marketing, and Inventory. We can create four sheets, one summary sheet, and another to detail information about every department.
Let's build a dashboard in order to see the main capabilities of MicroStrategy Desktop. Before we start to build our dashboard, we should design it. It is good practice to take a pencil and sheet of paper and draw a sketch. It can help us save time and be more productive. Another piece of advice - do not spend lot of time on sketches. Dashboard development is an iterative process. It means, we should start an early prototype dashboard and demonstrate it to our business clients.
This is a small dashboard that we will build in order to meet the functionality of MicroStrategy Desktop:
