
Successfully developing a mobile application usually requires several steps before actually developing an app: (1) determine business goals; (2) storyboarding and planning; (3) creating templates; (4) creating suitable data; and finally, (5) mobile app development.
In this step, mobile developers need to know the requirements. Who are the users? What kind of visualizations are needed? Are there any specific functionality requirements? How many apps need to be created? In addition, you will also need to know:
- The goals of the app and the business process
- Primary task and users
- What data is being accessed
- Assess and prioritize requested features
For example, we need to create an app that will help an organization analyze sales performance, and to help buyers with visits:
|
Audience |
Task |
Goal |
|
Executives |
Trend analysis |
Company trend of sales over time |
|
Executives Regional Managers |
Product analysis |
Sales performance of product: by categories and brands |
|
Regional Managers |
Customer analysis |
Revenue performance by customer in region |
|
Buyers |
Supplier location |
Sales visits by buyers |
|
Buyers |
Supplier analysis |
Performance of supplier |
|
Buyers |
Supplier information |
Contact information for the buyer |
The second step is storyboarding and planning. The storyboard is to visualize the whole workflow based on the requirements, by providing the screens and the organization of the screens using paper, or software like Visio; storyboarding helps keep the conversation going between IT and business users.
Planning is to decide detailed objects requirements, and how to navigate in the app:

For example, after discussing the storyboard with business users, we decide to build two separate apps for different users. For executives and managers, we build Sales Performance App; for buyers, we build Buyer Visit App. Details are shown in the following image:

First, we need a suitable document template. There are two ways to do this. MicroStrategy has many prebuild templates, including the iPad Landscape template. They are hidden, but you can unhide them and start using them. Alternatively, you can create the template yourself. Let us see how to unhide templates, and how to create new templates.
Certain document templates are hidden; to unhide them, follow these steps:
- Open MicroStrategy Developer, click Tools | Preference.
- Click Developer | Browsing, unselect Display hidden objects, click OK.
- Now you can see hidden folders and other objects. Choose the Object Templates folder, choose
Documentfolder; you should see some templates are hidden. - Right-click a hidden template, unselect Hidden, click OK:

Before you start, you certainly need to log in to a project, and make sure you select to display Pixels instead of Inches. To do this, click User Preference on the top-right of the web interface, click Preferences | General, under Language, click Advanced Options, and choose Pixels for Measurement Units:

Templates are nothing more than regular documents. When you put a document into the template folder, it serves as a template. Follow these steps to create an iPad Landscape Template:
- Click Create Document.
- Click Tools | Document Properties.
- Under Layout Properties | Sections, uncheck all except Detailed Header.
- Under Page, input
2048for Width,1536for Height, and Landscape for Orientation. Click OK:
Adjust the view to make your canvas look correct:
- Click Tools | Manage views.
- Set Resolution to
2048X1536, and Orientation to Landscape Only. - Drag the right-hand side and bottom edges of the canvas to the proper place.
- Under Document Home, choose Fit Page. Save the document:

Dataset creation is no different than generating ordinary reports; however, because of the limitations in processing power, network bandwidth, and in memory for mobile devices, it is a good idea to keep the datasets small.
In this chapter, we import and use the following datasets:

In this section, we create the skeleton for the Sales Performance App, which is made up of the main panel stack, and panels:
- Create a document based on the
iPad Retina Landscapetemplate and save it as Sales Performance App. - Click INSERT, click Panel Stack, draw a panel stack on canvas, right-click on panel stack, and click Properties and Formatting.
- Set Properties | Layout | Size, Width
2048, Height1536. - Click Add Panel and repeat five times, then rename the added panels to
Home,Product,Region,Trends, andCustomer. - Right-click on Main Panel Stack and click Create Panel Selector.
- Right-click on the panel selector in Properties and Formatting, set the Properties | Layout | Selector | DHTML Style from default Drop-down to Button Bar, and click OK.
- Adjust Position, and Size to proper values:


The result is a blank panel stack containing five panels and a panel selector.
We want to create a home page, a dashboard showing the sales overviews and KPIs:

It has four parts: a profits pie chart, a time series graph of revenue, KPIs, and a bar chart for top 5 sales. We will show how to create these parts.
The result we want to achieve is as follows:

Here are the steps to create it:
- Click INSERT, click Grid, and draw the grid on the canvas.
- Drag Year, Category, and Profit into the grid.
- Right-click on Year and click Create Selector Control.
- Right-click on the selector control, set the Properties | Layout | Selector | DHTML Style to Button Bar, and adjust it to the proper width and height.
- Right-click on the grid, click View Mode | Graph View, click on Graph, and change to Pie chart:

The following is the result we want:

Here are the steps to create it:
- Click INSERT, click Grid, and draw the grid on the canvas.
- Drag Year, Category, and Revenue into the grid.
- Right-click on Category and click Create Selector Control.
- Right-click on the selector control, set the Properties | Layout | Selector | DHTML Style to Button Bar, and adjust it to the proper width and height.
- Right-click on the grid, click View Mode | Graph View, click Graph, and change to Pie chart.
- Take manual control of Property and Formatting | Properties | Selector | Targets:

The following is the result we want:

The steps to create it are as follows:
- Drag metrics Profits, Units Sold, and Revenue on to the canvas.
- Double-click the textbox and input necessary text.
- Right-click on the textbox, click Properties and Formatting, and change text sizes.
The result we want is as follows:

Here are the steps to create it:
- Click INSERT, click Grid, and draw the grid on the canvas.
- Drag Year, Subcategory, and Units Sold into the grid.
- Change into interactive edit mode and sort by Units Sold.
- Change into edit mode, right-click on Subcategory, and click Edit View Filter.
- Click Add New Condition, Units Sold, Highest, and input
5for the value. - Right-click on the grid, choose View Mode | Graph View, click Graph, and choose Horizontal Bar:

The result we want to achieve is as follows:

Here are the steps to create it:
- Click INSERT, click Grid, and draw the grid on the canvas.
- Drag Category, Call Centre, Month, and Units Sold into the grid.
- Right-click on Category and click Create Selector Control.
- Right-click on the grid, click Properties and Formatting, and click Properties | Widget | Widget Selection | Widget | Mobile | Microcharts:
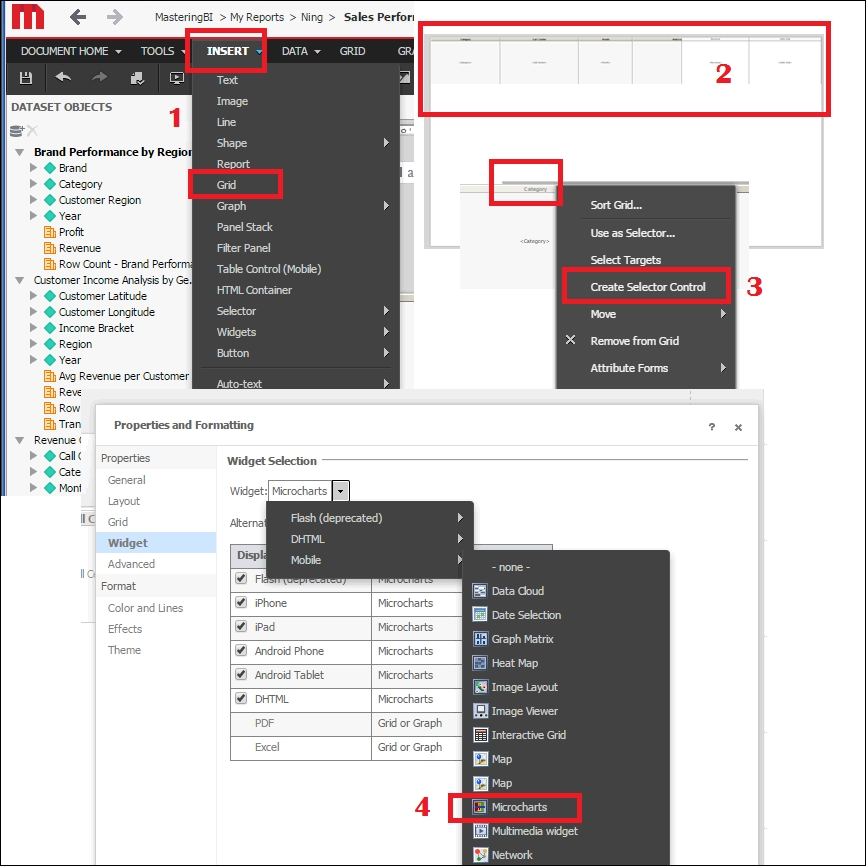
The result we want to achieve is as follows:

Here are the steps to create it:
- Navigate to the Region panel.
- Click INSERT | Widgets | Mobile | Heat Map.
- Drag Region, Call Centre, Units Sold, and Revenue into the grid:

The result we want is as follows:

Here are the steps to create it:
- Navigate to the Trends panel.
- Click INSERT | Widgets | Mobile | Time Series.
- Drag Month, Metrics, Revenue, and Units Sold into the grid.
- Note that Time Series Widgets can only be viewed in mobile mode (we cheated on the previous result graph):

The result we want is as follows:

Here are the steps to create it:
- Navigate to the Customer panel.
- Click INSERT | Widgets | Mobile | Map.
- Drag Zip Code, Customer Latitude, Customer Longitude, Avg Revenue per Customer, and Transactions Per Customer into the grid.
- Right-click on the grid, click Properties, set Select Latitude to Customer Latitude, set Select Longitude to Customer Longitude, and set Selection display attribute to Zip code.
- Note that Map Widgets can only be viewed in mobile mode:

Prompts in mobiles work basically the same as those in Web. Numeric value prompts display in different ways depending on the data involved, for example, date and time picker, Boolean switch, and numeric stepper. There are two prompts native to mobile:
- Geo Location prompt: This can work both by entering a value or choosing from an element list, for example, a list of cities
- Barcode Reader prompt:

Prompts can help filter out unwanted records, to target only the information of interest.
Multiple versions of an app can be created with multiple layouts of views. A layout can have multiple views. Multiple views are useful for different screen sizes and orientation. Views do not share objects with other layouts. Views reduce design time and maintenance. Multiple views do not have to show the same data, that is, if you rotate the screen, you want to see some new content.
To add views, click Tools | Document Properties | Advanced | Layout Properties | Mobile | Support orientations: Portrait and Landscape.
To manage views, right-click on the object and click Manage views. You can create one view for portrait only, and create a second view for landscape only, by using Views Editor:

Links enable navigation to reports and documents. There are three ways to provide linking: Links Editor, Document Links, and URL API.
One thing to note is that intra-document links only work for mobiles; testing should be done on the device. External apps can be opened: mail, text messaging, phone, and so on.
Using Buyer Visit App as an example, on the home page, we have a Location button, which is linked to a Buyer App - Location document. Here is how to create it:
- Insert a button, Location.
- Right-click on the button and click Properties and Formatting.
- Click Properties | Button | Actions.
- Under Links, specify Buyer App - Location to run this report or document:
