
Download any sample big data files or extract logs from systems using Flume and so on. For the purpose of the book we will be downloading the dataset from the following URL:
http://www.seanlahman.com/?s=lahman591-csv.zip
Extract the ZIP file.
Upload the data file to HDFS by following these steps:
- Navigate to the HDFS files directory from the Hortonworks web interface.
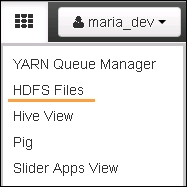
- Navigate to
/usr/maria_devand click on the Upload button. - Click on the Browse button, navigate to the location where we extracted the downloaded ZIP file, and select the
batting.csvfile. - Now, open a Hive view by clicking on the Hive View button.
- In this view, create a table to hold the data by executing the following command:
create table intermediate_batting (col_value STRING); - Upon execution of the query, we can view the
intermediate_battingtable under default databases. - Execute the following command to load the
batting.csvdata file into theintermediate_battingtable:Load data inpath '/user/maria_dev/Batting.csv' overwrite into table intermediate_batting;
- Create a table called
battingusing the following command:create table batting (player_id STRING, year INT, runs INT);
Extract data from the intermediate_batting table to the batting table using the following commands:
insert overwrite table batting
SELECT
    regexp_extract(col_value, '^(?:([^,]*),?){1}', 1) player_id,
    regexp_extract(col_value, '^(?:([^,]*),?){2}', 1) year,
    regexp_extract(col_value, '^(?:([^,]*),?){9}', 1) run
from intermediate_batting;
Now, that we have the table in Hadoop we can start creating a MicroStrategy report based on this as:
- Select the table from the list of available tables.
- Double click on table selected and click Finish (this step also let user prepare their data).
This gives you two data access options, as follows:
- Connect Live allows users to select data directly from the data source
- Import as an in-memory dataset allows users to access data based on the stored results.

Select Connect Live and create a dashboard based on the data imported.

With MicroStrategy 10, users have the ability to prepare data. In the previous section, when we were creating a dashboard using data from Hadoop, we were presented with the step of data preparation, or data wrangling, which allows business users to explore the data to improve its quality before it is imported to MicroStrategy. Example of data preparation include:
- Removing white spaces
- Concatenating columns
- Deleting cells with null values
The following screenshot presents data wrangling:

So, even if the user is exporting data from any source, they can still prepare it without ETL and data modeling.

So, let's say we have data loaded from a source to store coordinates in one column, but we want to have two separate columns to store this data. We can do it using data wrangling.
The following screenshot shows data loaded from source:

Use the data wrangle functionality to prepare data for reporting:

Output columns will be displayed as follows:
