
In this recipe, we will show how easy it is to debug applications within Xcode and the iOS Simulator.
Xcode 4, provides you with a debugger for debugging your applications either using the iOS Simulator or on the actual iOS device. In this recipe, we will see how easy it is to debug applications to debug our HelloWorld application.
Debugging your application using the Xcode development environment is a simple process, and allows you to monitor changes to your application variables, as well as stepping through your source code line by line, and can be achieved by performing the following simple steps:
- Open the
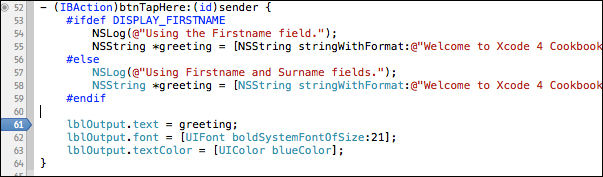
ViewController.mimplementation file from the project navigator. - Next, locate the
btnTapHereevent method and place a breakpoint within the gray gutter, as shown in the following screenshot. - You will notice that an arrow appears at the line you placed the marker at.
- Next, build and run the application by selecting Product | Run from the Product menu, or alternatively by pressing command + R.
- Populate the Firstname and Surname fields, and click on the Tap Here button.
- You will notice that execution of our application has paused, and the debugger has stopped at the line where we placed our breakpoint.
- Hover the mouse over the
greetingvariable in the breakpoint line to see the contents of the greeting label.
- To continue execution of your application, click on the Continue program execution button.
Although you can use the debugger to pause execution of your program at any time and view the state of your program variables, it is better to set the breakpoints before you run your application.
A breakpoint is basically an instruction that tells the application to stop when the breakpoint has been reached. During this phase, the execution of your code pauses and waits for further instructions as to what to do next. During this phase, you have the opportunity to either inspect the current values of any of the properties, or step through the code.
- If you would like to find out more information about the debugging features of Xcode, you can refer to the Apple developer documentation located at http://developer.apple.com/library/ios/#documentation/ToolsLanguages/Conceptual/Xcode4UserGuide/060-Debug_Your_App/debug_app.html
#//apple_ref/doc/uid/TP40010215-CH3-SW1.