
Chapter 2. Introducing recommenders
- What recommenders are, within Mahout
- A first look at a recommender in action
- Evaluating the accuracy and quality of recommender engines
- Evaluating a recommender on a real data set: GroupLens
Each day we form opinions about things we like, don’t like, and don’t even care about. It happens unconsciously. You hear a song on the radio and either notice it because it’s catchy, or because it sounds awful—or maybe you don’t notice it at all. The same thing happens with T-shirts, salads, hairstyles, ski resorts, faces, and television shows.
Although people’s tastes vary, they do follow patterns. People tend to like things that are similar to other things they like. Because Sean loves bacon-lettuce-and-tomato sandwiches, you can guess that he would enjoy a club sandwich, which is mostly the same sandwich but with turkey. Likewise, people tend to like things that similar people like.
These patterns can be used to predict such likes and dislikes. Recommendation is all about predicting these patterns of taste, and using them to discover new and desirable things you didn’t already know about.
After introducing the idea of recommendation in more depth, this chapter will help you experiment with some Mahout code to run a simple recommender engine and understand how well it works, in order to give you an immediate feel for how Mahout works in this regard.
2.1. Defining recommendation
You picked up this book from the shelf for a reason. Maybe you saw it next to other books you know and find useful, and you figured the bookstore put it there because people who like those books tend to like this one too. Maybe you saw this book on the bookshelf of a coworker, who you know shares your interest in machine learning, or perhaps they recommended it to you directly.
These are different, but valid, strategies for discovering new things: to discover items you may like, you could look to what people with similar tastes seem to like. On the other hand, you could figure out what items are like the ones you already like, again by looking to others’ apparent preferences. In fact, these are the two broadest categories of recommender engine algorithms: user-based and item-based recommenders, both of which are well represented within Mahout.
Strictly speaking, the preceding scenarios are examples of collaborative filtering—producing recommendations based on, and only based on, knowledge of users’ relationships to items. These techniques require no knowledge of the properties of the items themselves. This is, in a way, an advantage. This recommender framework doesn’t care whether the items are books, theme parks, flowers, or even other people, because nothing about their attributes enters into any of the input.
There are other approaches based on the attributes of items, and these are generally referred to as content-based recommendation techniques. For example, if a friend recommended this book to you because it’s a Manning book, and the friend likes other Manning books, then the friend is engaging in something more like content-based recommendation. The suggestion is based on an attribute of the books: the publisher.
There’s nothing wrong with content-based techniques; on the contrary, they can work quite well. They’re necessarily domain-specific approaches, and they’d be hard to meaningfully codify into a framework. To build an effective content-based book recommender, one would have to decide which attributes of a book—page count, author, publisher, color, font—are meaningful, and to what degree. None of this knowledge translates into any other domain; recommending books this way doesn’t help in the area of recommending pizza toppings.
For this reason, Mahout won’t have much to say about content-based recommendations. These ideas can be built into, and on top of, what Mahout provides; as such, it might technically be called a collaborative filtering framework. An example of this will follow in chapter 5, where you’ll build a recommender for a dating site.
For now, though, it’s time to experiment with collaborative filtering within Mahout by creating some simple input and finding recommendations based on the input.
2.2. Running a first recommender engine
Mahout contains a recommender engine—several types of them, in fact, beginning with conventional user-based and item-based recommenders. It includes implementations of several other algorithms as well, but for now we’ll explore a simple user-based recommender.
2.2.1. Creating the input
To explore recommendations in Mahout, it’s best to start with a trivial example.
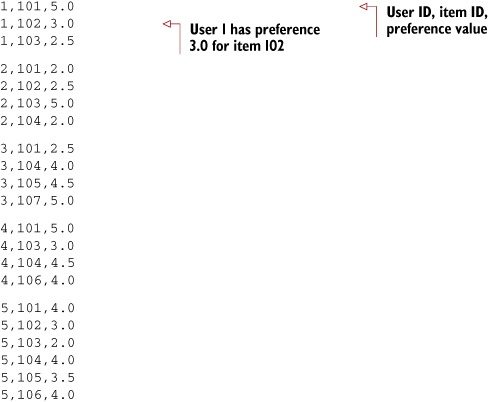
The recommender requires input—data on which it will base its recommendations. This data takes the form of preferences in Mahout-speak. Because the recommender engines that are most familiar involve recommending items to users, it’ll be most convenient to talk about preferences as associations from users to items—though, as noted previously, these users and items could be anything. A preference consists of a user ID and an item ID, and usually a number expressing the strength of the user’s preference for the item. IDs in Mahout are always numbers—integers, in fact. The preference value could be anything, as long as larger values mean stronger positive preferences. For instance, these values might be ratings on a scale of 1 to 5, where 1 indicates items the user can’t stand, and 5 indicates favorites.
Create a text file containing data about users, who are cleverly named “1” to “5,” and their preferences for seven books, simply called “101” through “107.” In real life, these might be customer IDs and product IDs from a company database; Mahout doesn’t require that the users and items be named with numbers. Write this data in a simple comma-separated value format.
Copy the following example into a file and save it as intro.csv.
Listing 2.1. Recommender input file, intro.csv
With some study, trends appear. Users 1 and 5 seem to have similar tastes. They both like book 101, like 102 a little less, and like 103 less still. The same goes for users 1 and 4, as they seem to like 101 and 103 identically (no word on how user 4 likes 102 though). On the other hand, users 1 and 2 have tastes that seem to run counter to each other—1 likes 101 whereas 2 doesn’t, and 1 likes 103 but 2 is just the opposite. Users 1 and 3 don’t overlap much—the only book both express a preference for is 101. Figure 2.1 illustrates the relationships, both positive and negative, between users and items.
Figure 2.1. Relationships between users 1 to 5 and items 101 to 107. Dashed lines represent associations that seem negative—the user doesn’t seem to like the item much but expresses a relationship to the item.

2.2.2. Creating a recommender
So what book might you recommend to user 1? Not 101, 102, or 103—user 1 already knows about these books, apparently, and recommendation is about discovering new things. Intuition suggests that because users 4 and 5 seem similar to 1, it would be good to recommend something that user 4 or user 5 likes. That leaves books 104, 105, and 106 as possible recommendations. On the whole, 104 seems to be the most liked of these possibilities, judging by the preference values of 4.5 and 4.0 for item 104.
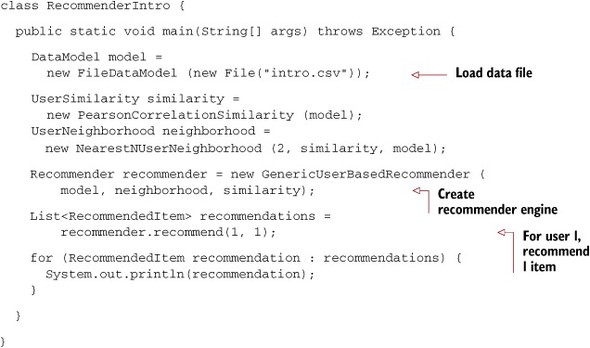
Now, run the following code.
Listing 2.2. A simple user-based recommender program with Mahout
To help visualize the relationship between these basic components, see figure 2.2. Not all Mahout-based recommenders will look like this—some will employ different components with different relationships. But this gives a sense of what’s going on in the example.
Figure 2.2. Simplified illustration of component interaction in a Mahout user-based recommender
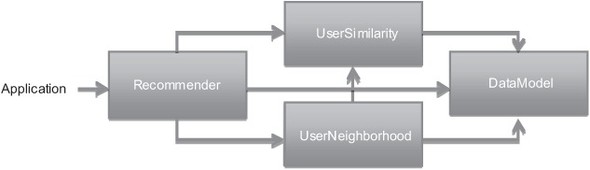
We’ll discuss each of these components in more detail in the next two chapters, but we can summarize the role of each component now. A DataModel implementation stores and provides access to all the preference, user, and item data needed in the computation. A UserSimilarity implementation provides some notion of how similar two users are; this could be based on one of many possible metrics or calculations. A UserNeighborhood implementation defines a notion of a group of users that are most similar to a given user. Finally, a Recommender implementation pulls all these components together to recommend items to users.
2.2.3. Analyzing the output
When you run the code in listing 2.2, the output in your terminal or IDE should be as follows:
RecommendedItem [item:104, value:4.257081]
The request asked for one top recommendation, and it got one. The recommender engine recommended book 104 to user 1. Further, it said that the recommender engine did so because it estimated user 1’s preference for book 104 to be about 4.3, and that was the highest among all the items eligible for recommendation.
That’s not bad. Book 107 did not appear; it was also recommendable but was only associated with a user who had different tastes. It picked 104 over 106, and this makes sense when you note that 104 is a bit more highly rated overall. Further, the output contained a reasonable estimate of how much user 1 likes item 104—something between the 4.0 and 4.5 that users 4 and 5 expressed.
The right answer isn’t obvious from looking at the data, but the recommender engine made some decent sense of it and returned a defensible answer. If you got a pleasant tingle out of seeing this simple program give a useful and non-obvious result from a small pile of data, the world of machine learning is for you!
For clear, small data sets, producing recommendations is as trivial as it appears in the preceding example. In real life, data sets are huge, and they’re noisy. For example, imagine a popular news site recommending news articles to readers. Preferences are inferred from article clicks, but many of these preferences may be bogus—maybe a reader clicked on an article but didn’t like it, or clicked on the wrong story. Perhaps many of the clicks occurred while not logged in, so they can’t be associated with a user. And imagine the size of the data set—perhaps billions of clicks in a month.
Producing the right recommendations from this data and producing them quickly isn’t trivial. Later, in case studies, we’ll present the tools Mahout provides to attack a range of such problems. They’ll show how standard approaches can produce poor recommendations or take a great deal of memory and CPU time, and how to configure and customize Mahout to improve performance.
2.3. Evaluating a recommender
A recommender engine is a tool, a means to answer the question, “What are the best recommendations for a user?” Before investigating the answers, it’s best to investigate the question. What exactly is a good recommendation? And how does one know when a recommender is producing them? The remainder of this chapter pauses to explore how to evaluate a recommender, because this will be useful when looking at specific recommender systems.
The best possible recommender would be a sort of psychic that could somehow know, before you do, exactly how much you’d like every possible item that you’ve not yet seen or expressed any preference for. A recommender that could predict all your preferences exactly would present all items ranked by your future preference and be done. These would be the best possible recommendations.
And indeed, most recommender engines operate by trying to do just this, estimating ratings for some or all other items. As a result, one way of evaluating a recommender’s recommendations is to evaluate the quality of its estimated preference values—that is, by evaluating how closely the estimated preferences match the actual preferences.
2.3.1. Training data and scoring
Those actual preferences don’t exist, though. Nobody knows for sure how you’ll like some new item in the future (including you). In the context of a recommender engine, this can be simulated by setting aside a small part of the real data set as test data. These test preferences aren’t present in the training data fed into a recommender engine under evaluation. Instead, the recommender is asked to estimate preferences for the missing test data, and estimates are compared to the actual values.
From there, it’s fairly simple to produce a kind of score for the recommender. For example, it’s possible to compute the average difference between estimate and actual preference. With a score of this type, lower is better, because that would mean the estimates differed from the actual preference values by less. A score of 0.0 would mean perfect estimation—no difference at all between estimates and actual values.
Sometimes the root-mean-square of the differences is used: this is the square root of the average of the squares of the differences between actual and estimated preference values. See table 2.1 for an illustration of this. Again, lower is better.
Table 2.1. An illustration of the average difference and root-mean-square calculation
|
Item 1 |
Item 2 |
Item 3 |
|
|---|---|---|---|
| Actual | 3.0 | 5.0 | 4.0 |
| Estimate | 3.5 | 2.0 | 5.0 |
| Difference | 0.5 | 3.0 | 1.0 |
| Average difference | = (0.5 + 3.0 + 1.0) / 3 = 1.5 | ||
| Root-mean-square | = √((0.52 + 3.02 + 1.02) / 3) = 1.8484 | ||
Table 2.1 shows the difference between a set of actual and estimated preferences, and how they’re translated into scores. Root-mean-square more heavily penalizes estimates that are way off, as with item 2 here, and that’s considered desirable by some. For example, an estimate that’s off by two whole stars is probably more than twice as bad as one off by just one star. Because the simple average of differences is perhaps more intuitive and easier to understand, upcoming examples will use it.
2.3.2. Running RecommenderEvaluator
Let’s revisit the example code and evaluate the simple recommender on this simple data set, as shown in the following listing.
Listing 2.3. Configuring and running an evaluation of a recommender

Most of the action happens in evaluate(): the RecommenderEvaluator splits the data into a training and test set, builds a new training DataModel and Recommender to test, and compares its estimated preferences to the actual test data.
Note that there’s no Recommender passed to evaluate(). That’s because, inside, the method will need to build a Recommender around a newly created training DataModel. The caller must provide an object that can build a Recommender from a DataModel—a RecommenderBuilder. Here, the method builds the same implementation that you tried earlier in this chapter.
2.3.3. Assessing the result
The program in listing 2.3 prints the result of the evaluation: a score indicating how well the Recommender performed. In this case, you should simply see 1.0. Even though a lot of randomness is used inside the evaluator to choose test data, the result should be consistent because of the call to RandomUtils.useTestSeed(), which forces the same random choices each time. This is only used in such examples, and unit tests, to guarantee repeatable results. Don’t use it in your real code!
What this value means depends on the implementation used—here, AverageAbsoluteDifferenceRecommenderEvaluator. A result of 1.0 from this implementation means that, on average, the recommender estimates a preference that deviates from the actual preference by 1.0.
A value of 1.0 isn’t great, on a scale of 1 to 5, but there’s very little data here to begin with. Your results may differ because the data set is split randomly, and the training and test set may differ with each run.
This technique can be applied to any Recommender and DataModel. To use root-mean-square scoring, replace AverageAbsoluteDifferenceRecommenderEvaluator with the implementation RMSRecommenderEvaluator.
Also, instead of passing the null parameter to evaluate(), you could instead pass an instance of DataModelBuilder, which can be used to control how the training DataModel is created from the training data. Normally the default is fine; it may not be if you’re using a specialized implementation of DataModel in your deployment—a DataModelBuilder is how you would inject it into the evaluation process.
The 1.0 parameter passed to evaluate() at the end controls how much of the overall input data is used. Here, it means 100 percent. This parameter can be used to produce a quicker, if less accurate, evaluation by using only a little of a potentially huge data set. For example, 0.1 would mean 10 percent of the data is used and 90 percent is ignored. This is quite useful when you want to quickly test small changes to a Recommender.
2.4. Evaluating precision and recall
We could also take a broader view of the recommender problem: it’s not strictly necessary to estimate preference values in order to produce recommendations. In many cases, presenting an ordered list of recommendations, from best to worst, is sufficient, without including estimated preference values. In fact, in some cases the exact ordering of the list doesn’t matter much—a set of a few good recommendations is fine.
Taking this more general view, we could also apply classic information retrieval metrics to evaluate recommenders: precision and recall. These terms are typically applied to things like search engines, which return a set of best results for a query out of many possible results.
A search engine shouldn’t return irrelevant results in the top results, but it should strive to return as many relevant results as possible. Precision is the proportion of top results that are relevant, for some definition of relevant. Precision at 10 would be this proportion judged from the top 10 results. Recall is the proportion of all relevant results included in the top results. See figure 2.3 for a visualization of these ideas.
Figure 2.3. An illustration of precision and recall in the context of search results

These terms can easily be adapted to recommenders: precision is the proportion of top recommendations that are good recommendations, and recall is the proportion of good recommendations that appear in top recommendations. The next section will define good.
2.4.1. Running RecommenderIRStatsEvaluator
Again, Mahout provides a fairly simple way to compute these values for a Recommender, as showing in the next listing.
Listing 2.4. Configuring and running a precision and recall evaluation

Without the call to RandomUtils.useTestSeed(), the result you see would vary significantly due to the random selection of training data and test data, and because the data set is so small here. But with the call, the result ought to be
0.75
1.0
Precision at 2 is 0.75; on average about three-quarters of recommendations were good. Recall at 2 is 1.0; all good recommendations are among those recommended.
But what exactly is a good recommendation here? The framework was asked to decide—it didn’t receive a definition. Intuitively, the most highly preferred items in the test set are the good recommendations, and the rest aren’t.
Listing 2.5. User 5’s preferences in the test data set
5,101,4.0
5,102,3.0
5,103,2.0
5,104,4.0
5,105,3.5
5,106,4.0
Look at user 5 in this simple data set again. Let’s imagine the preferences for items 101, 102, and 103 were withheld as test data. The preference values for these are 4.0, 3.0, and 2.0. With these values missing from the training data, a recommender engine ought to recommend 101 before 102, and 102 before 103, because this is the order in which user 5 prefers these items. But would it be a good idea to recommend 103? It’s last on the list; user 5 doesn’t seem to like it much. Book 102 is just average. Book 101 looks reasonable, because its preference value is well above average. Maybe 101 is a good recommendation; 102 and 103 are valid, but not good recommendations.
And this is the thinking that the RecommenderEvaluator employs. When not given an explicit threshold that divides good recommendations from bad, the framework will pick a threshold, per user, that’s equal to the user’s average preference value, μ, plus one standard deviation, σ:
threshold = μ + σ
If you’ve forgotten your statistics, don’t worry. This takes items whose preference value isn’t merely a little more than average (μ), but above average by a significant amount (σ). In practice, this means that about 16 percent of items that are most highly preferred are considered good recommendations to make back to the user. The other arguments to this method are similar to those discussed before and are more fully documented in the project’s Javadoc.
2.4.2. Problems with precision and recall
The usefulness of precision and recall tests in the context of recommenders depends entirely on how well a good recommendation can be defined. In the preceding section, the threshold was either given or defined by the framework. A poor choice will hurt the usefulness of the resulting score.
There’s a subtler problem with these tests, though. Here, they necessarily pick the set of good recommendations from among items for which the user has already expressed some preference. But the best recommendations are not necessarily among those the user already knows about!
Imagine running such a test for a user who would absolutely love the little-known French cult film, My Brother the Armoire. Let’s say it’s objectively a great recommendation for this user, but the user has never heard of this movie. If a recommender actually returned this film when recommending movies, it would be penalized; the test framework can only pick good recommendations from among those in the user’s set of preferences already.
The issue is further complicated when the preferences are Boolean and contain no preference value. There isn’t even a notion of relative preference on which to select a subset of good items. The best the test can do is randomly select some preferred items as the good ones.
The test nevertheless has some use. The items a user prefers are a reasonable proxy for the best recommendations for the user, but they’re by no means a perfect one. In the case of Boolean preference data, only a precision-recall test is available anyway. It’s worth understanding the test’s limitations in this context.
2.5. Evaluating the GroupLens data set
With these tools in hand, we can discuss not only the speed, but also the quality, of recommender engines. Although examples with large amounts of real data are still a couple of chapters away, it’s already possible to quickly evaluate performance on a small data set.
2.5.1. Extracting the recommender input
GroupLens (http://grouplens.org/) is a research project that provides several data sets of different sizes, each derived from real users’ ratings of movies. It’s one of several large, real-world data sets available, and more will be explored in this book.
From the GroupLens site, locate and download the “100K data set,” currently accessible at http://www.grouplens.org/node/73. Unarchive the file you download, and within find the file called ua.base. This is a tab-delimited file with user IDs, item IDs, ratings (preference values), and some additional information.
Will this file work? Tabs, not commas, separate its fields, and it includes an extra field of information at the end as well. Yes, the file will work with FileDataModel as is. Return to the code in listing 2.3, which built a RecommenderEvaluator, and try passing in the location of ua.base instead of the small data file. Run it again. This time, the evaluation should take a couple of minutes, because it’s now based on 100,000 preference values instead of a handful.
At the end, you should get a number around 0.9. That’s not bad, but somehow being off by almost a whole point on a scale of 1 to 5 doesn’t sound great. Perhaps the particular Recommender implementation we’re using isn’t the best for this kind of data?
2.5.2. Experimenting with other recommenders
Let’s test-drive a slope-one recommender on this data set—a simple algorithm that will reappear in chapter 4. It’s as easy as replacing the RecommenderBuilder with one that uses org.apache.mahout.cf.taste.impl.recommender.slopeone.SlopeOneRecommender, as shown in the next listing.
Listing 2.6. Changing the evaluation program to run a SlopeOneRecommender
RecommenderBuilder recommenderBuilder = new RecommenderBuilder() {
  @Override
  public Recommender buildRecommender(DataModel model)
      throws TasteException {
    return new SlopeOneRecommender(model);
  }
};
Run the evaluation again. You should find that it’s much quicker, and it produces an evaluation result around 0.748. That’s a move in the right direction.
This isn’t to say slope-one is always better or faster. Each algorithm has its own characteristics and properties that can interact in hard-to-predict ways with a given data set. For example, slope-one happens to be quick to compute recommendations at runtime, but it takes significant time to precompute its internal data structures before it can start. The user-based recommender that we tried first could be faster and more accurate on other data sets. We’ll explore the relative virtues of each algorithm in chapter 4.
This difference highlights how important testing and evaluation on real data are—and how relatively painless it can be with Mahout.
2.6. Summary
In this chapter, we introduced the idea of recommender engines. We even created some small input for a simple Mahout Recommender, ran it through a simple computation, and explained the results.
We then took time to evaluate the quality of a recommender engine’s output, because we’ll need to do this frequently in the coming chapters. This chapter covered evaluating the accuracy of a Recommender’s estimated preferences, as well as traditional precision and recall metrics as applied to recommendations. Finally, we tried evaluating a real data set from GroupLens and observed how evaluations can be used to empirically discover improvements to a recommender engine.
Before we go on to study recommender engines in detail, it’s important to spend some time with another foundational concept for recommenders in Mahout: the representation of data. We’ll look at that in the next chapter.